
The Hidden Half: How the World Conceals Its Secrets
by
Michael Blastland
Published 3 Apr 2019
He was the originator of BBC Radio 4’s More or Less, the long-standing, authoritative guide to numbers and evidence in public argument. He is the author with Andrew Dilnot of the bestselling The Tiger That Isn’t: Seeing Through a World of Numbers, a guide to interpreting numbers in public argument, and co-author with Professor David Spiegelhalter of The Norm Chronicles, about risk. He writes, teaches and advises widely on risk, evidence and data. First published in hardback and trade paperback in Great Britain in 2019 by Atlantic Books, an imprint of Atlantic Books Ltd. Copyright © Michael Blastland, 2019 The moral right of Michael Blastland to be identified as the author of this work has been asserted by him in accordance with the Copyright, Designs and Patents Act of 1988.
…
Assuming the underlying data was correct, here’s the answer: about 918 people in 100,000 who drank one alcoholic drink a day would develop an alcohol-related health problem in a year, compared with 914 in 100,000 who abstained. To frame the numbers another way: in 100,000 non-drinkers, 99,986 would be fine, compared with 99,982 among those who have one drink every day. The difference between risk and ‘no risk’ was tiny. As the statistician David Spiegelhalter remarked, driving is not risk free, but no one argues on those grounds for abstention. Come to think of it, he added, ‘there’s no safe level of living but nobody would recommend abstention’.20 Probability appears to suggest knowledge. But unless we put it properly into proportion, recognizing its limitations, this knowledge is bluster, capable at the extreme of causing harm.
…
Statistician Andrew Gelman of Columbia University in the US, writing with Thomas Basbøll from Copenhagen Business School, says they can be ‘a prime case of selection bias’; an excuse ‘for choosing the amusing, unexpected, and atypical rather than the run-of-the-mill boring reality that should form the basis for most of our social science’.12 Another statistician, David Spiegelhalter, says we need an immunity to misleading anecdote. One story can never stand as a general rule. Make too much of it, ignore the stories that run counter to it or the odds about which story is usually true, and you simply have another failure to generalize, and no idea what your story is worth.
Covid by Numbers
by
David Spiegelhalter
and
Anthony Masters
Published 28 Oct 2021
DAVID SPIEGELHALTER AND ANTHONY MASTERS Covid by Numbers Making Sense of the Pandemic with Data Contents ACKNOWLEDGEMENTS 1 Introduction THE VIRUS 2 How did the pandemic develop? 3 How infectious is SARS-CoV-2? 4 What is the risk from new variants? DIAGNOSIS AND CASES 5 How good are diagnostic tests? 6 How many cases have been found? 7 How many people have been infected with SARS-CoV-2? DISEASE AND ILLNESS 8 How ill do people get with Covid-19? 9 What happened in hospitals? 10 How good are the treatments for Covid-19? DEATH 11 How many people have died from Covid-19?
…
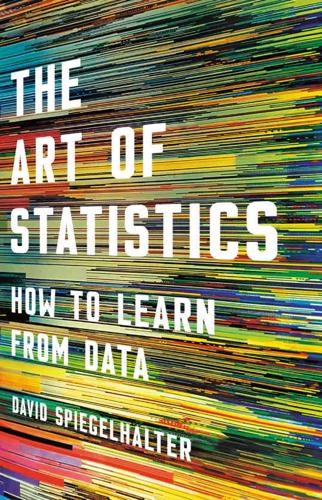
24 Who has been getting the vaccines? 25 How far apart should the vaccines be given? LOOKING FORWARD AND BACK 26 How good are the projections from epidemic models? 27 What is going to happen in the future? 28 Postscript GLOSSARY NOTES INDEX About the Authors Professor Sir David Spiegelhalter FRS OBE is Chair of the Winton Centre for Risk and Evidence Communication in the Centre for Mathematical Sciences at the University of Cambridge. His bestselling book, The Art of Statistics, was published in March 2019. He was knighted in 2014 for services to medical statistics, was President of the Royal Statistical Society (2017-2018), and became a Non-Executive Director of the UK Statistics Authority in 2020.
…
Cooper, Heather Montgomery, Kieron Sheehy Social Mobility: And Its Enemies Lee Elliot Major and Stephen Machin National Populism: The Revolt Against Liberal Democracy Roger Eatwell and Matthew Goodwin A Political History of the World Jonathan Holslag A Short History of Brexit From Brentry to Backstop Kevin O’Rourke Our Universe: An Astronomer’s Guide Jo Dunkley The Art of Statistics: Learning from Data David Spiegelhalter Chinese Thought: From Confucius to Cook Ding Roel Sterckx This is Shakespeare Emma Smith What We Really Do All Day Jonathan Gershuny and Oriel Sullivan The Government of No One Ruth Kinna Plunder of the Commons Guy Standing Artificial Intelligence Melanie Mitchell Can We Be Happier?
I Think You'll Find It's a Bit More Complicated Than That
by
Ben Goldacre
Published 22 Oct 2014
This random variation predicted by the Poisson distribution – before you even look at the real variations between areas – shows that you would expect some areas to have a death rate of seven, and some areas to have a death rate of thirty-two. So it turns out that the real UK variation, from nine to thirty-one, may actually be less than you’d expect from chance. Then Barden sent his blog to David Spiegelhalter, a Professor of Statistics at Cambridge, who runs the excellent website Understanding Uncertainty. Spiegelhalter suggested that Barden could present the real cancer figures as a funnel plot, and that’s what you see opposite. I cannot begin to tell you how happy it makes me that Spiegelhalter, author of Funnel Plots for Comparing Institutional Performance – the citation classic from 2005 – can be found by a random blogger online, and then collaborate to make an informative graph of some data that’s been over-interpreted by the BBC.
…
But it all comes down to the same thing. In our example above, alcohol wasn’t really associated with lung cancer. And in this BMJ paper, unplanned pregnancy wasn’t really associated with slower development. Pretending otherwise is just silly. Bicycle Helmets and the Law1 Ben Goldacre and David Spiegelhalter, British Medical Journal, 12 June 2013 We have both spent a large part of our working lives discussing statistics and risk with the general public. We both dread questions about bicycle helmets. The arguments are often heated and personal; but they also illustrate some of the most fascinating challenges for epidemiology, risk communication and evidence-based policy.
…
1 In case it’s been puzzling you, epidemiologists use ‘odds’ (e.g. 366 ÷ 2300 for the top row of Table 1) rather than ‘proportions’ (which would be 366 ÷ 2666 for the top row of Table 1) because odds work more neatly when you use ‘logistic regression’, which is the more advanced technique mentioned above. If you’re interested to know more, I recommend coming to London School of Hygiene and Tropical Medicine to do our MSc in Epidemiology. Bicycle Helmets and the Law 1 This is an editorial I wrote for the British Medical Journal with David Spiegelhalter about the complex, contradictory mess of evidence on the impact of bicycle helmets. Like most places where there’s controversy and disagreement, this is a great opportunity to walk through the benefits and shortcomings of different epidemiological techniques, from case-control studies to modelling.
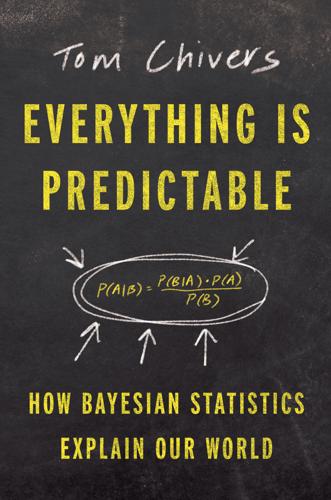
Everything Is Predictable: How Bayesian Statistics Explain Our World
by
Tom Chivers
Published 6 May 2024
The former government minister John Redwood was probably the most famous: he demanded that “government advisers today need to tell us how they are going to stop false test results distorting the figures.”6 What had happened was that one of them had misinterpreted an interview with Professor Sir David Spiegelhalter, a cheerful statistician who spent a lot of time on national TV and radio during the pandemic patiently explaining testing accuracy or vaccine efficacy. They worked out that just because a test has a 1 percent false positive rate, it doesn’t mean that only 1 percent of positives are false. That was back between the first and second waves, when we were all doing polymerase chain reaction (PCR) tests every time we thought we had the sniffles.
…
So far, we’ve been talking about probability as though it’s all a real thing, out there in the world. The probability of a coin turning up heads is 0.5. The probability of seeing sixty or more heads in one hundred coin flips is about 2.8 percent. We say these things as though they’re facts about the world. Bayes turned that around. For Bayes—to quote Professor Sir David Spiegelhalter, the former president of the Royal Statistical Society, the former Winton Professor of the Public Understanding of Risk at Cambridge University, and surely the owner of the single most authoritative-sounding set of titles in all of statistical science—probability “is an expression of our lack of knowledge about the world.”47 That is, for Bayes, probability is subjective.
…
It continues in this vein at some length.110 Over the years there was also a song called “José Bernardo,” which was sung to the tune of the Macarena; Andy Grieve sang a repurposed medieval students’ drinking song, “Gaudeamus Igitur,” along with another future president of the Royal Statistical Society, Professor Sir David Spiegelhalter; there was a “Bayesians in the Night” to the tune of “Strangers in the Night”; a “Like a Bayesian” (“Like a Virgin”). And so on. I mentioned this on Twitter and Sir David got in touch to say that, alas, “Our performance of ‘The Full Monty Carlo’ was before the smartphone era, so no recordings exist.”111 (“Who would want to see a video of six male professors of Bayesian statistics taking their clothes off in front of a screaming crowd in a Spanish nightclub?”
Messy: The Power of Disorder to Transform Our Lives
by
Tim Harford
Published 3 Oct 2016
The report cards were easily misunderstood by patients, and surgeons were being pulled into fixating on what would make those report cards look good—namely, finding healthier patients rather than improving their medical skills. A further irony is that when two statisticians, Harvey Goldstein and David Spiegelhalter, looked at the report card data, they concluded that the main determinant of patient survival rates wasn’t the surgeon’s skill—they were all broadly similar—but pure luck. A surgeon might be one of the most dangerous doctors one year, and one of the safest the next.12 Such tunnel vision may be related to a time period.
…
It might be okay not to know your leveraged loans today, but if you don’t know your emerging market portfolio tomorrow, or your sovereign government exposure the day after tomorrow, are you really the right person to be chief executive of this company?”23 Andy Haldane isn’t the only person to argue for randomness in targets. A senior health care regulator under Tony Blair, Gwyn Bevan, has made much the same case for ambiguous or unpredictable targets in the UK’s National Health Service. So has David Spiegelhalter, one of the UK’s leading medical statisticians. And so has Andrew Dilnot, the head of the UK Statistics Authority.24 U.S. bank regulators have dipped their toes in the water of ambiguity, requesting information from banks without telling them how that information will be assessed. That’s good.
…
Steven Kerr, “On the Folly of Rewarding A, While Hoping for B,” Academy of Management Journal 18, no. 4 (December 1975), pp. 769–783, http://www.jstor.org/stable/255378. 11. Peter Smith, “On the Unintended Consequences of Publishing Performance Data in the Public Sector,” International Journal of Public Administration 18, no. 2–3 (1995), pp. 277–310, http://dx.doi.org/10.1080/01900699508525011. 12. Harvey Goldstein and David Spiegelhalter, “League Tables and Their Limitations: Statistical Issues in Comparisons of Institutional Performance,” Journal of the Royal Statistical Society Series A 159, no. 3 (1996), DOI: 10.2307/2983325. 13. Gwyn Bevan and Richard Hamblin, “Hitting and Missing Targets by Ambulance Services for Emergency Calls: Effects of Different Systems of Performance Measurement Within the UK,” Journal of the Royal Statistical Society Series A 172, no. 1 (2009), pp. 161–190. 14.
The Data Detective: Ten Easy Rules to Make Sense of Statistics
by
Tim Harford
Published 2 Feb 2021
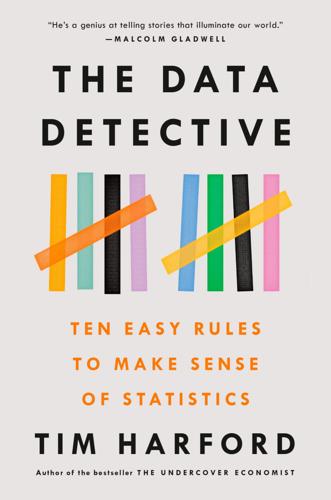
So let’s start by toning down the hype a little—both the apocalyptic idea that Cambridge Analytica can read your mind, and the giddy prospect that big data can easily replace more plodding statistical processes such as the CDC’s survey of influenza cases. When I first started grappling with big data, I called Cambridge University professor David Spiegelhalter, one of the UK’s leading statisticians and a brilliant statistical communicator. I summarized the cheerleading claims: of uncanny accuracy, of making sampling irrelevant because every data point was captured, and of consigning scientific models to the junk heap because “the numbers speak for themselves.”
…
Andrew Dilnot, who co-created More or Less with Michael Blastland, was extremely generous when I first asked for his advice. He has been so ever since. Under Hetan Shah’s leadership, everyone at the Royal Statistical Society made me feel every inch an honorary statistician. I’m grateful to them all. Two statistical gurus in particular have been so helpful to me in pondering this book: Denise Lievesley and David Spiegelhalter. David Bodanis, Paul Klemperer, and Bill Leigh all made invaluable comments after reading the entire manuscript—truly a selfless act—and Bruno Giussani caught an important error in an early draft. At Pushkin, Julia Barton, Ryan Dilley, Mia Lobel, and Jacob Weisberg have been a pleasure to work with—as well as supplying comments on a podcast script that helped make the tenth chapter a lot better.
…
Jeremy Ginsberg et al., “Detecting Influenza Epidemics Using Search Engine Query Data,” Nature 457, no. 7232 (February 19, 2009), 1012–14, DOI: 10.1038/nature07634. 2. Parts of this chapter are closely based on my article “Big Data: Are We Making a Big Mistake?,” Financial Times, March 28, 2014, https://www.ft.com/content/21a6e7d8-b479-11e3-a09a-00144feabdc0. I interviewed David Hand, Kaiser Fung, Viktor Mayer-Schönberger, David Spiegelhalter, and Patrick Wolfe in early 2014 for the piece. 3. David Lazer and Ryan Kennedy, “What We Can Learn from the Epic Failure of Google Flu Trends,” Wired, October 1, 2015, https://www.wired.com/2015/10/can-learn-epic-failure-google-flu-trends/; and Declan Butler, “What Google Flu Got Wrong,” Nature, February 13, 2013, https://www.nature.com/news/when-google-got-flu-wrong-1.12413. 4.
The Theory That Would Not Die: How Bayes' Rule Cracked the Enigma Code, Hunted Down Russian Submarines, and Emerged Triumphant From Two Centuries of Controversy
by
Sharon Bertsch McGrayne
Published 16 May 2011
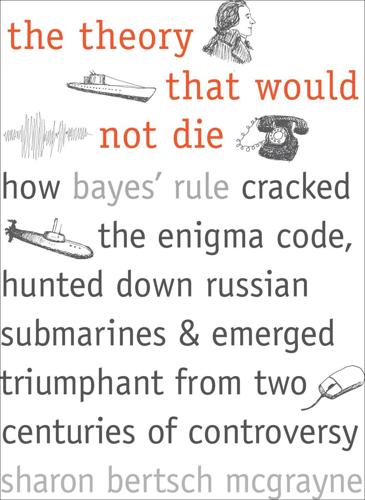
Frequency-based statisticians threw up their hands when Savage inquired whimsically, “Does whiskey do more harm than good in the treatment of snake bite?” Bayesians grinned and retorted, “Whiskey probably does more harm than good.”23 As a movement, Bayes was looking more akin to a philosophy—even a religion or a state of mind—than to a true-or-false scientific law like plate tectonics. According to David Spiegelhalter of Cambridge University, “It’s much more basic. . . . A huge sway of scientists says you can’t use probability to express your lack of knowledge or one-time events that don’t have any frequency to it. Probability came very late into civilization . . . [and many scientists find it] rather disturbing because it’s not a process of discovery.
…
Amid the Bayesian community’s frenzy over MCMC and Gibbs sampling, a generic software program moved Bayesian ideas out into the scientific and computer world. In an example of serendipity, two groups 80 miles apart worked independently during the late 1980s on different aspects of the same problem. While Smith and Gelfand were developing the theory for MCMC in Nottingham, Smith’s student, David Spiegelhalter, was working in Cambridge at the Medical Research Council’s biostatistics unit. He had a rather different point of view about using Bayes for computer simulations. Statisticians had never considered producing software for others to be part of their jobs. But Spiegelhalter, influenced by computer science and artificial intelligence, decided it was part of his.
…
Box interview. 14. Smith (1995) 308. 15. Sampson (1999) 126–27. 16. Ibid., 128. 17. Kotz and Johnson I 520. 18. Lindley (1989) 14. 19. Savage (1956). 20. Lindley in Erickson 49. 21. Savage in Fienberg (2006) 16–19. 22. Schrödinger 704. 23. Savage in Erickson 297. 24. David Spiegelhalter interview. 25. Robert E. Kass interview. 26. Anonymous. 27. Maurice G. Kendall 185. 28. Kruskal in Brooks, online. 29. Savage in Lindley letter to author. 30. Rivett. 31. Lindley letter to author. 32. Smith (1995) 312. 33. Lindley letter to author. 8. Jerome Cornfield, Lung Cancer, and Heart Attacks 1.
The Art of Statistics: How to Learn From Data
by
David Spiegelhalter
Published 2 Sep 2019
Copyright Copyright © 2019 by David Spiegelhalter Cover design by Chin-Yee Lai Cover image © by IAISI/Getty Images Cover copyright © 2019 Hachette Book Group, Inc. Hachette Book Group supports the right to free expression and the value of copyright. The purpose of copyright is to encourage writers and artists to produce the creative works that enrich our culture. The scanning, uploading, and distribution of this book without permission is a theft of the author’s intellectual property. If you would like permission to use material from the book (other than for review purposes), please contact permissions@hbgusa.com.
…
Estimates and Intervals CHAPTER 8 Probability—the Language of Uncertainty and Variability CHAPTER 9 Putting Probability and Statistics Together CHAPTER 10 Answering Questions and Claiming Discoveries CHAPTER 11 Learning from Experience the Bayesian Way CHAPTER 12 How Things Go Wrong CHAPTER 13 How We Can Do Statistics Better CHAPTER 14 In Conclusion DISCOVER MORE ABOUT THE AUTHOR GLOSSARY ALSO BY DAVID SPIEGELHALTER NOTES To statisticians everywhere, with their endearing traits of pedantry, generosity, integrity, and desire to use data in the best way possible Explore book giveaways, sneak peeks, deals, and more. Tap here to learn more. List of Figures 0.1 Age and Year of Death of Harold Shipman’s Victims 0.2 Time of Death of Harold Shipman’s Patients 0.3 The PPDAC Problem-Solving Cycle 1.1 30-Day Survival Rates Following Heart Surgery 1.2 Proportion of Child Heart Operations Per Hospital 1.3 Percentage of Child Heart Operations Per Hospital 1.4 Risk of Eating Bacon Sandwiches 2.1 Jar of Jelly Beans 2.2 Different Ways of Displaying Jelly Bean Guesses 2.3 Jelly-Bean Guesses Plotted on a Logarithmic Scale 2.4 Reported Number of Lifetime Opposite-Sex Partners 2.5 Survival Rates Against Number of Operations in Child Heart Surgery 2.6 Pearson Correlation Coefficients of 0 2.7 World Population Trends 2.8 Relative Increase in Population by Country 2.9 Popularity of the Name ‘David’ Over Time 2.10 Infographic on Sexual Attitudes and Lifestyles 3.1 Diagram of Inductive Inference 3.2 Distribution of Birth Weights 5.1 Scatter of Sons’ Heights v.
…
Z-score: a means of standardizing an observation xi in terms of its distance from the sample mean m expressed in terms of sample standard deviations s, so that zi = (xi–m)/s. An observation with a Z-score of 3 corresponds to being 3 standard deviations above the mean, which is a fairly extreme outlier. A Z-score can also be defined in terms of a population mean μ and standard deviation σ, in which case zi = (xi–μ)/σ. Also by David Spiegelhalter The Norm Chronicles Notes INTRODUCTION 1. The Signal and the Noise by Nate Silver (Penguin, 2012) is an excellent introduction to how statistical science can be applied to making predictions in sport and other domains. 2. The Shipman data is discussed in more detail in D. Spiegelhalter and N.
Drugs Without the Hot Air
by
David Nutt
Published 30 May 2012
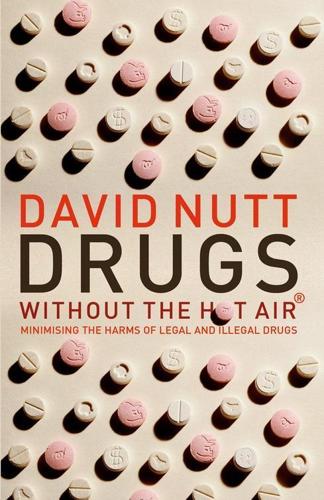
When the ACMD recommended that ecstasy be downgraded to Class B in 2008, 26the government made it clear that no matter what the evidence indicated, they were not going to consider any reduction in the Class A status of Ecstasy. Ecstasy: a moral issue Ecstasy is a harmful drug – in no way should this chapter be interpreted as saying anything different. But how harmful? As harmful as drinking five pints of beer? As harmful as getting on a motorbike? David Spiegelhalter, a professor of risk communication, has calculated that taking an ecstasy pill is 27as dangerous as riding a motorbike for about 6 miles or a push-bike for 20 miles. These sorts of comparisons are useful because they can help people make choices about their behaviour based on a realistic assessment of the risks.
…
a quantitative exploration of drug fatality reports in the popular press, Alasdair JM Forsyth, International Journal of Drug Policy (12), 2001 23 paper in Science• Severe dopaminergic neurotoxicity in primates after a common recreational dose regimen of MDMA, George Ricaurte, Science, September 26th 2002 24 formal retraction of his paper• Retraction: Severe dopaminergic neurotoxicity in primates after a common recreational dose regimen of MDMA, George Ricaurte, Science, September 12th 2003 25 an effective treatment for controlling its debilitating tremor• MDMA (“ecstasy”): a review of its harms and classification under the Misuse of Drugs Act 1971, ACMD, URL-8, February 2008 26 the government made it clear that no matter what the evidence indicated• House of Commons, Minutes of Evidence, Science and Technology Committee, URL-160. 27 as dangerous as riding a motorbike for about 6 miles or a push-bike for 20 miles• Cambridge Ideas – Professor Risk, David Spiegelhalter, URL-11, December 10th 2009 28 not at all clear that governments are especially influential on whether or not someone tries a drug• Drugs Policy - Lessons learnt and options for the future, Mike Trace, URL-12, February 23rd 2011 29 Reducing Americans’ Vulnerability to Ecstasy (RAVE) Act• RAVE Act, US Senate, URL-13, 2003.
…
Policy Exchange have calculated that 9cigarette taxes raise £10 billion a year, but the cost to the economy of treating tobacco related health problems is £13.7 billion. The longer the habit continues, the more the risks increase, particularly after the age of 30, as the body becomes less able to repair itself. David Spiegelhalter has calculated that 10each cigarette takes 11 minutes off your total lifespan, based on the fact that a 30 year old smoker of 30 cigarettes a day will die on average at 69, ten years younger than someone who never smoked. Second-hand smoke is also dangerous. It’s 11classified as a carcinogen by the WHO, and given a “class A” rating by the USA Environmental Protection Agency, in the same carcinogenic class as asbestos and arsenic.
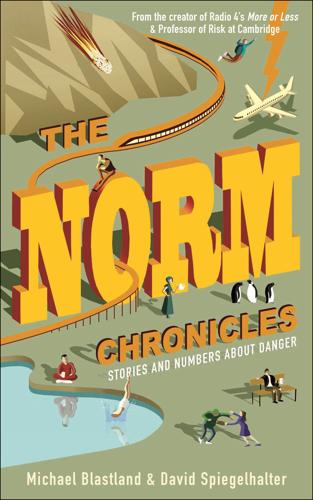
The Norm Chronicles
by
Michael Blastland
Published 14 Oct 2013
But they think that combining ideas and perspectives is the best way to make sense of the subjects of this book: danger, risk and chance – subjects that could be said to exist, as they hope to show, only in a clash of viewpoints. For Ron and Shirley – MB For Kate, Kate and Rosie, for putting up with me – DS THE NORM CHRONICLES Stories and Numbers about Danger MICHAEL BLASTLAND and DAVID SPIEGELHALTER First published in Great Britain in 2013 by PROFILE BOOKS LTD 3A Exmouth House Pine Street London EC1R 0JH www.profilebooks.com Copyright © Michael Blastland and David Spiegelhalter, 2013 1 3 5 7 9 10 8 6 4 2 Typeset in Garamond by MacGuru Ltd info@macguru.org.uk Printed and bound in Great Britain by Clays, Bungay, Suffolk The moral right of the authors has been asserted.
…
THE NORM CHRONICLES Despite starting out telling stories as an English Literature graduate working in journalism, MICHAEL BLASTLAND somehow learned to count, devising the Radio 4 programme about numbers More or Less and writing, with Andrew Dilnot, The Tiger That Isn’t, a guide to numbers in the news. On ice skates, he is life-threatening (mostly it’s his own life) but more afraid of other people’s raised umbrellas. His other risk dislikes include confined spaces, heights and fairground rides. DAVID SPIEGELHALTER is a statistician who rejoices in the title of Winton Professor for the Public Understanding of Risk at Cambridge University. He is, or was, a proper academic and has far too many letters after his name, but feels his greatest achievement is not doing badly in the risky TV programme Winter Wipeout.
Drink?: The New Science of Alcohol and Your Health
by
David Nutt
Published 9 Jan 2020
So while smoking leads to a high risk of two conditions, drinking over the safe limits doesn’t give such a high risk of any one condition – but it is involved in many more conditions. What are the risks of drinking? We all know smoking and being overweight is bad for us, and if we smoke or overeat, we know we shouldn’t. But drinking alcohol also has the same kind of long-term or chronic risk, which means it kills you slowly. The eminent statistician David Spiegelhalter uses the concept of the microlife to explain how fast it does this. One microlife is 30 minutes off your life expectancy. If you are a 30-year-old man, you will lose one microlife by smoking two cigarettes, or each day of being 5kg overweight, or for every seven units of alcohol. Seven units might be: two pints of strong 6 per cent beer or three pints of 4 per cent beer, three-and-a-half double gin and tonics (25ml pub measures), or three medium glasses (175ml) of 13 per cent wine.
…
Also to my many friends and colleagues who have taught me about alcohol over many decades but especially, Christer Allgulander, Ilana Crome, Dora Duka, Ian Gilmore, David Goldman, Tony Goldstone, Paul Glue, George Koob, Anne Lingford-Hughes, Markku Linnoila, Richard Lister, Jurgen Rhem, Marcus Munafo, Charles O’Brien, Robin Room, Nick Sheron, Julia Sinclair and Wim van den Brink. And for breakthrough insights in harm assessment and communication, Larry Philips and David Spiegelhalter. And my wife Di who has for 40 years put up with my chaotic academic and clinical life; and our daughter Suzy, who runs Abbotshill, our wine bar in Ealing, and has taught me the value of quality organic wine!

How Cycling Can Save the World
by
Peter Walker
Published 3 Apr 2017
The researchers concluded: “We were unable to detect an independent effect of legislation.”27 — Why is the public and government narrative about helmet use in some countries so at odds with the evidence? For this we turn to yet another BMJ article, in this case an opinion piece written by two experts with a knack of making complex concepts easy to follow—Dr. Ben Goldacre, a doctor who has a parallel media career debunking poorly written science articles, and David Spiegelhalter, professor of the public understanding of risk at Cambridge University. Even such a pair confessed they had reservations about tackling the subject. “We have both spent a large part of our working lives discussing statistics and risk with the general public,” they wrote. “We both dread questions about bicycle helmets.”
…
The Guardian, July 30, 2014, https://www.theguardian.com/environment/bike-blog/2014/jul/30/jersey-compulsory-cycle-helmet-law-emotion-not-evidence. 26 Dorothy Robinson, “No Clear Evidence from Countries that Have Enforced the Wearing of Helmets,” British Medical Journal, April 8, 2006. 27 Jessica Dennis et al., “Helmet Legislation and Admissions to Hospital for Cycling Related Head Injuries in Canadian Provinces and Territories: Interrupted Time Series Analysis,” British Medical Journal, May 14, 2013. 28 Ben Goldacre and David Spiegelhalter, “Bicycle Helmets and the Law,” British Medical Journal, June 12, 2013. 29 Shaun Helman et al., “Literature Review of Interventions to Improve the Conspicuity of Motorcyclists and Help Avoid ‘Looked but Failed to See’ Accidents,” Transport Research Laboratory, December 13, 2012, https://msac.org.nz/assets/Uploads/pdf/Visibility-Project-TRL-Report-w.pdf. 30 Ian Walker et al., The Influence of a Bicycle Commuter’s Appearance on Drivers’ Overtaking Proximities: An On-Road Test of Bicyclist Stereotypes, High-visibility Clothing and Safety Aids in the United Kingdom,” Accident Analysis and Prevention 64 (2014):69–77, http://opus.bath.ac.uk/37890/1/Walker_2013.pdf. 31 Interview with the author.
Doing Good Better: How Effective Altruism Can Help You Make a Difference
by
William MacAskill
Published 27 Jul 2015
academics continue to debate: An overview of the QALY, and issues in defining it and measuring how bad different conditions are, is given in Milton C. Weinstein, George Torrance, and Alistair McGuire, “QALYs: The Basics,” Value in Health 12, supplement 1 (2009): S5–S9. Note that these problems should not cause us to reject entirely the attempt to think in terms of quantitative harms and benefits. David Spiegelhalter, Winton Professor of the Public Understanding of Risk at the University of Cambridge, puts the point nicely: “Of course the QALY approach is not perfect, but some mechanism is needed to provide consistent comparisons across different medical interventions, based on aggregate benefit and cost.
…
The same concept: Richard Wilson, “Analyzing the Daily Risks of Life,” Technology Review 81, no. 4 (February 1979), 45. Whereas an hour on a train: Many of these facts also appear in the excellent book The Norm Chronicles: Stories and Numbers About Danger and Death by Michael Blastland and David Spiegelhalter (New York: Basic Books, 2014). Psychologists have found: See George F. Loewenstein, Eike U. Weber, Christopher K. Hsee, and Ned Welch, “Risk as Feelings,” Psychological Bulletin 127, no. 2 (March 2001), 267–86. “Nobody in their right mind”: “Your FREAK-quently asked questions, answered,” Freakonomics (blog), January 20, 2011, http://freakonomics.com/2011/01/20/freakonomics-radio-your-freak-quently-asked-questions-answered/.
The Art of Statistics: Learning From Data
by
David Spiegelhalter
Published 14 Oct 2019
Cooper, Heather Montgomery, Kieron Sheehy Social Mobility: And Its Enemies Lee Elliot Major and Stephen Machin National Populism: The Revolt Against Liberal Democracy Roger Eatwell and Matthew Goodwin A Political History of the World Jonathan Holslag A Short History of Brexit From Brentry to Backstop Kevin O’Rourke Our Universe: An Astronomer’s Guide Jo Dunkley The Art of Statistics: Learning from Data David Spiegelhalter Chinese Thought: From Confucius to Cook Ding Roel Sterckx This is Shakespeare Emma Smith THE BEGINNING Let the conversation begin … Follow the Penguin twitter.com/penguinukbooks Keep up-to-date with all our stories youtube.com/penguinbooks Pin ‘Penguin Books’ to your pinterest.com/penguinukbooks Like ‘Penguin Books’ on facebook.com/penguinbooks Listen to Penguin at soundcloud.com/penguin-books Find out more about the author and discover more stories like this at penguin.co.uk PENGUIN BOOKS UK | USA | Canada | Ireland | Australia India | New Zealand | South Africa Penguin Books is part of the Penguin Random House group of companies whose addresses can be found at global.penguinrandomhouse.com.
…
Cooper, Heather Montgomery, Kieron Sheehy Social Mobility: And Its Enemies Lee Elliot Major and Stephen Machin National Populism: The Revolt Against Liberal Democracy Roger Eatwell and Matthew Goodwin A Political History of the World Jonathan Holslag A Short History of Brexit From Brentry to Backstop Kevin O’Rourke Our Universe: An Astronomer’s Guide Jo Dunkley The Art of Statistics: Learning from Data David Spiegelhalter Chinese Thought: From Confucius to Cook Ding Roel Sterckx This is Shakespeare Emma Smith THE BEGINNING Let the conversation begin … Follow the Penguin twitter.com/penguinukbooks Keep up-to-date with all our stories youtube.com/penguinbooks Pin ‘Penguin Books’ to your pinterest.com/penguinukbooks Like ‘Penguin Books’ on facebook.com/penguinbooks Listen to Penguin at soundcloud.com/penguin-books Find out more about the author and discover more stories like this at penguin.co.uk PENGUIN BOOKS UK | USA | Canada | Ireland | Australia India | New Zealand | South Africa Penguin Books is part of the Penguin Random House group of companies whose addresses can be found at global.penguinrandomhouse.com. First published 2019 Text copyright © David Spiegelhalter, 2019 The moral right of the author has been asserted Cover by Matthew Young Book design by Matthew Young ISBN: 978-0-241-25875-0 This ebook is copyright material and must not be copied, reproduced, transferred, distributed, leased, licensed or publicly performed or used in any way except as specifically permitted in writing by the publishers, as allowed under the terms and conditions under which it was purchased or as strictly permitted by applicable copyright law.
Choked: Life and Breath in the Age of Air Pollution
by
Beth Gardiner
Published 18 Apr 2019
They convey something urgent and vital, giving us a sense of a problem’s scale so we can compare it with other dangers and decide whether to do something about it. But sometimes it’s hard to take them the way they’re intended, to resist twisting the frightening figures into something that speaks to us more personally. David Spiegelhalter is a professor of the public understanding of risk at Cambridge University, so he knows that better than most. Estimating pollution deaths is tricky, he explains when we speak on the phone, and helping people know what to make of the numbers is even harder. He thinks Walton shouldn’t have published 9,416, because rounding it to “about 9,000” or “nearly 10,000,” would have given a clearer sense of its roughness.
…
These numbers are everywhere: more than a million and a half annual air pollution deaths each for China and India.10 Approaching a half million in Europe.11 Upward of a hundred thousand in America.12 None are arrived at by counting individual cases; like Walton’s, they’re all derived through complex statistical modeling. Even if you tried, David Spiegelhalter says, it would be impossible to compile a body-by-body tabulation, since pollution—unlike, say, a heart attack or stroke—is not a cause of death in the medical sense. It’s more akin to smoking, obesity, or inactivity, all risk factors that can hasten a death or make it more likely, either alone or as one of several contributing factors.
Science Fictions: How Fraud, Bias, Negligence, and Hype Undermine the Search for Truth
by
Stuart Ritchie
Published 20 Jul 2020
This would be an underestimate of the true effect: according to Wikipedia, the average height difference between men and women in Scotland was 13.7cm (or 5.5 inches) in 2008; https://en.wikipedia.org/wiki/Average_human_height_by_country#Table_ of_Heights 15. The specific details of the calculation of the p-value aren’t strictly necessary for understanding how it works. For a crystal-clear introduction to statistics in general, I’d recommend David Spiegelhalter, The Art of Statistics: Learning from Data (London: Penguin, 2019). For an accessible discussion of the more philosophical issues surrounding statistics, see Zoltan Dienes, Understanding Psychology as a Science: An Introduction to Scientific and Statistical Inference (New York: Palgrave Macmillan, 2008). 16.
…
The creator of this wonderful service, which actually takes into account a lot more information than just the temperature, is Colin Waddell. 23. This was also the suggestion of a paper that was part of a big debate on significance levels. See: Daniël Lakens et al., ‘Justify Your Alpha’, Nature Human Behaviour 2, no. 3 (Mar. 2018): pp. 168–71; https://doi.org/10.1038/s41562-018-0311-x 24. David Spiegelhalter, ‘Explaining 5-Sigma for the Higgs: How Well Did They Do?’, Understanding Uncertainty, 8 July 2012; https://understandinguncertainty.org/explaining-5-sigma-higgs-how-well-did-they-do 25. Richard Dawkins, ‘The Tyranny of the Discontinuous Mind’, New Statesman, 19 Dec. 2011; https://www.newstatesman.com/blogs/the-staggers/2011/12/issue-essay-line-dawkins.
Breathtaking: Inside the NHS in a Time of Pandemic
by
Rachel Clarke
Published 26 Jan 2021
That the flood of pseudoscientific statistics was intended, primarily, to bamboozle – to leave the population dazed, bemused and therefore compliant. When you are invited daily to celebrate supersized statistics – 100,000 tests a day; no, make that 250,000 – it is easy to lose sight of what matters. Sir David Spiegelhalter, Professor of the Public Understanding of Risk at Cambridge University, suggested in May that Downing Street was using ‘number theatre’ to manipulate the message rather than actually inform people. The chair of the UK Statistics Authority, Sir David Norgrove, was also forced to write to the health secretary, Matt Hancock, to urge him to improve the ‘trustworthiness’ of the way he presented data on coronavirus testing.
99%: Mass Impoverishment and How We Can End It
by
Mark Thomas
Published 7 Aug 2019
They narrow our breadth of information.33 President Obama commented, in the wake of the 2016 US presidential election and in the context of the role of the media: If we are not serious about facts and what’s true and what’s not, and particularly in an age of social media when so many people are getting their information in sound bites and off their phones, if we can’t discriminate between serious arguments and propaganda, then we have problems.34 ACADEMICS ARE CONCERNED Cambridge University has recently announced the formation of a new Centre for Risk and Evidence Communication, to be hosted within the Faculty of Mathematics. The aim of the centre is to ensure that relevant facts on important issues are presented accurately and transparently. Professor Sir David Spiegelhalter – Winton Professor for the Public Understanding of Risk, and Chair of the new Centre’s Executive Board – said: We reject claims that we live in a ‘post-truth’ society, and that people are fed up with experts. We do acknowledge, however, that the public, professionals and policy-makers are often ill-served by the way in which evidence is communicated.
Everybody Lies: Big Data, New Data, and What the Internet Can Tell Us About Who We Really Are
by
Seth Stephens-Davidowitz
Published 8 May 2017
Data for this section can be found on my website, sethsd.com, in the section “Sex.” 122 11 percent of women: Current Contraceptive Status Among Women Aged 15–44: United States, 2011–2013, Centers for Disease Control and Prevention, http://www.cdc.gov/nchs/data/databriefs/db173_table.pdf#1. 122 10 percent of them to become pregnant every month: David Spiegelhalter, “Sex: What Are the Chances?” BBC News, March 15, 2012, http://www.bbc.com/future/story/20120313-sex-in-the-city-or-elsewhere. 122 1 in 113 women of childbearing age: There are roughly 6.6 million pregnancies every year and there are 62 million women between ages 15 and 44. 128 performing oral sex on the opposite gender: As mentioned, I do not know the gender of a Google searcher.
Stealing Fire: How Silicon Valley, the Navy SEALs, and Maverick Scientists Are Revolutionizing the Way We Live and Work
by
Steven Kotler
and
Jamie Wheal
Published 21 Feb 2017
Within a week, Nutt was called before the home secretary (somewhere between the U.S. attorney general and the head of homeland security) and was publicly chastised for his irresponsible and incendiary remarks. Yet, for Nutt, what he was saying wasn’t incendiary, it was simply the facts. “Ecstasy is a harmful drug,”20 he explained in his 2012 bestseller, Drugs—Without the Hot Air. “But how harmful? As harmful as drinking five pints of beer? As harmful as riding a motorbike? David Spiegelhalter, a professor of risk communications [at Cambridge University], has calculated that taking an ecstasy pill is as dangerous as riding a motorbike for about six miles or a [pedal] bike for twenty miles. These sorts of comparisons are useful because they can help people make choices about their behavior based on realistic assessments of the risks.

The Government of No One: The Theory and Practice of Anarchism
by
Ruth Kinna
Published 31 Jul 2019
Cooper, Heather Montgomery, Kieron Sheehy Social Mobility: And Its Enemies Lee Elliot Major and Stephen Machin National Populism: The Revolt Against Liberal Democracy Roger Eatwell and Matthew Goodwin A Political History of the World Jonathan Holslag A Short History of Brexit From Brentry to Backstop Kevin O’Rourke Our Universe: An Astronomer’s Guide Jo Dunkley The Art of Statistics: Learning from Data David Spiegelhalter Chinese Thought: From Confucius to Cook Ding Roel Sterckx This is Shakespeare Emma Smith What We Really Do All Day Jonathan Gershuny and Oriel Sullivan The Government of No One Ruth Kinna Plunder of the Commons Guy Standing THIS IS JUST THE BEGINNING Find us online and join the conversation Follow us on Twitter twitter.com/penguinukbooks Like us on Facebook facebook.com/penguinbooks Share the love on Instagram instagram.com/penguinukbooks Watch our authors on YouTube youtube.com/penguinbooks Pin Penguin books to your Pinterest pinterest.com/penguinukbooks Listen to audiobook clips at soundcloud.com/penguin-books Find out more about the author and discover your next read at penguin.co.uk PENGUIN BOOKS UK | USA | Canada | Ireland | Australia India | New Zealand | South Africa Penguin Books is part of the Penguin Random House group of companies whose addresses can be found at global.penguinrandomhouse.com.
Calling Bullshit: The Art of Scepticism in a Data-Driven World
by
Jevin D. West
and
Carl T. Bergstrom
Published 3 Aug 2020
The authors of the study calculated that having a single daily drink would lead to four additional cases of alcohol-related illness per 100,000 people. You would have to have 25,000 people consume one drink a day for a year in order to cause a single additional case of illness. Now the risk of low-level drinking doesn’t sound as severe. To provide further perspective, David Spiegelhalter computed the amount of gin that those 25,000 people would drink over the course of the year: 400,000 bottles. Based on this number, he quipped that it would take 400,000 bottles of gin shared across 25,000 people to cause a single additional case of illness. To be fair, this is the risk from drinking one drink a day; the risk rises substantially for those who consume larger amounts.

The Road to Conscious Machines
by
Michael Wooldridge
Published 2 Nov 2018
Cooper, Heather Montgomery, Kieron Sheehy Social Mobility: And Its Enemies Lee Elliot Major and Stephen Machin National Populism: The Revolt Against Liberal Democracy Roger Eatwell and Matthew Goodwin A Political History of the World Jonathan Holslag A Short History of Brexit From Brentry to Backstop Kevin O’Rourke Our Universe: An Astronomer’s Guide Jo Dunkley The Art of Statistics: Learning from Data David Spiegelhalter Chinese Thought: From Confucius to Cook Ding Roel Sterckx This is Shakespeare Emma Smith What We Really Do All Day Jonathan Gershuny and Oriel Sullivan The Government of No One Ruth Kinna Plunder of the Commons Guy Standing THIS IS JUST THE BEGINNING Find us online and join the conversation Follow us on Twitter twitter.com/penguinukbooks Like us on Facebook facebook.com/penguinbooks Share the love on Instagram instagram.com/penguinukbooks Watch our authors on YouTube youtube.com/penguinbooks Pin Penguin books to your Pinterest pinterest.com/penguinukbooks Listen to audiobook clips at soundcloud.com/penguin-books Find out more about the author and discover your next read at penguin.co.uk PENGUIN BOOKS UK | USA | Canada | Ireland | Australia India | New Zealand | South Africa Penguin Books is part of the Penguin Random House group of companies whose addresses can be found at global.penguinrandomhouse.com.
Drunk: How We Sipped, Danced, and Stumbled Our Way to Civilization
by
Edward Slingerland
Published 31 May 2021
But let us never lose sight of the fact that drinking, or smoking, or taking an occasional mushroom trip is primordially, atavistically fun. Let us flash our eyes and drink the milk of Paradise. Let us be not afraid to get drunk “in a primary way,” for this is what reconnects us to the flow of experience that other animals get to simply take for granted. It Is Time to Be Drunk Sir David Spiegelhalter, Winton Professor for the Public Understanding of Risk at the University of Cambridge, disputed the conclusions of the Lancet article’s authors, noting that the data showed only a very low level of harm in moderate drinkers. “Given the pleasure presumably associated with moderate drinking, claiming there is no ‘safe’ level does not seem an argument for abstention,” he said.

Artificial Intelligence: A Modern Approach
by
Stuart Russell
and
Peter Norvig
Published 14 Jul 2019
Pearl (1986) developed a clustering algorithm for exact inference in general Bayesian networks, utilizing a conversion to a directed polytree of clusters in which message passing was used to achieve consistency over variables shared between clusters. A similar approach, developed by the statisticians David Spiegelhalter and Steffen Lauritzen (Lauritzen and Spiegelhalter, 1988), is based on conversion to an undirected form of graphical model called a Markov network. This approach is implemented in the HUGIN system, an efficient and widely used tool for uncertain reasoning (Andersen et al., 1989). The basic idea of variable elimination—that repeated computations within the overall sum-of-products expression can be avoided by caching—appeared in the symbolic probabilistic inference (SPI) algorithm (Shachter et al., 1990).