GDP growth

back to index

499 results

pages: 205 words: 55,435

The End of Indexing: Six Structural Mega-Trends That Threaten Passive Investing
by Niels Jensen
Published 25 Mar 2018

The facts To fully understand what is going on, I suggest you take a good look at the following four exhibits (1.1.1–1.1.4). As you can see, GDP growth, in both nominal and real terms, productivity growth and inflation have all trended down for a very long time – by most accounts since the 1970s – so something very fundamental must be astray. Exhibit 1.1.1: Nominal GDP growth by decade (compound annual growth rate, CAGR) Exhibit 1.1.2: Real GDP growth by decade (CAGR) Exhibit 1.1.3: GDP growth per hour worked by decade (CAGR) Exhibit 1.1.4: Average annual inflation by decade (CPI) Source: Strategic Economic Decisions (2016). A very simple way to measure GDP growth Let’s begin our journey with something very basic.

Nowadays, it is often called the Liquidity Trap. When debt rises fast – and fast in this context means faster than GDP growth – capital that could otherwise be used productively to enhance GDP growth is instead used to service existing debt, i.e. it is used unproductively. Debt rising faster than GDP is a vicious circle. As GDP growth slows, more debt is needed to service existing debt, which will cause GDP growth to slow even further. Debt therefore continues to grow, and GDP growth continues to slow, until it all ends in tears. What we are now beginning to see are the first signs of Push on a String.

However, given the Trump administration’s appetite for infrastructure investing, US GDP growth should benefit, so I have taken the liberty to bump up my base case for US GDP growth to 1.5% annually. I have chosen to use 2.5% annual GDP growth as my best case and 1% as my worst case. The numbers are not symmetrical around my base case, as I think Trump and subsequent US presidents will increase public spending quite dramatically, should GDP growth drop below 1%. In that context, I ought to say that actual GDP growth, when measured from one year to the next, can be vastly different and will very much depend on cyclical factors.

pages: 403 words: 111,119

Doughnut Economics: Seven Ways to Think Like a 21st-Century Economist
by Kate Raworth
Published 22 Mar 2017

This century needs economic thinking that unleashes regenerative design in order to create a circular – not linear – economy, and to restore humans as full participants in Earth’s cyclical processes of life. Seventh, be agnostic about growth. One diagram in economic theory is so dangerous that it is never actually drawn: the long-term path of GDP growth. Mainstream economics views endless economic growth as a must, but nothing in nature grows for ever and the attempt to buck that trend is raising tough questions in high-income but low-growth countries. It may not be hard to give up having GDP growth as an economic goal, but it is going to be far harder to overcome our addiction to it. Today we have economies that need to grow, whether or not they make us thrive: what we need are economies that make us thrive, whether or not they grow.

Add to this the apparently reasonable assumption that consumers always prefer more to less, and it is a short step to concluding that continual income growth (and therefore output growth) is a decent proxy for ever-improving human welfare. And with that, the cuckoo has hatched. Like hoodwinked mother birds, we student-economists faithfully nurtured the goal of GDP growth, poring over the latest competing theories of what makes economic output grow: was it a nation’s adoption of new technologies, its growing stock of machinery and factories, or even its stock of human capital? Yes, these were all fascinating questions, but not once did we seriously stop to ask whether GDP growth was always needed, always desirable or, indeed, always possible. It was only when I opted to study what was at the time an obscure topic – the economics of developing countries – that the question of goals popped up.

Indeed, as GNP reached the height of its popularity in the early 1960s, Kuznets became one of its most outspoken critics, having warned from the start that ‘the welfare of a nation can scarcely be inferred from a measure of national income’.15 GDP growth: forwards and upwards. The metric’s creator himself may have offered up that caveat but economists and politicians alike tucked it quietly to one side: the appeal of a single year-on-year indicator for measuring economic progress had become too strong. And so over half a century, GDP growth shifted from being a policy option to a political necessity, and the de facto policy goal. To enquire whether further growth was always desirable, necessary, or indeed possible, became irrelevant, or political suicide.

pages: 159 words: 45,073

GDP: A Brief but Affectionate History
by Diane Coyle
Published 23 Feb 2014

For a more recent comparison, the average annual real-terms growth rate for OECD countries in the first half of the 2000s—considered a boom period in recent economic history—was 2.5 percent on average. Table 2: Real Annual GDP Growth Rates (Percent) Country 1950–1973 1973–1998 United States 3.93 2.99 United Kingdom 2.93 2.00 France 5.05 2.10 Germany 5.68 1.76 Japan 4.61 4.96 Source: Angus Maddison, The World Economy: A Millennial Perspective (Paris: Organization for Economic Cooperation and Development, 2000). Even though the business cycle—the periodic downs and ups of the economy as a whole—returned, GDP growth continued above its earlier rates during the 1950s, 1960s, and early 1970s. In the United States, GDP growth averaged nearly 4 percent a year from 1950 to 1973, compared with less than 3 percent a year between the two world wars.

So far, this has been about “nominal” measures, that is, dollar or pound sterling amounts. For the purposes of economic policy, the split between inflation and “real” growth is needed. Achieving higher (nominal) GDP growth through inflation alone would be a bad sign about economic management; that was what happened in the mid-1970s when in many countries governments responded badly to big hikes in the price of oil and got the mix of slow or negative real GDP growth and high inflation labeled “stagflation.” Nominal GDP continued to grow even though living standards were falling and unemployment was rising. So, to calculate real GDP statisticians have to collect data on prices and combine that into a general price index, the GDP deflator.

THE POSTWAR REBOUND It is one of the distasteful aspects of a disaster that the immediate consequence is a boom in GDP growth. GDP does not measure the nation’s assets or balance sheet, only its flow of income, expenditure, and production from year to year. Wipe out a portion of the assets, whether through natural or manmade disaster, and the activity or repairing and replacing will increase the growth of GDP. Exactly this pattern occurred after World War II. Table 2 shows real GDP growth rates for the member countries of the OEEC in the postwar era compared with the subsequent twenty-five years. For a more recent comparison, the average annual real-terms growth rate for OECD countries in the first half of the 2000s—considered a boom period in recent economic history—was 2.5 percent on average.

pages: 566 words: 163,322

The Rise and Fall of Nations: Forces of Change in the Post-Crisis World
by Ruchir Sharma
Published 5 Jun 2016

To produce strong economic growth in a country with a shrinking population is close to impossible, or as the European Commission warned in 2005, “Never in history has there been economic growth without population growth.”2 Based on the record for nearly 200 countries going back to 1960, there are 698 cases in which data for both population growth and GDP growth are available for a full decade. Among these cases, there were 38 in which a country’s working-age population was shrinking over the course of the decade, and the average GDP growth rate for these countries was just 1.5 percent. And in only three of the 698 cases did a country with a shrinking population manage to sustain a GDP growth rate of 6 percent or more. All three were small countries bouncing back from a period of political turmoil, postwar chaos, or post–Soviet collapse: Portugal in the 1960s, and Georgia and Belarus between 2000 and 2010.

It meant that these countries had to borrow a lot more capital to produce the same amount of economic growth, in part because so much of the capital was going to wasteful state projects or government giveaways. What this ratio shows is that before 2007, it took one dollar of new debt to generate one dollar of GDP growth in the emerging world, including in China. Five years after the global crisis, it took two dollars of new debt to generate one dollar of GDP growth in the emerging world, and in China it took four dollars of new debt to generate a dollar of GDP growth. The evidence for these diminishing returns was everywhere. In Russia, Brazil, India, and especially China, private companies had been cutting investment even as the state had been investing more, and this shift from private to public investment had produced more and more waste.

National economies often suffer recessions, but because there are always fast-growing nations somewhere in the world, the global economy rarely shrinks as a whole. The International Monetary Fund therefore defines a global recession not in terms of negative GDP growth but in terms of falling income growth, job losses, and other factors that make the world feel like it is in the grips of a recession. According to the IMF, there have been four such instances: in the mid-1970s, the early 1980s, the early 1990s, and 2008–9. In all four cases, global GDP growth fell below 2 percent, compared to its long-term growth rate of 3.5 percent.* Global growth also dropped under 2 percent in 2001, when the U.S. tech bubble burst.

pages: 286 words: 87,168

Less Is More: How Degrowth Will Save the World
by Jason Hickel
Published 12 Aug 2020

Before long, Darwin’s work had become scientific consensus, and it forever changed the way we see the world. Something similar is happening right now. As evidence about the relationship between GDP growth and ecological collapse continues to mount, scientists around the world are shifting their approach. In 2018, 238 scientists called on the European Commission to abandon GDP growth and focus on human well-being and ecological stability instead.43 The following year, more than 11,000 scientists from over 150 countries published an article calling on the world’s governments ‘to shift from pursuing GDP growth and affluence toward sustaining ecosystems and improving well-being.’44 This would have been unthinkable in mainstream circles only a few years ago, but now there’s a striking new consensus forming.

The governments of the world are bound to a new rule: not to achieve a level of output adequate to improve wages and build social services, but rather to pursue growth for its own sake. The concrete use-values of economic production (meeting human needs) have been subordinated to the pursuit of abstract exchange-value (GDP growth). Governments justify this by saying that GDP growth is the only way to reduce poverty, to create jobs and to improve people’s lives. Indeed, growth has come to stand in for human well-being, and even progress itself. This is remarkable, given that GDP measures such a narrow slice of economic activity. GDP growth is, ultimately, an indicator of the welfare of capitalism. That we have all come to see it as a proxy for the welfare of humans represents an extraordinary ideological coup.

And at the Bretton Woods Conference in 1944, when world leaders sat down to decide the rules that would govern the world economy in the wake of the war, it was enshrined as the key indicator of economic progress – exactly what Kuznets had warned against. Of course, there’s nothing inherently wrong with measuring some things and not others. GDP itself doesn’t have any impact in the real world, one way or the other. GDP growth, however, does. As soon as we start focusing on GDP growth, we’re not only promoting the things GDP measures, we’re promoting the indefinite increase of those things, regardless of the costs. Initially, economists used GDP to measure ‘levels’ of economic output. Was the level too high, causing excess production and a glut of supply?

pages: 460 words: 107,454

Stakeholder Capitalism: A Global Economy That Works for Progress, People and Planet
by Klaus Schwab
Published 7 Jan 2021

Despite the warning, no one listened. Policymakers and central banks did everything they could to prop up GDP growth. Now, their efforts are exhausted. GDP does not grow like it used to, and well-being stopped increasing a long time ago. A feeling of permanent crisis has taken hold of societies, and perhaps with good reason. As Kuznets knew, we never should have made GDP growth the singular focus of policymaking. Alas, that is where we are. GDP growth is our key measurement and has permanently slowed. Low GDP Growth As we outlined in Chapter 1, the global economy in the last 75 years has known many periods of rapid expansion, as well as some significant recessions.

That type of economic environment is discouraging to both workers, companies, and policymakers because it indicates little opportunity for advancement. Figure 2.1 World GDP Growth Has Been Trending Downward since the 1960s Source: Redrawn from World Bank GDP growth (annual %), 1960–2019. Perhaps in response to slowing economic growth, economists have since changed their definition of what constitutes a global recession. But it does not alter the fact we have seen meager global economic growth ever since. As a matter of fact, economic growth of less than 3 percent per year seems to be the new normal. Even before the COVID crisis, the IMF did not expect global GDP growth to return to above the 3 percent threshold for the next half decade,12, 13, 14 and that outlook has been negatively affected by the worst public health crisis in a century.

For over a decade, from 2002 to 2014, the Financial Times calculated,18 emerging markets consistently outperformed their developed world peers, not just in growth but in per capita GDP growth (Figure 3.1). The result was, as economist Richard Baldwin dubbed it, “the great convergence”:19 the incomes and GDP of poorer, emerging markets, moved closer to that of richer, developed markets. Unfortunately, that trend in recent years has come to an end for most emerging markets, bar China and India. Since 2015, per capita GDP growth in the 30 largest emerging markets fell back below that of the 22 largest developed ones. The fact that China's growth in those years fell to under 7 percent is no exception.

pages: 460 words: 107,454

Stakeholder Capitalism: A Global Economy That Works for Progress, People and Planet
by Klaus Schwab and Peter Vanham
Published 27 Jan 2021

Despite the warning, no one listened. Policymakers and central banks did everything they could to prop up GDP growth. Now, their efforts are exhausted. GDP does not grow like it used to, and well-being stopped increasing a long time ago. A feeling of permanent crisis has taken hold of societies, and perhaps with good reason. As Kuznets knew, we never should have made GDP growth the singular focus of policymaking. Alas, that is where we are. GDP growth is our key measurement and has permanently slowed. Low GDP Growth As we outlined in Chapter 1, the global economy in the last 75 years has known many periods of rapid expansion, as well as some significant recessions.

That type of economic environment is discouraging to both workers, companies, and policymakers because it indicates little opportunity for advancement. Figure 2.1 World GDP Growth Has Been Trending Downward since the 1960s Source: Redrawn from World Bank GDP growth (annual %), 1960–2019. Perhaps in response to slowing economic growth, economists have since changed their definition of what constitutes a global recession. But it does not alter the fact we have seen meager global economic growth ever since. As a matter of fact, economic growth of less than 3 percent per year seems to be the new normal. Even before the COVID crisis, the IMF did not expect global GDP growth to return to above the 3 percent threshold for the next half decade,12, 13, 14 and that outlook has been negatively affected by the worst public health crisis in a century.

For over a decade, from 2002 to 2014, the Financial Times calculated,18 emerging markets consistently outperformed their developed world peers, not just in growth but in per capita GDP growth (Figure 3.1). The result was, as economist Richard Baldwin dubbed it, “the great convergence”:19 the incomes and GDP of poorer, emerging markets, moved closer to that of richer, developed markets. Unfortunately, that trend in recent years has come to an end for most emerging markets, bar China and India. Since 2015, per capita GDP growth in the 30 largest emerging markets fell back below that of the 22 largest developed ones. The fact that China's growth in those years fell to under 7 percent is no exception.

pages: 287 words: 44,739

Guide to business modelling
by John Tennent , Graham Friend and Economist Group
Published 15 Dec 2005

MACROECONOMIC FACTORS Chart 9.4 Extended GDP input assumptions Turning to the gdp workings sheet, a simple IF statement is added to the original gdp growth rate calculation to examine whether a manual entry has been made. If no entry has been made, gdp growth input ⫽ “” is TRUE, there is no entry, and the original calculation is performed. If an entry is present, then that entry is used. Chart 9.5 shows the revised formula and provides the results for year 2 when the manual input of 1.50% is used. Chart 9.5 Revised GDP growth rate calculation Row Calculation Actual calculation GDP growth rate ⫽IF(GDP_input_GDP_growth_ input⫽“”,ROUNDUP(SINE_curve_ position*Half_of_amplitude⫹ Adjusted_growth_rate,4),GDP_ input_GDP_growth_input) ⫽IF(FALSE,ROUNDUP (⫺80.9%⫻0.5%⫹1.501%, 4),1.500%) Answer 1.500% Chart 9.6 shows the revised gdp workings with manual entries for the first two years of the forecast.

Chart 9.3 GDP workings code Row Calculation Actual calculation Answer SINE curve position ⫽SIN((PI()*2)/GDP_input_length_ of_cycle*(Year⫹GDP_input_length _of_cycle*GDP_input_cycle_start_ point)) ⫽GDP_input_total_GDP_amplitude/2 ⫽(GDP_input_average_GDP_growth _rate*(1⫹GDP_input_average_ GDP_growth_trend)^(Year⫺1)) ⫽ROUNDUP(SINE_curve_position* Half_of_amplitude⫹ Adjusted_growth_rate,4) ⫽IF(Year⫽1, GDP_input_gross_domestic_ product*(1⫹GDP_growth_rate), Previous_year_GDP*(1⫹ GDP_growth_rate)) ⫽SIN((3.14*2)/5* (1⫹5*25%)) 30.9% Half of amplitude Adjusted growth rate GDP growth rate GDP ⫽1.0%/2 ⫽(1.5%*(1⫹0.05%)^ (1⫺1)) 0.5% 1.500% ⫽ROUNDUP(30.9%* 0.5%⫹1.500%,4) 1.660% ⫽IF(TRUE,23000* (1⫹1.660%)) 23,381.8 The use of an IF statement in row 9 is required to ensure that the same formula can be used in each year.

Numerous variables determine the growth of gdp, and to produce a formula that explains gdp growth is beyond the scope of this book. However, Gross domestic product 71 many years of observation have revealed that gdp growth rates do not change dramatically from year to year and that they generally follow a cyclical pattern – sometimes described as the business cycle. These two observations can be used to produce a simple forecast for gdp growth and gdp. The approach used assumes an average underlying gdp growth rate that has a linear trend in either a positive or a negative direction. The actual rate of growth in any one year, however, will depend on the position within the business cycle.

pages: 337 words: 89,075

Understanding Asset Allocation: An Intuitive Approach to Maximizing Your Portfolio
by Victor A. Canto
Published 2 Jan 2005

Table 5.2 Average monthly equity and fixed-income returns during different combinations of rising and falling inflation and rising and falling real GDP growth sample: 1948–2004. Equity Returns GDP Growth Increasing Decreasing Increasing Inflation 0.33% 0.22% Decreasing Inflation 1.17% 0.87% T-Bond Returns GDP Growth Increasing Decreasing Increasing Inflation –0.44% 0.17% Decreasing Inflation 0.30% 0.51% Source: National Bureau of Economic Research and Ibbotson Associates So far, the data presented link the two asset classes’ (equities and fixed income) relative and absolute returns to the economic environment as described by inflation and GDP growth. Thus, the different inflation and GDP growth combinations can be used to characterize some textbook representations of the world.

A direct corollary exists between high-growth nations (China) and high-oil-use nations (China). 7 50 6 45 5 40 U.S. 4 35 3 2 30 25 Oil 1 20 0 15 1999 2000 Figure 11.4a 2003 2004 2005 U.S. real GDP growth and oil prices. 320 5 300 280 U.S. 3 260 2 240 1 0 222 2002 6 4 Figure 11.4b 2001 220 CRB 1999 2000 2001 2002 2003 2004 2005 200 U.S. real GDP growth and the Commodity Research Bureau commodity spot index. UNDERSTANDING ASSET ALLOCATION 55 9.6 50 9.2 45 8.8 40 8.4 China 35 Oil 8.0 30 7.6 25 7.2 20 6.8 15 6.4 2000 Figure 11.5a 2001 2002 2003 2004 China real GDP growth and oil prices. 50 8 45 6 40 4 Japan 35 2 30 0 Oil 25 -2 20 -4 15 -6 2000 Figure 11.5b 2001 2002 2003 2004 Japan real GDP growth and oil prices. 50 5 45 4 40 3 Oil 35 2 30 1 25 0 Germany 20 -1 15 -2 2000 Figure 11.5c 2001 2002 2003 2004 Germany real GDP growth and oil prices.

Thus, the different inflation and GDP growth combinations can be used to characterize some textbook representations of the world. In the simpler textbooks, the interaction of rising inflation and GDP growth is commonly associated with the Phillips curve, where increases in 98 UNDERSTANDING ASSET ALLOCATION spending—generated by aggregate demand shifts—lead to higher output and higher prices. Declining inflation and real GDP growth periods represent the mirror image, which is described in the simpler textbooks as the result of a decline in aggregate demand. The negative association between inflation and GDP growth is consistent with a classical model where inflation is too much money chasing too few goods, a relationship often explained in terms of aggregate supply shocks.

pages: 128 words: 35,958

Getting Back to Full Employment: A Better Bargain for Working People
by Dean Baker and Jared Bernstein
Published 14 Nov 2013

To see this point, it is important to remember that real GDP growth is equal to nominal GDP growth minus the rate of inflation: Real GDP growth = nominal GDP growth – inflation So if nominal GDP grows by 5.0 percent and the inflation rate is 2.0 percent, then real GDP growth is 3.0 percent. But proponents of inflation targeting argue that the measured rate of inflation is subject to a large amount of error, so that 2.0 percent measured inflation may actually correspond to zero inflation. This means that measured GDP growth will be equal to nominal GDP growth minus the true rate of inflation and the error in the measured rate of inflation: Measured real GDP growth = nominal GDP growth – (true inflation + error in measure of inflation) This creates a serious problem for economists trying to measure the relationship between inflation and GDP growth.

This means that measured GDP growth will be equal to nominal GDP growth minus the true rate of inflation and the error in the measured rate of inflation: Measured real GDP growth = nominal GDP growth – (true inflation + error in measure of inflation) This creates a serious problem for economists trying to measure the relationship between inflation and GDP growth. Any upward bias in the measured rate of inflation will lead to both higher measured inflation and lower measured growth. This would mean that even if there is no relationship whatsoever between inflation and GDP growth, regression analysis would likely find a negative relationship (higher inflation, slower growth) for the simple reason that countries that have less error in their measure of inflation would also show stronger growth.

Numerous studies have examined the link between inflation and growth. Many have found that the link is weak or nonexistent (e.g. Bruno and Easterly 1998; Grier and Tullock 1989; and Levine and Zervos 1993), but a number have found a significant negative relationship between even modest rates of inflation and GDP growth.[22] For example, Grimes (1991) looked at 21 countries in the Organization for Economic Cooperation and Development over the period from 1961 to 1988 and found that a 1.0 percentage-point increase in inflation was associated with a 0.11 percentage-point drop in the growth rate. Fischer (1993) had comparable results examining a group of non-oil-exporting countries over the same period.

pages: 1,088 words: 228,743

Expected Returns: An Investor's Guide to Harvesting Market Rewards
by Antti Ilmanen
Published 4 Apr 2011

Historical dividend growth is understated by the declining trend in dividend payout rate since the late 1970s, which is partly related to firms’ substituting share repurchases for dividend payments. Relation to GDP growth? Historical evidence on the gap between earnings (or dividends) and GDP growth is discouraging. Several recent studies show that earnings-per-share growth and dividends growth have, over long histories, lagged the pace of GDP growth and sometimes even GDP-per-capita growth (see Figure 8.12). Table 8.4 shows that, between 1950 and 2009, earnings-per-share and dividends-per-share growth rates almost matched the 1.9% real growth rate of GDP per capita but clearly lagged real GDP growth (3.1%):• Taking longer histories or studying global evidence does not help.

This ratio appears to be mean-reverting over time, but it can contain quite long trends, which makes trend GDP growth a relatively weak anchor for profit growth. Most observers may have genuinely thought that the trend GDP growth rate would be a floor to any estimates of trend earnings growth, but it actually has proved to be a ceiling. Arnott–Bernstein (2002) shocked many readers by documenting empirically that, over more than a century, the trend earnings-per-share (EPS) growth rate (below 2% per annum) has been well below the GDP growth rate (above 3%) and even lagged the GDP-per-capita growth rate of 2% (see Figure 8.12 and Table 8.4).

Depending on how growth rates and returns are defined, the relation was mildly negative or mildly positive. More tactically, stock markets in countries with especially high or low GDP growth rates over the preceding 5 years subsequently earned similar Sharpe ratios as markets in countries with middling past growth. Figure 16.1 shows similar evidence regionally over a 22-year window. Real GDP growth in Asia ex-Japan was roughly three times faster than in other regions, but equity market returns there were unexceptional. In contrast, Latin America’s GDP growth was ordinary but equity performance staggering (partly thanks to very cheap valuation levels in the 1980s and a shift over time to more capital-friendly economic policies).

pages: 372 words: 107,587

The End of Growth: Adapting to Our New Economic Reality
by Richard Heinberg
Published 1 Jun 2011

In contrast, from the mid-1970s to 2008, the relationship between energy consumption and real GDP growth changed, with primary energy consumption growing at less than one-third the previous average rate and real GDP growth continuing to grow at its historical rate. The decoupling of real GDP growth from energy consumption growth led to a decline in energy intensity that averaged 2.8 percent per year from 1973 to 2008.16 Translation: We’re saved! We just need to double down on whatever we’ve been doing since 1973 that led to this decline in the amount of energy it took to produce GDP growth.17 However, several analysts have pointed out that the decoupling trend of the past 40 years conceals some explanatory factors that undercut any realistic expectation that energy use and economic growth can diverge much further.18 One such factor is the efficiency gained through fuel switching.

BP’s losses from the Deepwater Horizon gusher (which included cleanup costs and compensation to commercial fishers) have so far amounted to about $40 billion.95 The Pakistan floods caused damage estimated at $43 billion, while the financial toll of the Russian wildfires has been pegged at $15 billion.96 Add in other events listed above, plus more not mentioned, and the total easily tops $150 billion for GDP losses in 2010 resulting from natural disasters and industrial accidents.97 This does not include costs from ongoing environmental degradation (erosion of topsoil, loss of forests and fish species). How does this figure compare with annual GDP growth? Assuming world annual GDP of $58 trillion and an annual growth rate of three percent, annual GDP growth would amount to $1.74 trillion. Therefore natural disasters and industrial accidents, conservatively estimated, are already costing the equivalent of 8.6 percent of annual GDP growth. BOX 3.10 The Japan Earthquake As this book was in its final stages of preparation for printing, a massive earthquake and tsunami struck northern Japan.

Even if GDP has returned to former levels, the economy of the United States is fundamentally changed: unemployment levels are much higher and tax revenues for state and local governments are severely reduced. Some economists may define this technically as a recovering and growing economy, but it certainly is not a healthy one. Moreover, much of this apparent growth has come about because of enormous injections of stimulus and bailout money from the Federal government. Subtract those, and the GDP growth of the past year or so almost disappears. On the basis of historical analysis of previous financial crises, economists Carmen Reinhart and Kenneth Rogoff conclude that the economic crisis of 2008 will have “. . .deep and lasting effects on asset prices, output and employment. Unemployment rises and housing price declines extend out for five and six years, respectively.

pages: 332 words: 106,197

The Divide: A Brief Guide to Global Inequality and Its Solutions
by Jason Hickel
Published 3 May 2017

Of course, there’s nothing inherently wrong with measuring some things and not others. GDP itself doesn’t have any impact in the real world. GDP growth, however, does. As soon as we start focusing on GDP growth, we’re not only promoting the things that GDP measures, we’re promoting the indefinite increase of those things. And that’s exactly what we started to do in the 1960s. GDP came into widespread use during the Cold War for the sake of adjudicating the grand pissing match between the West and the USSR. Suddenly, politicians on both sides became feverish about promoting GDP growth. Kuznets was careful to warn that we should never use GDP as a normal measure of economic success, for it would incentivise too much destruction.

Why is this? Because past a certain point, GDP growth begins to produce more negative outcomes than positive ones – more ‘illth’ than wealth.11 The reason is because there are no longer any frontiers where accumulation doesn’t directly harm someone else, by, say, enclosing the land, degrading the soils, polluting the water, exploiting human beings or changing the climate. We have reached the point where GDP growth is beginning to create more poverty than it eliminates. When the entire global political establishment puts its force behind the goal of GDP growth, human and natural systems come under enormous pressure.

He shows that given our existing economic model, poverty eradication can’t happen. Not that it probably won’t happen, but that it physically can’t. It is a structural impossibility. Right now, the main strategy for eliminating poverty is to increase global GDP growth. The idea is that the yields of growth will gradually trickle down to improve the lives of the world’s poorest people. But all the data we have shows quite clearly that GDP growth doesn’t really benefit the poor. While global GDP per capita has grown by 65 per cent since 1990, the number of people living on less than $5 a day has increased by more than 370 million. Why does growth not help reduce poverty?

pages: 397 words: 112,034

What's Next?: Unconventional Wisdom on the Future of the World Economy
by David Hale and Lyric Hughes Hale
Published 23 May 2011

Nor is there much chance that the US government will expand its deficit spending, and conversely its borrowing, enough to accelerate global GDP growth anytime soon. Meanwhile, the probability of stronger domestic commercial activity is low given the combination of a weak labor market, constraints on credit creation, and corporations’ intentions to restrict the volume of new capital expenditures. Therefore, just as in the late 1990s, the prospects for Japanese GDP growth over the next several years depend heavily on monetary, fiscal, and exchange-rate policy. Monetary Policy The return of price deflation in 2009 and 2010 presented a compelling case for aggressive monetary easing, but the BOJ refused to act decisively enough to thwart this danger.

It also is suffering a long-term decline in oil output because of inadequate domestic investment and political barriers to foreign investment. The year 2010 in Mexico will have been iconic because it was the two hundredth anniversary of independence and the one hundredth anniversary of the revolution that brought down Porfirio Díaz. Mexico will have a cyclical recovery in 2011 as the United States returns to a real GDP growth rate in the range of 3 percent, but Heyman believes that Mexico’s long-term performance will depend on how it manages four critical issues. First, it has to find a way to exploit its deep offshore oil potential. The United States drills one hundred wells per annum in the deep waters of the Gulf of Mexico while Mexico drilled only four wells in four years.

The Canadian Economy The second half of 2009 saw Canada emerge from recession. After three consecutive quarters of sharp declines in real GDP (averaging −4.3 percent seasonally adjusted annual rate), the economy grew at annualized rates of 0.9 percent and 4.9 percent (respectively) in the final two quarters of 2009. GDP growth accelerated to 5.6 percent in the first quarter of 2010, but then slowed sharply to only 2.3 percent in the second quarter and an even slower 1 percent in the third quarter. The rebound in economic growth largely reflects the relatively strong performance on the domestic front, with the external sector acting as the key constraint.

pages: 175 words: 45,815

Automation and the Future of Work
by Aaron Benanav
Published 3 Nov 2020

These trends are as visible in the world economy—including China—as they are in the high-income countries (Figure 3.2). In the 1950s and ’60s, global MVA growth and GDP growth were expanding at rapid clips of 7.1 and 5.0 percent respectively, with MVA growth leading GDP growth by a significant margin. From the 1970s onward, as global MVA growth slowed, so did global GDP growth. In most of the decades that followed, global MVA growth continued to lead GDP growth, but by a much smaller margin. Between 2008 and 2014, both rates grew at the exceptionally slow pace of 1.6 percent per year. Again, the implication is that as manufacturing growth rates declined, nothing emerged to replace industry as a growth engine.

For robot density statistics, see International Federation of Robotics, “Robot Density Rises Globally.” 47 Hallward-Driemeier and Nayyar, Trouble in the Making?, pp. 97–8. Chapter 3. In the Shadow of Stagnation 1 Unless otherwise noted, MVA and GDP growth rates will be cited in real inflation-adjusted terms, rather than in nominal terms. Measures of GDP growth and labor productivity, the latter in terms of real value added per employee, derive from Conference Board, Total Economy Database, last updated November 2018. 2 In Germany, MVA and GDP growth rates have fallen since 1973, but MVA is still growing at a faster pace than GDP. Meanwhile, in Italy, the economy has completely stagnated. 3 See William Baumol, “Macroeconomics of Unbalanced Growth: The Anatomy of Urban Crisis,” in American Economic Review, vol. 57, no. 3, June 1967, pp. 415–26; Robert Rowthorn and Ramana Ramaswamy, “Deindustrialization: Causes and Implications,” IMF Working Paper 97/42, 1997, pp. 9–11; Dani Rodrik, “Premature Deindustrialization,” Journal of Economic Growth, vol. 21, no. 1, 2016, p. 16. 4 Data on capital stock derives from the Penn World Table 9.1, last updated September 2019, retrieved from FRED, Federal Reserve Bank of St.

Unemployment Rates in the US, Germany, and Japan Figure 4.2. OECD Index of Employment Protection Figure 4.3. Service Sectors in the US, France and Italy Figure 4.4. Service Sectors in Thailand, Mexico and South Africa Figure 5.1. Gross Government Debt-to-GDP Tables Table 2.1. Manufacturing Growth Rates, 1950–2017 Table 3.1. Manufacturing and GDP Growth Rates, 1950–2017 Table 3.2. Capital Stock and Labor Productivity Growth Rates, 1950–2017 Preface THE INTERNET, SMARTPHONES, AND social media have already transformed so much about the way we interact with each other and come to know the world. What would happen if these digital technologies moved off the screen and increasingly integrated themselves into the physical world around us?

pages: 261 words: 57,595

China's Future
by David Shambaugh
Published 11 Mar 2016

Without this fundamental switch in the way the Chinese party-state functions, China’s economic reforms will stall and the macro economy will stagnate (relatively). This does not mean that the Chinese economy will crash, although the volatility and overall economic contraction experienced in 2015 caused some analysts to predict a hard landing. GDP growth officially fell to 7 percent during the first half of 2015, while total trade declined 6.9 percent. Some analysts believe GDP growth is actually 1 to 2 percentage points lower. In the years ahead it is not inconceivable that it may fall to 5 percent or less per annum. As noted above, this is not necessarily a bad thing, as it would indicate structural shifts in the economy away from fixed asset investment toward a more variegated growth model.

In this respect, I had an interesting conversation at the end of 2014 with an official from the Development Research Center, the State Council’s main internal think tank, who said that they had done studies projecting a progressive decline to around 3 percent by 2020–2025, and then hoped to sustain that rate for a number of years.15 When I asked him if this was not alarming, he nonchalantly replied that it was entirely “natural,” to be expected for newly industrializing economies, and even desirable for China! Indeed, many governments would welcome sustained 3 percent growth and we should recall, again, that an economy with the aggregate size of China’s growing at 3 percent per annum remains in a league by itself. Figure 2.2 China’s GDP Growth Rates If China’s GDP growth does follow this pattern, it would be entirely commensurate with the experience of other East Asian NIEs. Economist David Dollar of The Brookings Institution has done a study of China’s economy at present compared with the historical development experiences of Japan, South Korea, and Taiwan.

But they aren’t, and the result is a bubble that wants to burst.”35 Personal Consumption and Spending Increasing consumer spending is a centerpiece of the government’s plan to shift the overall macroeconomic growth model from the “old two” drivers to the “new two” elements. While the data on increased total consumption spending has been very positive over the past several years (averaging between 50 and 55 percent of GDP growth from 2011 to 2014), lowered GDP growth will definitely have an impact on disposable income (which only grew at single digits in 2014 after double-digit growth the previous decade). Some analysts foresee consumption expenditures slowing considerably as consumer confidence dips—especially for young professionals—while others point to the huge pent-up savings that could be unleashed.36 Government procurement, which is also counted as part of total consumption spending, may also contract.

pages: 272 words: 71,487

Getting Better: Why Global Development Is Succeeding--And How We Can Improve the World Even More
by Charles Kenny
Published 31 Jan 2011

More recently, between 1960 and 2000, among the 102 countries for which the World Bank has data, only the Democratic Republic of the Congo saw negative GDP growth rates. In fact, it was the only country to manage average annual GDP growth of below 0.5 percent. Only eleven countries saw annual output growth of below 2 percent between 1960 and 2000. This sluggish output performance in modern terms is more than four times the average rate for Western Europe as a whole in the Malthusian period. The laggard output growth performers in the postwar period were Eastern Europe, Western Europe, and the Western offshoots of North America and Australasia. Africa’s GDP growth rate between 1950 and 2000, at 3.5 percent, was higher than that of all three.

Two hundred years of economic collapse and population decline in those regions brought on by the guns and germs of the Old World were reversed as economies and migrant populations expanded to take advantage of the “sudden increase in the means of subsistence,” as Malthus put it. Only with the advent of the nineteenth century do we see the spread of sustained GDP growth above 1 percent as the Industrial Revolution took hold. The nineteenth century brought considerable diversity in GDP performance, with some regions including Asia and Africa seeing very sluggish growth while others (including Europe) took off with growth rates climbing above 3 percent. Conversely, the twentieth century has seen rapid GDP growth everywhere. And following World War II, developing countries saw particularly impressive GDP performance, with Asia leading the way.

Invest more in factories, roads, or housing, and your growth rate will go up. The more you invest, the more you grow. It involved a model—a set of mathematical equations—where you plugged in investment rates at one end and a growth forecast popped out the other. Many economists used the model to forecast GDP growth rates in the developing world. The World Bank’s Revised Minimum Standard Model of growth (known as Rimsim to its friends), developed in 1972, was based on Harrod and Domar’s work. The researchers based the model on the idea that each country had a “capital output ratio” that told you how much investment was required for each percentage point of growth.

Growth: From Microorganisms to Megacities
by Vaclav Smil
Published 23 Sep 2019

Put another way, economists have an implicit expectation of endless, and preferably fairly fast, exponential growth. But they choose an inappropriate metric when comparing the outcomes. For example, during the first half of the 1950s the US GDP growth averaged nearly 5% a year and that performance translated roughly to additional $3,500 per capita (for about 160 million people) during those five years. In contrast, the “slow” GDP growth between 2011 and 2015 (averaging just 2%/year) added about $4,800/capita (for about 317 million people) during those five years, or nearly 40% more than 60 years ago (all totals are in constant-value monies to eliminate the effect of inflation).

Only gains on the order of 3–4% are seen as “healthy,” while analysts and commentators are mesmerized by the utterly unsustainable rates approaching, even surpassing, double digits that were characteristic of the growth of the Japanese economy between 1955 and 1969, of the South Korean economy between the late 1960s and the late 1980s, and of the Chinese economy since the beginning of Deng Xiaoping’s reforms in 1980 (World Bank 2018). Japanese annual GDP growth was above 10% for most of the late 1950s and 1960s, with 1969 (at 12%) being the last year of double-digit gain (SB 1996). During the 20 years between 1968 and 1988 the South Korean economy experienced 12 years of double-digit growth, with a peak of almost 15% in 1973, and between 1980 and 2015 official Chinese statistics claimed 13 years of annual GDP growth in excess of 10%, with peaks of 14–15% in 1984, 1992, and 2007 (World Bank 2018). But when comparing these trajectories (figure 5.1) we must keep in mind that the actual Chinese rates have been substantially smaller.

But when comparing these trajectories (figure 5.1) we must keep in mind that the actual Chinese rates have been substantially smaller. One giveaway was the fact that annual GDP growth rates were reported to surpass 7% even as electricity generation (considered a good proxy of economic growth) was flat or barely increasing, but finding a widely acceptable correction factor has been elusive (Koch-Weser 2013; Owyang and Shell 2017). Figure 5.1 Annual rates of GDP growth in Japan, South Korea, and China, 1960–2010. Plotted from World Bank data (World Bank 2018). Tracing the growth of economies can be done by focusing on some key proxy measures of key inputs (total energy or electricity demand, food supply), products (steel, cars) or product groups (total manufacturing output) but by far the most revealing commonly used indicator, gross domestic product, is also one that is questionable, both because of how it is accounted for and what it omits.

pages: 389 words: 87,758

No Ordinary Disruption: The Four Global Forces Breaking All the Trends
by Richard Dobbs and James Manyika
Published 12 May 2015

Prior to the 2008 recession, multinationals made up less than 1 percent of all US companies, but they generated 25 percent of gross profits, 41 percent of productivity gains, and nearly 75 percent of the nation’s private-sector R&D spending.43 Connectedness matters for countries, too. Global flows add between $250 billion and $450 billion—or 15 to 25 percent—to global GDP growth each year and contribute to faster growth for countries that participate. In fact, the most connected countries can expect to increase GDP growth from flows by up to 40 percent more than the least connected countries.44 Germany ranked as the most connected country in the world in 2012.45 Developed economies by and large dominated the rankings, though some large emerging economies have made significant gains in the past two decades.

“Well, there was a reason why: growth has moved elsewhere—to Asia, Latin America, the Middle East.”9 Perhaps equally important, the locus of economic activity is shifting within these markets. The global urban population has been rising by an average of sixty-five million people over the last three decades, equivalent to adding seven Chicagos a year, every year.10 Nearly half of global GDP growth between 2010 and 2025 will come from 440 cities in emerging markets—95 percent of them small- and medium-sized cities that many Western executives may not even have heard of and couldn’t point to on a map.11 Mumbai, Dubai, and Shanghai, yes. But also Hsinchu, in northern Taiwan, which is already the fourth-largest advanced electronics and high-tech hub in the China region.

Today, that combination will gain them exposure to markets with 70 percent of the world’s GDP. But by 2025, this combination will generate only about one-third of global growth, which will not be sufficient for large companies trying to position themselves for growth.26 In contrast, between 2010 and 2025, 440 cities in developing nations will generate nearly half of global GDP growth.27 But only about 20 or so of these emerging-market dynamos are likely to be familiar names, such as Shanghai, Mumbai, Jakarta, São Paulo, or Lagos. The other 420 are names that don’t roll off the tips of our tongues. How many people have spotted Surat, Foshan, or Porto Alegre on their strategic radars?

pages: 249 words: 66,383

House of Debt: How They (And You) Caused the Great Recession, and How We Can Prevent It From Happening Again
by Atif Mian and Amir Sufi
Published 11 May 2014

In the third quarter of 2008, the collapse in GDP was driven by the collapse in consumption. Non-residential investment contributed negatively to GDP growth, but its effect was less than half the effect of consumption. Further, in the fourth quarter of 2008, consumption again registered the largest negative contribution to GDP growth. It wasn’t until the first and second quarters of 2009 that business investment contributed most negatively to GDP growth. The timing implicates household spending as the key driver of the recession, not the effects of the banking crisis on businesses. Job losses materialized because households stopped buying, not because businesses stopped investing.

However, looking more closely at the banking-crisis period suggests that, even then, consumption was the key driver of the recession. NIPA breaks down the total output of the U.S. economy, or GDP, into its subcategories of consumption—investment, government spending, and net exports—and gives data on how much each contributes to overall GDP growth. We are particularly interested in the contributions of consumption and investment to GDP growth during the Great Recession. We split investment into residential investment and non-residential investment. The former reflects investment in housing services (both new construction and remodeling), while the latter reflects business investment in plants, capital goods, computers, and equipment.

But the evidence from the NIPA accounts contradicts this argument. Residential investment was a serious drag on GDP growth even before the banking crisis. And the contribution of consumption was also negative in both the first and second quarters of 2008, which is consistent with the evidence above demonstrating that weakness in household spending preceded the banking crisis. In figure 3.1, we present this evidence for the Great Recession, which formally began in the fourth quarter of 2007. The figure splits out the contributions to total GDP growth from consumption, residential investment, and non-residential investment. As it illustrates, residential investment and consumption were the main drivers of weakness for the first three quarters of the recession.

pages: 1,324 words: 159,290

Grand Transitions: How the Modern World Was Made
by Vaclav Smil
Published 2 Mar 2021

And between 1870 and 1913 the United Kingdom (averaging 1.9%) was left behind by at least a score of other countries, including not only most of the Western European economies (averaging more than 2%) and the United States (at nearly 4%) but also Japan (2.44%), the country whose economic transition began only during the 1870s after the restoration of imperial rule in 1868, following more than 250 years of the feudal Tokugawa shogunate (Jansen 2000). Per capita GDP growth rates show the same trend when we compare all major Western economies and Japan with the United Kingdom. Except for the United States, between 1820 and 1870 their growth was lower than the British mean, but between 1870 and 1913, while the United Kingdom’s average was 1.10%, France was advancing at 1.45%, Japan at 1.48%, and Germany at 1.61%, and the United States at 1.82%; major Latin American economies had also made substantial gains (Maddison 2007). But China remained a premodern state with average per capita GDP growth of just 0.1% between 1870 and 1913, the period that included the last 40 years of the last imperial dynasty that ended in 1911 and led to nearly four decades of instability and conflicts.

Post-1990 China has advanced rapidly along that defined trajectory but no other populous country is likely to replicate that experience in coming decades. Between 2006 and 2016 China’s GDP growth rate averaged 9%, India’s 6%, and Nigeria, Africa’s most populous country, lagged far behind with just 3% (World Bank 2019). Obviously, even with improved performance populous Asian and African economies will take decades to approach the current rates prevailing in the affluent nations. Prospects for economic growth Historical trajectories of national economies between 1870 and 2015 indicate that all major affluent economies have entered the era of declining GDP growth. They form symmetrical logistic curves that reflect many idiosyncrasies of national economic development but that have already passed their inflection points as their trajectories appear to be tending toward not-so-distant asymptotes (Smil 2019a).

And calls for steady-state economies—whose aggregate growth would be high enough only to cover any population increments and, in the case, of stable or declining populations the annual economic growth would be then zero or it would be slowly declining—remain largely limited to the proponents of ecological economics. Even in the world’s most affluent societies there are constant concerns about maintaining the highest possible growth rates. Even in large mature economies, where one should not expect high rates of GDP growth, annual gains of 2–3% are seen as much preferable to anything less than 1%. This quest has, so far, translated into no obvious limits where abundance is concerned. The average size of an American house is now 2.5 times larger than it was in 1950, and it is still slowly increasing. Moreover, the success of Amazon Prime shows that there is no imminent limit as to the number of items people wish to acquire (and do so instantly).

pages: 355 words: 63

The Elusive Quest for Growth: Economists' Adventures and Misadventures in the Tropics
by William R. Easterly
Published 1 Aug 2002

It was only as more data became available that the model’s failings became ghastly apparent. Domar’s approach to growth became popular because it had a wonderfully simple prediction: GDP growth will be proportional to the share of investment spending in GDP. Domar assumed that output (GDP) is proportional to machines, so the change in output will be proportional to the change in machines, that is, last year’s investment. Divide both sides by last year’s output. So GDP growth this year is just proportional to last year’s investment/GDP ratio.16 How did Domar get the idea that production was proportional to machines? Did not labor play some role in production?

The majority of the world’s people live in poor nations where women are oppressed, far too many babies die, and far too many people don’t have enough to eat. We care about economic growth for the poor nations because it makes the lives of poor people like those in Gulvera better. Economic growth frees the poor from hunger and disease. Economy-wide GDP growth per capita translates into rising incomes for the poorest of the poor, lifting them out of poverty. The Deaths of the Innocents The typical rate of infant mortality in the richest fifth of countries is 4 out of every 1,000 births; in the poorest fifth of countries, it is 200 out of every 1,000 births.

For example, suppose that you got one percentage point of growth for every four percentage points of investment. A country that wanted to triple growth from 1 percent to 4 percent had to raise its investment rate from 4 percent Aid for Investment 31 of GDP to 16 percent of GDP. The 4 percent GDP growth would give a per capita growth rate of 2 percent if population growth was 2 percent. At a 2 percent per year rate of growth, income per capita would double every thirty-six years. Investment had to keep ahead of population growth. Development was a race between machines and motherhood. How do you get investment highenough?

EuroTragedy: A Drama in Nine Acts
by Ashoka Mody
Published 7 May 2018

The commitment was essential to restore and maintain “trust and confidence.”116 Issing’s claim was that high interest rates kept prices “stable,” and stability generated confidence in the future, which encouraged long-​term investment and spurred growth. This plausibly stated sentiment was a dodge. The eurozone was not at risk of instability caused by runaway inflation. The need of the moment was to jump-​start the economy. And with the ECB unwilling to provide more stimulus, GDP growth kept slipping. From 3.8 percent in 2000, GDP growth fell not to the 3 percent that Duisenberg had promised but to 2.2 percent in 2001 and to less than 1 percent in 2002. Not only had the ECB failed in its first test to provide needed stimulus, it had also lost credibility. Ultimately, the ECB, having run out of excuses for inaction, did lower interest rates.

Labor market slack [unemployment] remains at historically unprecedented levels, and under-​ investment is eroding the country’s capital stock.”65 Investment was low because Portuguese companies, having gorged themselves on debt before the crisis began, still labored under a heavy debt burden. The IMF did manage to strike a note of hope, predicting that the annual GDP growth rate would tick up from around 1 to 1.5 percent, and the government’s debt ratio would decline steadily from its 130 percent of GDP level. Even that flicker of optimism faded. By September 2016, the IMF said that the brief economic recovery was “running out of steam,” the banking system was “plagued by low profitability and rising NPLs [nonperforming loans],” and the government’s finances were under great pressure.66 GDP growth had not risen; the debt burden had remained virtually unchanged. When Portuguese GDP did perk up in the first quarter of 2017, Schäuble once again saw the glimmer of a Portuguese economic renaissance.

Compared with the blistering 9 percent growth rate in the pre-​global-​crisis years between 2004 and 2007, the rate of world trade growth now stays, generally, in the range of 3 to 5 percent a 5 Per capita GDP growth rate of the median euroarea country, percent 1946–1970 1920–1929 Before 1991 4 3 1971–1990 1890–1899 1999–2008 2 1991–1998 1930–1939 1 2009–2016 After 1991 0 –2 0 2 4 6 8 10 Annual average world trade growth, percent Figure 10.1. Euro-area growth marches to the drum of world trade growth. Note: Eurozone countries in this chart include Austria, Belgium, Finland, France, Germany, Ireland, Italy, Netherlands, Portugal, Spain. The periods 1914–​1919 and 1940–​1945 are missing due to a lack of wartime trade data. Sources: Real per capita GDP growth rates: Angus Maddison, “Historical Statistics of the World Economy 1-​2008AD,” http://​www.ggdc.net/​maddison/​oriindex.htm; Penn World Tables 8.0, http://​www.rug. nl/​ggdc/​; International Monetary Fund, “World Economic Outlook” Database, http://​www.imf.org/​ external/​pubs/​ft/​weo/​2014/​02/​weodata/​index.aspx.

pages: 566 words: 160,453

Not Working: Where Have All the Good Jobs Gone?
by David G. Blanchflower
Published 12 Apr 2021

A couple of weeks earlier the first estimate of quarterly GDP growth was reported by the ONS for 2008 Q2 of +0.2 percent. I had expected the number to be negative and that number threw me for a loop. By that point I had started to doubt that I was right. I went home after the meeting in early August with the intention of resigning as I was clearly so wrong. Figure 6.1A is the MPC’s forecast for quarterly GDP growth. The first vertical line in 2008 is where we were at the time of the forecast. The shaded bands depict the probability of various outcomes for GDP growth. To the left of the first vertical dashed line, the distribution reflects the likelihood of revisions to the data over the past; to the right, it reflects uncertainty over the evolution of GDP growth in the future.

To the left of the first vertical dashed line, the distribution reflects the likelihood of revisions to the data over the past; to the right, it reflects uncertainty over the evolution of GDP growth in the future. If economic circumstances identical to those during the time the forecast is made were to prevail on 100 occasions, the MPC’s best collective judgment is that the mature estimate of GDP would lie within the darkest central band on only 10 of those occasions. The chart is constructed so that outturns are also expected to lie within each pair of the lighter areas on 10 occasions. Consequently, GDP growth is expected to lie somewhere within the entire fan on 90 out of 100 occasions. Figure 6.1.

The same ones that failed to spot the Great Recession in the first place, and likely the same modelers too. By the meeting itself, held in May, probabilities of a rate rise fell to 8 percent and the MPC did nothing. In the meantime, data turned bad with GDP growth of 0.1 percent for 2018 Q1 and weak PMIs as well as declining inflation, investment, and retail sales. GDP in the UK grew 1.1 percent in the first three quarters of 2018, but quarterly GDP growth in Q4 was only 0.2 percent. Brexit uncertainty appears to have slowed activity, and by 2019 talk of rate raises has gone. There remains some disagreement among central bankers on what is happening, but when it comes to votes on rate rise they are almost always unanimous.

pages: 339 words: 95,270

Trade Wars Are Class Wars: How Rising Inequality Distorts the Global Economy and Threatens International Peace
by Matthew C. Klein
Published 18 May 2020

To understand why, it is necessary to comprehend the importance of China’s GDP growth targets, and for that, it is necessary to understand the difference between GDP growth as a system output and GDP growth as a system input. In most economies, GDP is a measure of output generated by households, businesses, and the government, all of which face constraints on how much they can spend. Official statisticians measure the relevant changes in activity, which are reported as the amounts by which GDP expanded or contracted during the period. But this is not what happens in China. In China, the GDP growth rate is an input into the system. It is set early in the year as the GDP growth target for that year and represents the amount of growth needed to accommodate social and political objectives, among which of course is the desire to keep unemployment low.

This means land reform, hukou reform, tax reform, privatization, the legalization of unions, and other measures so that household income can continue growing quickly even if GDP growth slows substantially.26 The only safe prediction is that over the next decade or two, China’s imbalances will have been reversed, which means household income growth will substantially exceed GDP growth. But there are many ways this can happen. Progressive wealth transfers would make it possible to maintain the rapid growth of Chinese living standards even as investment growth slows to zero, or even turns negative. Chinese household income and consumption might grow at a vibrant 5–6 percent annually while average GDP growth would slow to 3–4 percent. If, however, opposition to transfers forces the government to use credit growth as a substitute for reform, the risk is that China hits its debt capacity constraint.

In China, the GDP growth rate is an input into the system. It is set early in the year as the GDP growth target for that year and represents the amount of growth needed to accommodate social and political objectives, among which of course is the desire to keep unemployment low. As such it modifies the standard economic constraints, allowing local governments to generate enough economic activity that, together with the economic activity of the private and real estate sectors, add up the GDP growth target. This creates powerful—and dangerous—incentives. China’s provincial and municipal governments control most of the credit creation within the banking system, and Chinese banks rarely have to write down loans for projects that cannot service the debt.

pages: 262 words: 83,548

The End of Growth
by Jeff Rubin
Published 2 Sep 2013

The modern world counts on economic growth to support population expansion, as well as satisfy the desire for higher incomes and all the extra things that money can buy. Since the last recession, the need for GDP growth has become even more urgent. Economic growth will provide the financial wherewithal that allows governments to service the debts accumulated during that downturn. Right now, though, the global economy is discovering that chasing growth is a catch-22. Our countries need GDP growth to repay the debt acquired during the last oil price–induced recession, but achieving that growth will bring back the same high prices that killed growth in the first place.

Countries that rank the highest on the United Nations’ Index of Human Development don’t have the largest or fastest-growing economies. Could there be a lesson there? Maybe we can live with less GDP growth and not feel the poorer for it. The Germans have been learning to job-share, and it seems to be working fine for them. But that’s in the developed world. In the developing world, millions of people struggle to put food on the table and keep a roof over their heads. These countries aren’t working with much of a buffer. If GDP growth stagnates, what happens to the burgeoning populations inside the borders of poor nations? What will China’s and India’s increasing consumption of the world’s natural resources mean for them?

The second is labor force growth. Add the two together and you get an economy’s potential growth rate. It works like this. If productivity is growing at 2 percent a year and the labor force is growing at 1 percent a year, then the sum of the two numbers gives a sense of your country’s potential rate of GDP growth. In this case, 1 percent plus 2 percent equals 3 percent. That means your economy can happily grow by 3 percent a year. Any higher and inflation will kick in; any lower and it’s a good bet that more people will soon find themselves unemployed. The Federal Reserve Board pegs the US economy’s potential growth rate at around 3 percent.

pages: 333 words: 76,990

The Long Good Buy: Analysing Cycles in Markets
by Peter Oppenheimer
Published 3 May 2020

The rest of the world, including Europe, easily outgrew Japan in the 1990s and 2000s, although the gap is narrowing. Lower top-line growth is a function of lower inflation and weaker real economic growth over the past decade. Also, consensus expectations for medium-term GDP growth have fallen gradually, from 2.5% in the mid-1990s to closer to 1% for the euro area today. A look at long-term (6–10 years) forward consensus forecasts from economists shows that, since the financial crisis, long-term real GDP growth forecasts have trended downwards, despite the powerful easing of monetary policy and the introduction of QE, and in the case of the US, a large increase in fiscal spending (exhibit 10.10).

P/E ratios in both of these equity markets are at the same level, and both are below that of the US equity market, which has higher bond yields. The explanation for this is that the negative bond yields in both Japan and Germany are associated with lower long-term growth expectations (exhibit 10.12). Exhibit 10.10 Long-term real global GDP growth forecast is at a historical low (long-term [6y–10y] GDP growth from consensus economics) SOURCE: Goldman Sachs Global Investment Research. Exhibit 10.11 German yields have converged to Japanese levels (and below) (% 10-year government bond yield) SOURCE: Goldman Sachs Global Investment Research. Exhibit 10.12 Europe and Japan have similar P/Es (12m forward P/E) SOURCE: Goldman Sachs Global Investment Research.

Exhibit 4.6 Equity/bond correlation can turn positive with higher yields (12... Exhibit 4.7 Equities have remained attractively valued over recent years des... Chapter 5 Exhibit 5.1 Industries and sectors can be divided in four groups according t... Exhibit 5.2 Beta of forward EPS growth to World GDP growth Exhibit 5.4 Global Cyclicals versus defensive across industrial cycles Exhibit 5.5 Lower bond yields tend to result in cyclical companies underperf... Exhibit 5.6 US Cyclical versus defensives monthly performance (since 1973)... Exhibit 5.8 There has been a significant change in the relationship between ...

pages: 305 words: 75,697

Cogs and Monsters: What Economics Is, and What It Should Be
by Diane Coyle
Published 11 Oct 2021

We do not have statistics on the value of intangible activities such as building apps or consuming online data; Michael Mandel has pointed out the absurdity that official statistics suggest American internet use was making a negative contribution to GDP growth during the period when fixed and mobile broadband subscriptions and usage were exploding (Mandel 2012). Similarly absurd is the large contribution financial services apparently made to UK GDP growth in the final quarter of 2008 (Coyle 2014). The fact that they are not counted does not mean that intangibles are not valuable, no more than the fact that it is counted makes speculative finance valuable.

I have nevertheless strongly supported economists’ advocacy of market competition as an essential process for the efficient allocation of resources. Competing against other producers encourages the efficient use of resources at any point in time and the innovation of new products and services over time. When we talk about economic growth, what we really mean is innovation, new ideas that improve people’s lives. GDP growth is not just more bread or more clothes; it is also new medicines, a wider range of book titles, undreamt-of artefacts like the internet and smartphones, the opportunity to travel to other countries, and visit the cinema or attend the Olympics (Coyle 2014). Human curiosity alone would have brought many discoveries, but commercial imperatives and the pressure of contesting for customers in markets are needed to translate discovery into services and products that are produced at scale, are affordable, and improve many people’s lives.

As well as the energetic student-driven reform movement, there was tremendous public interest in the economy—an evident passion to understand the world in uncertain times, and a sense that events had seriously tested economics. The interest has only grown. As the pandemic-related lockdowns have continued, the appetite for discussion about what kind of economic recovery is desirable, and whether GDP growth is a good target, is apparent. So wanting to see change in economics is not a fringe or ‘heterodox’ agenda. Nor is it just a question of changing the curriculum, or the academic research agenda, for the future; it is also about the kind of impact assessment work undertaken widely in public policy and consultancies.

pages: 306 words: 78,893

After the New Economy: The Binge . . . And the Hangover That Won't Go Away
by Doug Henwood
Published 9 May 2005

Almost everything he said deserves a clarification, if not an outright correction. Measured by GDP growth rates, the most conventional and fetishized number in all of economics, it's hard to see how the 1990s were "the best decade for the U.S. economy going back to the 1850s"; nineteenth- and early-twetieth-century growth rates were pretty ripping by modern standards. 0 1980 1985 1990 1995 2000 Articles containing the phrase "new economy" in the New York Times and Washington Post, 1980-2003. Figure for 2003 annualizes data through July 9 Novelty According to economic historian Angus Maddison's (1995) figures, U.S. GDP growth averaged 3.9% between 1850 and 1914, though wild booms and busts oscillated violently around that average; the 3.4% average of the 1990s is considerably lower, Uttle different from the growth rates clocked in the much-maUgned 1970s and well below that of the 1960s.

The first two panels show the average annual growth rates in employment and CDR The bottom panel shows the relation between the two—employment growth is divided by GDP, then divided further by 100 as an estimate of how much employment growth would be generated by 1 percentage point of CDP growth. So, for Canada in the 1960s, 1 % GDP growth would result in about 0.5% employment growth. Note how little change there's been overtime. Source: author's calculations from U.S. Bureau of Labor Statistics, World Bank, and IMF data. decline in what economists call the employment intensity of growth—the amount of job growth generated by a specified amount of GDP growth. But, as the facing table shows, that hasn't happened, either in the U.S. or elsewhere. Economies suflfering high rates of unemployment are generally also suffering from low growth rates.

Hedonic pricing has never been applied to cars, despite massive quaHty improvements. Gordon (2002) says that were it appUed to women's clothing, reported inflation would nearly double, since manufacturers hide price increases behind seasonal style changes. But overall, the BEA says that if hedonic pricing were applied more broadly,"real GDP growth might be revised up substantially" (ibid.). We're better off than we ever reaHzed. Work 45 240 220 200 180 160 140 120 100 productivity &. compensation, all nonfarm business, 1960-2003 productivity compensation rebasedto 1960=100 ■ ■'■ ■ ■ 111 ■■ 11 ■ 111 ■111111111 And what about the inputs to TFP/MFP?

pages: 248 words: 57,419

The New Depression: The Breakdown of the Paper Money Economy
by Richard Duncan
Published 2 Apr 2012

Exhibit 7.4 summarizes the projected changes in GDP, inflation, and credit as projected in this scenario. EXHIBIT 7.4 Scenario Three: The Most Likely One 2013 2014 GDP at the beginning of the year ($ billions) 15,700 16,014 Real GDP growth target (%) 2% 2% Inflation rate (%) 4% 4% Nominal GDP growth target (%) 6% 6% Nominal GDP growth target ($ billions) 942 961 Ratio of GDP growth to credit growth (%) 50% 50% Nominal credit growth required ($ billions) 1,884 1,922 Increase in government debt, i.e., the budget deficit ($ billions) 1,884 1,922 Money creation, the Fed monitized half the deficit ($ billions) 942 961 Fed’s balance sheet at the beginning of the year ($ billions) 3,900 4,842 Fed’s balance sheet year end ($ billions) 4,842 5,803 TCMD at the beginning of the year ($ billions) 54,240 56,124 TCMD at the end of the year ($ billions) 56,124 58,046 Increase in TCMD (%) 3.5% 3.4% Increase in TCMD adjusted for inflation % −0.5% −0.6% Real GDP year end ($ billions) 16,014 16,334 Budget deficit to GDP (%) 11.8% 11.8% Government debt at the beginning of the year ($ billions) 11,153 13,037 Government debt at the end of the year ($ billions) 13,037 14,959 Government debt at the end of the year (% of GDP) 81% 92% Impact on Asset Prices The combination of large budget deficits and significant fiat money creation would be very positive for the stock market—so long as inflation does not meaningfully exceed 4 percent.

It shows credit growth and economic growth, both adjusted for inflation, from 1952 to 2010. EXHIBIT 6.1 Credit Growth Drives Economic Growth Source: Federal Reserve, Flow of Funds Accounts of the United States; Bureau of Economic Analysis First notice that over those 59 years, credit growth exceeded GDP growth in all but 16 years. Next, note that there were only 12 years during which credit expanded by less than 2 percent, and in every instance except one, 1970, such weak credit growth was accompanied by a recession, either in the same year or in the following year. In 1970, GDP grew, but only by 0.2 percent.

That may have been the case in the past under normal conditions, but in recent decades the evidence suggests otherwise. Consider the 1980s. During the five years from the end of 1982 to the end of 1987, credit (adjusted for inflation) expanded by an average of 10.1 percent a year, much more than during any other five-year period since the end of World War II. The gap between credit growth and GDP growth was also particularly wide during those five years, 5.6 percentage points on average. There is absolutely no doubt about what caused the acceleration of credit at that time. It was Reaganomics. The Reagan administration cut taxes and increased military spending. As a result, the annual budget deficit averaged 4.8 percent of GDP over those years, producing a cumulative budget deficit of $976 billion.

pages: 411 words: 114,717

Breakout Nations: In Pursuit of the Next Economic Miracles
by Ruchir Sharma
Published 8 Apr 2012

In 2012, the gap climbed to 64 percentage points, with Brazil down 3 percent and Turkey, still a model for economic normalcy in the Muslim world, up 61 percent. Broken BRICS All of the BRICS economies are slowing sharply. China is on track to see its GDP growth fall well below the 8 percent target that Beijing had maintained for many years. The country’s slowdown is in turn taking the wind out of economies that set sail in the last decade by selling commodities to China, particularly Russia and Brazil, where GDP growth rates have slipped to 3.5 percent and 1 percent, respectively, in 2012. The risk of relying so heavily on exports of raw materials is showing its ugly head. The government in Brazil still prefers to fix the problem of custo Brasil (the high cost of doing business in Brazil) using the heavy hand of the state, and has cemented the country’s status as one of the most closed emerging economies by tossing up new tariff barriers.

Starting in the year 2003, an underappreciated turning point in the course of the world, this good fortune suddenly spread to virtually all emerging nations, a class that can be defined a number of different ways but here broadly means countries with a per capita income of less than $25,000.† Between 2003 and 2007, the average GDP growth rate in these countries almost doubled, from 3.6 percent in the prior two decades to 7.2 percent, and almost no developing nation was left behind. In the peak year of 2007, the economies of all but 3 of the world’s 183 countries grew, and they expanded at better than 5 percent in 114 countries, up from an average of about 50 countries in the prior two decades.

Under Alan Greenspan and his successor, Ben Bernanke, the Fed shifted focus from fighting inflation and smoothing the business cycle to engineering growth. Low U.S. interest rates and rising debt increasingly became the bedrock of American growth, and the increases in total U.S. debt started to dwarf the increases in total U.S. GDP: in the 1970s it took $1.00 of debt to generate $1.00 of U.S. GDP growth, in the 1980s and 1990s it took $3.00, and by the last decade it took $5.00. American borrowing was getting less and less productive, focused more on financial engineering and conspicuous consumption. U.S. debt became the increasingly shaky pillar of the global boom. Low interest rates were driving growth in the United States, pressuring central banks around the world to lower their rates as well, while fueling an explosion in U.S. consumer spending that drove up emerging-market exports.

pages: 370 words: 102,823

Rethinking Capitalism: Economics and Policy for Sustainable and Inclusive Growth
by Michael Jacobs and Mariana Mazzucato
Published 31 Jul 2016

Table 2 summarises the projected average GDP growth for the business-as-usual scenario and the investment-led scenario. Under the assumption that 85 per cent of resources from the Juncker plan will be allocated towards investment, projected average GDP growth for the EU as a whole in the business-as-usual scenario reaches only 1.5 per cent over the 2015–2020 period. This is much lower than the 2.3 per cent average growth recorded in the period 2000–2008. By contrast, in the investment-led scenario, average growth in the same period is projected to be 3 per cent. In the south euro zone, average GDP growth increases from 2.3 per cent in 2000–2008 to 3.3 per cent in 2015–2020 under the investment-led scenario, compared with 1.2 per cent in the business-as-usual scenario.

China Development Bank (CDB) circular economy citizenship goods climate change and capitalism and economics and politics Paris Accord policy Club of Rome Cold War collective goods Compaq compensation contracts competition Japanese law limits perfect competition protected firms and sectors consumerism consumers behaviour benefits choice debt demand protection welfare corporate sector accountability debt financialisation Fortune 500 companies Fortune 1000 companies governance new public management (NPM) organisational models resource allocation D DARPA debt consumer corporate household hysteria private public short-term sovereign debt-to-GDP ratios decarbonisation and structural change democracy and capitalism election campaigns post-democratic politics Department of Defense Department of Energy Department of health developing countries devolution discrimination anti-discrimination laws displacement of peoples Dosi, Giovanni Draghi, Mario E economic and monetary union (EMU) economic growth and inequality and innovation and technology environmental concerns green growth zero growth economic policy and capitalism consensus-building macroeconomic policy monetary expansion reshaping economic theory economic models model of the firm neoclassical orthodox post-Keynesian education access to and skills efficiency employment growth ‘non-standard’ work energy sector storage technologies environmental impacts environmental risk damage degradation sustainability technologies euro zone debt-to-GDP ratio economic policy fiscal policy GDP growth government lending investment macroeconomic conditions private investment productivity growth recession southern countries sovereign debt unemployment European Central Bank (ECB) role European Exchange Rate Mechanism (ERM) European Investment Bank (EIB) proposed new European Fund for Investment European Regional Development Fund (ERDF) European Stability Mechanism European Union (EU) competition law debt-to-GDP ratio de-industrialisation GDP growth government lending Growth Compact investment-led recovery macroeconomic conditions monetary expansion policy framework private investment productivity growth Stability and Growth Pact unemployment executive pay F Federal Reserve financial crash of 1929 financial crash of 2008 financial markets borrowing discrimination efficient markets hypothesis mispricing short-termism systemic risks financial regulation Finland public innovation research and development universal basic income firms business models in perfect competition productive firm First World War fiscal austerity fiscal compact fiscal consolidation fiscal deficits fiscal policy fiscal tightening food insecurity Forstater, Matthew Fortune 500 companies Fortune 1000 firms fossil fuels fracking France average real wage index labour productivity growth private debt public deficit unemployment Freeman, Chris Friedman, Milton G G4S Gates, Bill Germany average real wage index GDP green technology investment state investment bank unemployment wages global financial system globalisation and welfare state asymmetric first golden age Godley, Wynne Goldman Sachs Goodfriend, Marvin Google governments and innovation deficits failures intervention by modernisation of risk-taking Graham, Benjamin Great Depression Greece austerity bailouts debt problems GDP investment activity public deficit unemployment green technology green direction for innovation greenhouse gas emissions Greenspan, Alan Grubb, Michael H Hatzius, Jan health and climate change older people Hirschman, Albert history Integration with theory home mortgage specialists household income housing purchases value I IBM income distribution industrial revolution inequality adverse effects and economic performance China ethnicity explanation for income international trend OECD countries opportunities redistributive policies reinforcement reversing rise taxation UK wealth inflation information and communications technologies (ICT) consumer demand green direction internet of things online education planned obsolescence innovation and climate change and companies and government and growth innovative enterprise path-dependence public sector institutions European financial role Intel interest rates and quantitative easing Intergovernmental Panel on Climate Change (IPCC) International Bank for Reconstruction and Development (IBRD) International Energy Agency (IEA) International Labour Organization (ILO) International Monetary Fund (IMF) Studies investment and theory of the firm crowding out decline in investment in innovation private private vs publicly owned firms public public–private investment partnerships investment-led growth Ireland debt problems investment activity Public deficit Israel public venture capital fund research and development Italy average real wage index debt problems GDP Income inequality unemployment J Japan average real wage index competitive advantage over US GDP wages Jobs, Steve Juncker, Jean-Claude K Kay Review Keynes, John Maynard KfW Knight, Frank Koo, Richard Krueger, Alan Krugman, Paul L labour markets insecurity of regulation structures United States labour productivity and wages declining growth public deficit unemployment Lehman Brothers Lerner, Abba liquidity crisis Lloyd George, David lobbying corporate M Maastricht Treaty Malthus, Thomas market economy theory markets behaviour failure uncertainty Marshall, Alfred Marx, Karl McCulley, Paul Merrill Lynch Mill, John Stuart Minsky, Hyman mission oriented investment monetary policy money and fiscal policy and macroeconomic policy bank money electronic transactions endogenous exogenous fiat money government bonds IOUs modern money theory quantity theory theories monopolies monopoly rents natural Moore, Gordon N NASA nanotechnology National Health Service (NHS) National Institutes of Health (NIH) national savings neoliberalism corporate Newman, Frank Newton, Isaac O Obama, Barack P patents patient capital patient finance see patient capital Penrose, Edith Piketty, Thomas PIMCO Pisano, Gary Polanyi, Karl Portugal austerity bailout debt problems GDP investment activity unemployment privatisation productivity marginal productivity theory productive firm unproductive firm – see also labour productivity public deficits public goods public organisations and change public policy and change evaluation role public service outsourcing public spending public–private investment partnerships Q quantitative easing quarterly capitalism R Reagan, Ronald recessions Reinhart, Carmen renewable energy policy rents and banks increase rent-seeking research and development (R&D) state organisations Ricardo, David risk-taking – mitigation of risk role of the state Rogoff, Kenneth Roosevelt, Franklin D.

Technological revolutions and economic development ICT and the green direction ‘Green growth’, development, jobs and inequality A radical reshaping of the policy framework Acknowledgements Notes Index End User License Agreement List of Tables 2. The Failure of Austerity: Rethinking Fiscal Policy Table 1: Unemployment when the federal budget deficit is 3% or higher, 1949–2013 7. Investment-led Growth: A Solution to the European Crisis Table 1: Private investment as % of GDP Table 2: Projected average GDP growth (%) Table 3: Unemployed workers (millions of people) Table 4: Debt-to-GDP ratio, south euro zone Table 5: Net government lending as % of GDP List of Illustrations 1. Rethinking Capitalism: An Introduction Figure 1: Percentage of countries experiencing a banking crisis (1945–2008) (weighted by their share of world income) Figure 2: Outstanding private debt (% of GDP) Figure 3: Comparing profiles of UK recessions and recoveries Figure 4: Unemployment rates, selected countries, 2007, 2010 and 2014 Figure 5: Average real wage index for selected developed countries, 2007–2013 Figure 6: Investment (gross non-residential fixed capital formation) as a percentage of GDP Figure 7: Trends in growth in average wages and labour productivity in thirty-six developed economies, 1999–2013 Figure 8: Growth in real after-tax income from 1979 to 2007, US Figure 9: Global greenhouse gas emissions 1990–2050 2.

Smart Cities, Digital Nations
by Caspar Herzberg
Published 13 Apr 2017

Figuring out how to solve the many urban problems of a metro in Manila, Jakarta, or Rio de Janeiro by deploying the analytical and execution capabilities of a smart city network, full of IoE technology and sensors, will go a long way to making the world a better, more hospitable, and more equitable place. When considering what smart and connected city initiatives mean in a global sense, it is important to remember that in many markets, including those with impressive GDP growth and wealth creation, delivering basic services still tops the long list of tasks. It is impossible to ignore the importance of IT technology and architecture to a future in which billions more people must make do with scarcer resources. Creating city services that can intelligently adjust to changing weather patterns and recover after utility disruptions will be a primary component to urban expansion.

With 65 percent of the population under the age of thirty, the need for jobs and housing was an earthquake that could be predicted with precision, and just as implacable as a geologic event. Great plans would be necessary to absorb the shock. Even in 2005, after pronounced market fluctuation, Saudi Arabia was awash in oil profits. More than 51 percent of the country’s GDP derived from oil rents1 (measured by the differential between world crude prices and production costs). Its GDP growth rate, however, had spiked at 7.66 percent in 2004 and then dropped, along with oil prices, through 2005 and 2006. While the Saudi government2 publicly announced a surplus of some 100 billion barrels of oil as defense against severe economic misfortune, the fact remained that the country’s deficits were pinned to the price of oil on the world market.

It may well prove that smart and connected city life becomes a tipping point for IoE, but Cisco believed that the Internet of Everything would also be the Internet of Everywhere. Its ascendancy is not necessarily predicated on the success of smart cities, especially since so few of the Western metropolises have the room for new, greenfield projects. Since China had determined that 8 percent GDP growth was the minimum required to sustain the projected growth of urban population and building, it was reasonable to assume that stimulus and government investment would continue far beyond 2010. As Cisco’s team reckoned with the sheer size and depth of the financial crisis, the mood was somber. Would Chinese municipal leaders look to build smart and connected developments as complex and large as Songdo?

pages: 376 words: 109,092

Paper Promises
by Philip Coggan
Published 1 Dec 2011

So a debt spree might make sense if investors really believed that economic growth was rising; they are simply creating claims on a more prosperous future. But analysis by Jeremy Grantham of the fund management group GMO shows that belief has been wrong-headed. The bull market in assets began in 1982. In the century prior to that date, US GDP growth had averaged 3.4% a year while debt had hovered in the 100 – 150% of GDP range. After 1982, GDP growth has slowed to 2.4% a year, while the debt-to-GDP ratio has soared to more than 300%.20 To sum up, something fundamental changed after 1971, when the Bretton Woods system collapsed. Floating exchange rates allowed larger trade deficits and greater international capital movements.

The country’s banks lent a lot of money to property developers to build houses, on the back of interest rates that were very low relative to the growth rate of Ireland’s GDP (this was a function of Irish membership of the euro-zone). During the boom, Irish GDP growth looked very healthy because Irish workers were being employed to build houses. The taxes they paid also boosted government revenues, encouraging politicians to push up spending; public-sector wages rose by 90 per cent between 2000 and 2008. But the housing boom was unsustainable. Many of the properties stand empty and may never be occupied. So while GDP growth may have looked healthy in the boom years, Ireland was wasting its wealth. The Austrians would argue that there is nothing to be done about this except to let prices and wages fall to adjust to the new reality.

But in a boom, lots of buildings will be thrown up for speculative reasons. One only has to drive around Ireland to see empty houses that were built on the hope of a quick profit, and might never be occupied. While those houses were being built, Irish labourers had jobs and the result was rapid GDP growth. But from the point of view of the long-term health of the Irish economy, this was a disastrous strategy, leaving the country with houses that no one wants and debts that cannot be repaid. Predicting which loans will be used productively, and which will not, is far from easy. Accordingly, lenders need to be paid a return that reflects the risk of default.

Investing Amid Low Expected Returns: Making the Most When Markets Offer the Least
by Antti Ilmanen
Published 24 Feb 2022

Yet, perhaps surprisingly, fast (GDP) growing economies have not delivered reliably higher equity market returns. Dimson-Marsh-Staunton find across countries a negative correlation between long-term average GDP growth and equity market return over a century. Other studies find negative or zero correlation over shorter histories. However, long-term DPS growth and equity market returns are positively related. L'Her et al. find 0.0 correlation between average real market return and real GDP growth – but 0.15 correlation between average real DPS growth and real GDP growth, and 0.60 correlation between average real market return and net buybacks – across 43 countries between 1997 and 2017.

If this ΔS adjustment is made in the income (carry) part, it is important for consistency to then add to it the growth of aggregate total payouts, not of the per-share payouts. Straehl-Ibbotson (2017) estimates that the growth rate in real aggregate total payouts broadly matched the real GDP growth rate of 3.3% between 1901 and 2014, with payouts lagging GDP growth until 1980 and outpacing thereafter. Also see the Online Appendix of AQR Portfolio Solutions Group (2017a). 19 The term “dilution” is at times used narrowly for the per-share versus aggregate dividends (or earnings) growth gap, and at other times broadly for the DPS versus GDP growth gap. Interestingly, the latter gap in the US has flipped sign in recent decades given a benign corporate environment. Between 1997 and 2017, the real DPS has grown annually 3.8%, well ahead of the GDP-per-capita real growth rate of 1.4%, and this has happened despite the growing use of buybacks instead of dividends.

Dividend Yield, dy Price-to-Dividend Change, p/d Real per Capita GDP Growth Net Buybacks, nbb Relative Dynamism, rd Payout Ratio Change Margin Growth = Real Total LC Return, r Inflation and Currency Return, inf+fx = Nominal Total Return in USD AllMktAvg 2.9% –0.3% 2.1%    –2.2%   0.5%    0.5%   1.2%   4.7%   1.9%   6.6% US 1.9 0.4 1.4  –1.8  2.4  0.7 1.2 6.1 1.9 8.0 China 2.6 1.0 8.2 –26.5 14.9 –0.9 1.3 0.7 2.8 3.5 Box 4.2 Weak Empirical Relationship Between GDP Growth and Equity Returns21 Equity markets are often seen as the growth asset: a way of participating in economic growth and bearing the risk of poor performance during recessions.

Global Governance and Financial Crises
by Meghnad Desai and Yahia Said
Published 12 Nov 2003

HC59.7.D368 2003 338.542-dc21 ISBN 0-203-71321-4 Master e-book ISBN ISBN 0-203-34284-4 (Adobe eReader Format) ISBN 0–415–30529–2 (Print Edition) 2003046537 Contents List of figures List of tables List of contributors 1 Introduction viii x xi 1 MEGHNAD DESAI AND YAHIA SAID 2 Financial crises and global governance 6 MEGHNAD DESAI 3 Asset price bubbles and monetary policy 19 FRANKLIN ALLEN AND DOUGLAS GALE 4 The International Monetary Fund: past and future 43 MICHEL AGLIETTA 5 Regulating global finance: rival conceptions of world order 70 ANDREW GAMBLE 6 Crises, recovery and reforms in East Asia 83 JOMO KWAME SUNDARAM 7 Mexico, Korea and Brazil: three paths to financial crises 120 GABRIEL PALMA Index 159 Figures 3.1 3.2 3.3 3.4 4.1 4.2 4.3 Credit and asset prices Optimal risk sharing Consumption without central bank intervention Asset pricing without central bank intervention Reserve positions in the Fund and international reserves IMF quotas and world exports Total liabilities of beneficiary countries in percentage of IMF quotas 4.4 Credit outstandings by type of facilities 6.1 East Asian 4: monthly interest rates, January 1997–May 2000 6.2 East Asian 4: monthly foreign exchange rates, January 1996–June 2000 6.3 (a) Indonesia, Korea, Thailand and Malaysia: annual budget balances, 1996–99; (b) Korea, Thailand and Malaysia: quarterly budget balances, 1997Q1–99Q4 6.A1 (a) Thailand: quarterly merchandise trade balance and reserves, 1997Q1–2000Q1; (b) Indonesia: quarterly merchandise trade balance and reserves, 1997Q1–99Q4; (c) Malaysia: quarterly merchandise trade balance and reserves, 1997Q1–99Q4; (d) Korea: quarterly merchandise trade balance and reserves, 1997Q1–2000Q1 6.A2 (a) Thailand: GDP growth, foreign exchange and interest rate, 1997Q1–2000Q1; (b) Indonesia: GDP growth, foreign exchange and interest rate, 1997Q1–2000Q1; (c) Malaysia: GDP growth, foreign exchange and interest rate, 1997Q1–2000Q1; (d) Korea: GDP growth, foreign exchange and interest rate, 1997Q1–2000Q1 7.1 Latin America and East Asia: aggregate net capital flows before financial liberalisation, and between financial liberalisation and financial crisis 7.2 G7: assets of institutional investors 7.3 Derivatives markets: notional values of outstanding ‘over-thecounter’ interest rate, currency and exchange-traded derivative contracts 27 34 37 38 51 51 54 55 95 96 98 110 111 123 123 124 Figures ix 7.4 7.5 7.6 7.7 7.8 7.9 7.10 7.11 7.12 7.13 7.14 7.15 7.16 7.17 7.18 7.19 7.20 7.21 7.22 7.23 7.24 7.25 7.26 7.27 7.28 East Asia and Latin America: credit to private sector between the beginning of financial liberalisation and respective financial crises Latin America and East Asia: domestic real lending rates between the beginning of financial liberalisation and respective financial crisis Latin America and East Asia: imports of consumer goods between the beginning of financial liberalisation and respective financial crises Latin America and East Asia: annual stock market indices between the beginning of financial liberalisation and respective financial crisis Latin America, East Asia, USA and Europe: stock market indices Latin America and East Asia: real estate price indices between the beginning of financial liberalisation and respective financial crisis Mexico: investment in residential construction, infrastructure and machinery and equipment South Korea: sectoral surpluses of the corporate, household, public and foreign sectors Mexico: composition of net private capital inflows Korea: composition of net private capital inflows Latin America and East Asia: ratio of short-term debt to total debt between the beginning of financial liberalisation and respective financial crisis Latin America and East Asia: ratio of foreign exchange reserves to short-term debt between the beginning of financial liberalisation and respective financial crisis Latin America and East Asia: ratio of foreign exchange reserves to M2 between the beginning of financial liberalisation and respective financial crisis Chile: composition of net private capital inflows Chile: net equity securities and other investment Chile: real effective exchange rate and foreign exchange reserves Chile versus Brazil and Thailand: short-term foreign debt Chile: quarterly stock market index Chile: quarterly real estate index Chile: credit to the private sector and real interest rates Malaysia: net private capital inflows Malaysia: composition of net private capital inflows Malaysia: net ‘other’, portfolio investment and ‘errors’ Malaysia: quarterly stock market index Malaysia: quarterly real estate index 125 127 128 129 130 131 132 133 134 134 135 135 136 141 142 142 144 145 145 146 147 148 149 150 151 Tables 3.1 3.2 3.3 3.4 4.1 4.2 6.1 6.2 6.3 6.4 6.5 6.6 6.A1 6.A2(a) 6.A2(b) 6.A2(c) 6.A2(d) 6.A3(a) 6.A3(b) 6.A3(c) 6.A3(d) Details of the two assets A mean-preserving spread of risky asset returns Credit, risky asset prices and interest rates A mean-preserving spread of financial risk Synopsis of the Fund’s mandate Types of international prudential organization East Asia four: macroeconomic indicators East Asian four: lending by BIS reporting banks by sector Exposure of BIS reporting banks to non-BIS borrowers Maturity distribution of lending by BIS reporting banks to selected Asian economies East Asian four: debt service and short-term debt East Asian four: exchange rates and depreciation against US dollar East Asian four: macroeconomic indicators Thailand: foreign debt indicators Indonesia: foreign debt indicators Malaysia: foreign debt indicators Korea: foreign debt indicators Thailand: loans and advances by commercial banks Indonesia: loans and advances by commercial banks Malaysia: loans and advances by commercial banks Korea: loans and advances by commercial banks 23 24 28 28 58 60 86 87 88 88 90 96 112 114 115 116 117 118 118 119 119 Contributors Michel Aglietta is a senior member of l’Institut Universitaire de France.

Source: IMF. 30.0 20.0 2000Q1 1999Q4 1999Q3 1999Q2 1999Q1 1998Q4 1998Q3 1998Q2 1998Q1 1997Q4 1997Q3 1997Q2 1997Q1 10.0 0.0 16,000 12,000 10,000 8,000 6,000 Rupiah/USD 14,000 4,000 0.0 Interest rates 2000Q1 1999Q4 1999Q3 1999Q2 1999Q1 1998Q4 1998Q3 1998Q2 1998Q1 1997Q4 GDP Growth 2000Q1 –15 1999Q4 1.0 1999Q3 –10 1999Q2 2.0 1999Q1 –5 1998Q4 3.0 1998Q3 0 1998Q2 4.0 1998Q1 5 1997Q4 5.0 1997Q3 10 1997Q2 6.0 1,800 1,600 1,400 1,200 1,000 800 600 400 200 0 RM/USD 0 Won/USD 2000Q1 1999Q4 1999Q3 1999Q2 1999Q1 1998Q4 1998Q3 1998Q2 1998Q1 1997Q4 1997Q3 1997Q2 1997Q1 2,000 15 25 20 15 10 5 0 –5 –10 –15 –20 –25 Baht/USD 40.0 1997Q3 Percent (d) 50.0 1997Q2 Percent (c) 80 70 60 50 40 30 20 10 0 –10 –20 60.0 1997Q1 Percent (b) 30 25 20 15 10 5 0 –5 –10 –15 1997Q1 Percent (a) FOREX Figure 6.A2 (a) Thailand: GDP growth, foreign exchange and interest rate, 1997Q1–2000Q1; (b) Indonesia: GDP growth, foreign exchange and interest rate, 1997Q1–2000Q1; (c) Malaysia: GDP growth, foreign exchange and interest rate, 1997Q1–2000Q1; (d) Korea: GDP growth, foreign exchange and interest rate, 1997Q1–2000Q1. Sources: Financial Extel & BOT, BOI, BNM and BOK respectively. Korea Real GDP Private Consumption M2 M3 Inflation C.A. deficit/GDP Foreign reservesa Malaysia Real GDP Private Consumption M2 M3 Inflation C.A. deficit/GDP Foreign reservesa 9.2 8.0 21.9 23.6 9.3 2.8 13,306 17.2 28.7 8.5 0.8 14,459 14.5 15.3 4.4 8.9 10,421 12.8 18.2 3.1 2.1 9,327 9.0 9.6 8.2 9.5 1991 9.7 13.1 1990 7.8 3.0 14.9 21.8 6.3 1.3 16,640 5.4 5.5 19.1 19.6 4.8 2.8 16,784 1992 8.4 4.6 16.6 19.0 4.8 0.3 19,704 5.5 5.6 22.1 23.5 3.6 4.8 26,814 1993 9.2 9.8 18.7 24.7 6.2 1.0 25,032 8.3 8.2 14.7 13.1 3.7 6.3 24,888 1994 Table 6.A1 East Asian four: macroeconomic indicators (year on year % change) 9.5 9.4 1996 8.6 6.9 6.8 7.1 15.6 15.8 19.1 16.7 4.5 4.9 1.7 4.4 31,928 32,402 8.9 9.6 24.0 21.4 22.3 21.2 3.4 3.5 8.5 4.9 22,945 26,156 1995 7.5 4.3 14.1 13.9 4.5 1.7 19,710 5.0 3.5 22.6 18.5 2.7 5.0 20,013 1997 1999 5.4 2.5 27.0 12.5 7.5 12.8 51,963 6.7 11.4 27.4 8.0 0.8 6.1 73,700 11.0 10.3 1.5 11.6 2.73 8.25 5.3 2.8 12.9 14.0 24,728 30,853 7.5 10.8 1998 7.0 8.0 17.1 9.4 3.8 9,151 44.2 7.4 3.4 7,353 19.8 19.9 5.7 7.5 17,287 26.7 — 6.0 8.3 13,247 7.2 17.2 8.4 6.6 11.6 12.8 20.2 7.5 2.1 10,181 6.5 3.1 15.6 18.5 4.1 5.5 20,012 7.8 7.8 22.0 9.7 1.6 10,988 6.5 11.8 18.4 19.7 3.3 5.5 24,078 8.3 8.7 20.2 8.5 1.7 11,820 7.7 4.7 12.9 17.6 5.0 5.6 28,884 8.9 8.3 6.4 6.6 7.8 9.2 27.6 29.6 9.4 6.5 3.6 3.3 13,306 17,820 8.2 9.7 17.0 12.6 18.7 13.4 5.8 4.8 8.0 7.9 35,463 37,192 8.7 8.6 23.2 6.6 2.3 16,088 4.7 5.3 16.4 3.2 5.6 2.1 25,697 1.8 1.3 62.3 58.5 4.1 22,401 13.2 2.1 9.5 8.9 8.1 12.7 28,434 10.4 2.2 11.9 20.5 3.5 27,160 0.2 1.5 2.1 1.6 0.3 9.1 34,781 4.1 n.a.

Source: IMF. 30.0 20.0 2000Q1 1999Q4 1999Q3 1999Q2 1999Q1 1998Q4 1998Q3 1998Q2 1998Q1 1997Q4 1997Q3 1997Q2 1997Q1 10.0 0.0 16,000 12,000 10,000 8,000 6,000 Rupiah/USD 14,000 4,000 0.0 Interest rates 2000Q1 1999Q4 1999Q3 1999Q2 1999Q1 1998Q4 1998Q3 1998Q2 1998Q1 1997Q4 GDP Growth 2000Q1 –15 1999Q4 1.0 1999Q3 –10 1999Q2 2.0 1999Q1 –5 1998Q4 3.0 1998Q3 0 1998Q2 4.0 1998Q1 5 1997Q4 5.0 1997Q3 10 1997Q2 6.0 1,800 1,600 1,400 1,200 1,000 800 600 400 200 0 RM/USD 0 Won/USD 2000Q1 1999Q4 1999Q3 1999Q2 1999Q1 1998Q4 1998Q3 1998Q2 1998Q1 1997Q4 1997Q3 1997Q2 1997Q1 2,000 15 25 20 15 10 5 0 –5 –10 –15 –20 –25 Baht/USD 40.0 1997Q3 Percent (d) 50.0 1997Q2 Percent (c) 80 70 60 50 40 30 20 10 0 –10 –20 60.0 1997Q1 Percent (b) 30 25 20 15 10 5 0 –5 –10 –15 1997Q1 Percent (a) FOREX Figure 6.A2 (a) Thailand: GDP growth, foreign exchange and interest rate, 1997Q1–2000Q1; (b) Indonesia: GDP growth, foreign exchange and interest rate, 1997Q1–2000Q1; (c) Malaysia: GDP growth, foreign exchange and interest rate, 1997Q1–2000Q1; (d) Korea: GDP growth, foreign exchange and interest rate, 1997Q1–2000Q1.

pages: 346 words: 89,180

Capitalism Without Capital: The Rise of the Intangible Economy
by Jonathan Haskel and Stian Westlake
Published 7 Nov 2017

Appendix: Effect of Unmeasured Intangibles on GDP Growth The effect of unmeasured intangibles on GDP growth is a bit complicated. Since measured GDP levels include measured investment, then GDP growth includes measured investment growth (multiplied by the share of investment in GDP). So mismeasurement only occurs if the omitted investment is growing faster or slower than GDP growth: if they are growing at exactly the same rate, we get the level of GDP wrong, but the growth rate is right. Thus if the omitted intangible investment grows faster than measured GDP growth, measured GDP growth is too low, which can look just like secular stagnation (in the sense of low growth).

The Conference on Research in Income and Wealth, founded in the United States in 1936 to conduct research into measurement in economics, gathered in Washington under the leadership of Carol Corrado and Dan Sichel, then at the US Federal Reserve Board, and John Haltiwanger, a professor of economics at the University of Maryland. At this conference and afterwards, Corrado, Sichel, and Charles Hulten from the University of Maryland built a framework for recording different types of intangible investment and their contribution to GDP growth. Then began a painstaking process of defining and measuring the different types of investment, first of all for the United States and gradually for other countries. In 2005 Corrado, Hulten, and Sichel produced the first set of estimates for the United States (2005). In 2006 Hulten gave a seminar at the UK Treasury on what the US team was doing.

We have identified four possible ways that the long-term shift from tangible to intangible investment could be causing or exacerbating it. First, mismeasurement helps explain a little of the puzzle. The inclusion of intangible investment, which has been rising, shows that the investment drought is not as bad as it seems. It also marginally improves GDP growth. But the bulk of the secular stagnation problem remains. Second, it looks like the scalability of intangibles is allowing very large and very profitable firms to emerge. These firms may also be better placed to appropriate the spillovers of other firms’ intangible investments. That raises the productivity and profits gap between the leaders and the laggards and simultaneously decreases the incentives to invest for laggard firms.

pages: 295 words: 90,821

Fully Grown: Why a Stagnant Economy Is a Sign of Success
by Dietrich Vollrath
Published 6 Jan 2020

This implies that the price of a 2005 TV, in 2015, was only $200. Which means the growth in the price of 2005 TVs was −75%, as it fell from $800 to $200. But if the BEA used the 0% growth of the price of a TV, it is overstating price growth and understating real GDP growth. Feldstein’s argument is that there are a large number of goods and services that have this problem, and so we are overstating price growth in general and understating real GDP growth. This problem gets even worse when you consider the introduction of entirely new goods or services into the economy. For those new items, we have no way to get a price for them before they were introduced.

It isn’t an index of unemployment, or how well the stock market is doing, or the profit margins of firms, or whether firms are making profits or losses at all. It doesn’t measure the size of your bank balance or retirement account. There may be some tendency for things like profits or stock prices to rise rapidly when real GDP growth is large, but there is no necessary connection. Real GDP is related to things like the stock market or the unemployment rate in the same way that the final score of a football game is related to time of possession. Yes, there is a tendency for the team with more time of possession to outscore its opponent, but that doesn’t mean that points are awarded for each minute a team holds the ball.

The top row replicates the growth calculation we just did for 1950 to 2000. The first column shows average growth in real GDP per capita (2.25%). The second and third columns show the weighted growth in physical capital (0.64%) and human capital (0.62%), using our elasticities to figure out how important each of them was to producing GDP growth. The last column is average growth in the residual (0.98%), which is the first column minus the second and third ones. In the middle of the table, you’ll see the accounting for each individual decade of the twentieth century. Growth was a little slower in the 1950s (1.78%) and a little faster in the 1960s (2.92%), but for the most part the growth rate of real GDP per capita stayed close to the average of 2.25%.

pages: 386 words: 122,595

Naked Economics: Undressing the Dismal Science (Fully Revised and Updated)
by Charles Wheelan
Published 18 Apr 2010

The general rule of thumb, based on research done by economist Arthur Okun and known thereafter as Okun’s law, is that GDP growth of 3 percent a year will leave the unemployment rate unchanged. Faster or slower growth will move the unemployment rate up or down by one-half a percentage point for each percentage point change in GDP. Thus, GDP growth of 4 percent would lower unemployment by half a percentage point, and GDP growth of only 2 percent would cause unemployment to rise by half a percentage point. This relationship is not an iron law; rather, it describes the relationship in America between GDP growth and unemployment over the five-decade period studied by Mr.

If the president really did wake up from a coma after suffering a horseshoe accident, it’s a fair bet that he would ask for one number first: gross domestic product, or GDP, which represents the total value of all goods and services produced in an economy. When the headlines proclaim that the economy grew 2.3 percent in a particular year, they are referring to GDP growth. It means simply that we as a country produced 2.3 percent more goods and services than we did the year before. Similarly, if we say that public education promotes economic growth, we are saying that it raises the rate of GDP growth. Or if we were asked whether an African country is better off in 2010 than it was in 2000, our answer would begin (though certainly not end) with a description of what happened to GDP over the course of the decade.

China has taken this last point to heart. Chinese GDP growth over the past decade has been the envy of the world, but it has come at the cost of significant environmental degradation. Of the twenty-five most polluted cities in the world, sixteen are in China (you’ve never heard of most of them). China’s State Environmental Protection Administration has begun to calculate “Green GDP” figures, which seek to evaluate the true quality of economic growth by subtracting the costs of environmental damage. Using this metric, China’s 10 percent GDP growth in 2004 was really closer to 7 percent when the $64 billion in pollution costs are taken into account.

pages: 367 words: 97,136

Beyond Diversification: What Every Investor Needs to Know About Asset Allocation
by Sebastien Page
Published 4 Nov 2020

In the absence of a strong view on margins, it’s common practice to assume that total market earnings will grow at the same rate as GDP.16 Currently, the IMF forecasts world GDP to grow around 3.5–4% per year for the next five years (in real terms).17 This “new normal” growth rate, when combined with the income and valuation change components, gets us closer to our earlier CAPM estimates. While expected GDP growth is available at the country level, it doesn’t apply directly to equity sectors or style/size sub–asset classes (large caps, small caps, value, and growth). However, it provides a reality check on the ROE-based numbers. If we assume a very long horizon, GDP growth puts an upper-bound on our estimates. Moreover, we can use regression analysis between GDP growth and sector-level earnings to build more granular, sector-level forecasts. In practice, while they don’t necessarily run regressions, fundamental analysts intuitively account for the broad economic environment when they forecast company-level earnings.

Then there’s the relative valuation between stocks and bonds. Relative to global bond yields, stocks are much cheaper than they appear on the basis of the CAPE alone. Should we expect rates to remain low by historical standards for the next 10 years? Lower growth for longer (new normal) and lower volatility in macroeconomic variables such as GDP growth and inflation should, at least theoretically, lead to lower rates for longer. If so, the CAPE could remain elevated. It’s simple math: lower discount rates mean higher valuations. But there’s no doubt that unwinding global monetary stimulus poses risks (and even more risks in a post-COVID-19 world).

Most of these portfolio managers are bottom-up stock pickers, but they have a good sense of what to expect for their sector. They talk to CEOs, comb through company balance sheets and income statements, and stay on top of important trends in technology, labor costs, consumer demand, etc. Some of them may use a formal decomposition for earnings growth that starts with a forecast of sales (perhaps tied to GDP growth), adjusts for margins (which tend to mean-revert over time), and so on. Others may express a gut feeling, which, given their investment experience and expertise, is often better than any quantitative approach we could think of. In the same survey, we ask them to forecast the level of the P/E ratio in five years.

pages: 353 words: 148,895

Triumph of the Optimists: 101 Years of Global Investment Returns
by Elroy Dimson , Paul Marsh and Mike Staunton
Published 3 Feb 2002

Growth rates in the second halfcentury were higher, but while real GDP per capita growth averaged 3.1 percent, real dividend growth was just 1.4 percent on average. GDP growth exceeded real dividend growth in all countries except Germany, Sweden, and Switzerland. The correlation between the two variables was no longer negative, but at 0.06 it was statistically indistinguishable from zero. These findings help us to place in context the debate about the likelihood of projected future dividend growth greatly outstripping GDP. Figure 11-6 also shows the total real return from equities in each country (the green bars). Visually, real returns seem unrelated to GDP growth, and statistically, the correlation is -0.27 for 1900–2000 and -0.03 for 1951–2000.

Our findings span 101 years. At the start of our period in 1900, multinationals were far less important. Furthermore, it is hard to believe that investors in 1900 had factored into stock prices a fully accurate assessment of the next 101 years’ GDP growth. We therefore conjecture two other explanations for why, even over very long periods, we find no link between stock market performance and GDP growth. First, part of the explanation may lie in measurement problems. GDP estimation today is far from the precise science many imagine, but back in 1900 it was excessively crude. Second, we may be misguided in expecting a relationship since GDP can grow without generating wealth gains to equity holders.

In most countries, real dividend growth was lower in the turbulent first half of the twentieth century. Real dividends have generally grown more slowly than real GDP per capita, and real dividend growth does not appear, as is often assumed, to be positively correlated with GDP growth—if anything, the correlation is negative. The same finding applies to the correlation between GDP growth and total equity returns. Over time, the path of real dividend growth rates appears to approximate a random walk, and growth rates have been quite volatile. Dividend growth is interesting both in its own right and because it plays a key role in valuation models and financial research.

pages: 829 words: 186,976

The Signal and the Noise: Why So Many Predictions Fail-But Some Don't
by Nate Silver
Published 31 Aug 2012

The American and global economies are always evolving, and the relationships between different economic variables can change over the course of time. Historically, for instance, there has been a reasonably strong correlation between GDP growth and job growth. Economists refer to this as Okun’s law. During the Long Boom of 1947 through 1999, the rate of job growth40 had normally been about half the rate of GDP growth, so if GDP increased by 4 percent during a year, the number of jobs would increase by about 2 percent. The relationship still exists—more growth is certainly better for job seekers. But its dynamics seem to have changed.

Although the economists did not explicitly quantify it, it can be inferred that they would have assigned only about a 1-in-2,000 chance to a GDP reading of –3.3 percent or worse. 17. Specifically, I’ve looked at the forecasts made each November about the GDP growth in the following year; for instance, the November 1996 forecast of GDP growth in 1997. 18. Michael P. Clements, “An Evaluation of the Survey of Professional Forecasters Probability Distribution of Expected Inflation and Output Growth,” Journal of Economic Literature, November 22, 2002. http://www.icmacentre.ac.uk/pdf/seminar/clements2.pdf. 19.

There is also considerable uncertainty about how effective stimulus spending really is. Estimates of the multiplier effect—how much each dollar in stimulus spending contributes to growth—vary radically from study to study,99 with some claiming that $1 in stimulus spending returns as much as $4 in GDP growth and others saying the return is just 60 cents on the dollar. When you layer the large uncertainty intrinsic to measuring the effects of stimulus atop the large uncertainty intrinsic to making macroeconomic forecasts of any kind, you have the potential for a prediction that goes very badly. What the Forecasting Failures Had in Common There were at least four major failures of prediction that accompanied the financial crisis.

pages: 193 words: 47,808

The Flat White Economy
by Douglas McWilliams
Published 15 Feb 2015

That is why Old Street Roundabout has become popularly known as ‘Silicon Roundabout. The scale of this new economy is such that it has affected – directly or indirectly – the whole UK economy. Roughly one third of the UK economy (30.7%) is now in business and financial services: this contributed 54% of the total GDP growth between 2010 and Q2 of 2014. Obviously not all of this growth is from the Flat White Economy. But it is the driving force behind this growth. And it appears probable from my analysis for this book that even the rapid growth officially recorded understates the Flat White Economy’s contribution. The People’s Daily newspaper – the mouthpiece of the Chinese government – has described the UK as an “old, declining empire”, one which resorts to “eccentric acts” to hide its embarrassment over its declining power.2 But the latest data shows that the UK is one of the fastest-growing economies in the Western world.

It had become clear to me while analysing the statistics that, since the Big Bang, London underwent an economic growth to rival the mega-growth of Far East economies. I called it the “Tiger Economy on the Thames”. London’s growth continued until 2007; indeed, for the entire period from 1997–2007, London’s economy grew at an annual rate of 6.2% in cash terms. With inflation averaging perhaps 2% over the period this meant real GDP growth grew at an annual rate of over 4% – fast enough to rival Far East economies. This growth was underpinned by the City of London: the number of “City jobs” rose from a plateau of 170,000 in the mid-1980s to a peak of 230,000 in 1989; it collapsed to 190,000 in 1993; but it had recovered to over 350,000 by 2007.2 As the number of jobs increased, so did the money on the payslips.

• The loss that the UK economy would suffer were the dominant London financial sector to be scaled back to the scale of the European average. The report is highly quantitative. It has two unique features: • A quantified analysis of the impact of higher growth in London on economic trends in the regions. • A detailed model-based analysis of what would be the impact on the regions if London’s GDP growth were to be curbed, for example, through a less successful financial services sector. It is the only report to quantify the extent to which the rest of the UK is influenced by interest rate policy set for the UK as a whole including London; which by implication means that a faster growing London is likely to push up interest rates for the whole of the UK and hence have some negative impacts on the other parts of the country.

Crisis and Dollarization in Ecuador: Stability, Growth, and Social Equity
by Paul Ely Beckerman and Andrés Solimano
Published 30 Apr 2002

Although the oil boom allowed a doubling of the yearly real growth rate of GDP of previous decades, from an annual rate of growth of 4.7 percent per year in 1950–60 to 9.4 percent in the 1970s, this dynamism was ultimately short-lived. In the 1980s and 1990s the economy reverted to average GDP growth rates on the order of 2 percent, lower than the historic average of the past 50 years in Ecuador and in Latin America. In the 1980s Ecuador, like other Latin American economies, suffered a foreign debt crisis after the windfall of oil revenues of the 1970s, and the cycle of foreign overborrowing of that decade. As a consequence, GDP growth declined to around 2 percent in the 1980s, down from more than 9 percent in the previous decade. In the 1990s, Ecuador started reforms that were never completed, suffered several large external shocks and natural disasters, and then culminated the decade with the disruptive economic and financial crisis we have already discussed and which is analyzed in further detail in the next chapter of this book.

In addition, as the economic crisis came with instability, continuous currency depreciation, and high and volatile inflation, there was a reduction in real wages, affecting workers and their families as well as other low-income groups and classes whose incomes grow (if at all) at a slower pace than the exchange rate and average prices. In the case of Ecuador, as documented in chapter 4, unemployment, poverty, and inequality all worsened in this period. From a longer-term perspective, the low (and volatile) rate of GDP growth of the 1980s and 1990s implied almost stagnant income per capita for a long period, with minimal poverty reduction, persistent inequality, and social marginalization of minorities. This social situation worsened further because of the economic crisis of the late 1990s. The social impact of dollarization has to be evaluated against this background.

It reduced domestic taxation: non-oil public-sector revenue fell from 18.7 percent of GDP in 1972 to 13.8 percent in 1975, while oil revenue rose from 2 to 8.4 percent. The government applied part of the oil earnings to subsidize domestic electricity and oil derivatives. From 1970 to 1977 annual real GDP growth exceeded 9 percent11 (compared with just below 6 percent in the 1960s). As the economy grew, Ecuador’s private sector—mainly commercial banks—began borrowing from foreign banks engaged in “recycling” OPEC surpluses. During 1974 and 1975, however, rising aggregate demand induced inflationary pressure.

pages: 302 words: 84,428

Mastering the Market Cycle: Getting the Odds on Your Side
by Howard Marks
Published 30 Sep 2018

The main questions most people (and certainly most investors) care about with regard to the economy are whether we’ll have growth or recession in a given year, and what the rate of change will be. Both of these are components of what I call the short-term economic cycle. (I’ll introduce other considerations shortly.) When we think about U.S. GDP growth in a given year, we usually start with an assumption in the range of 2% to 3% or so and then add or subtract for the specific circumstances. But the starting point for each year’s GDP growth is invariably positive. For example, as last year began there was a lot of discussion about the rate at which GDP would grow. The optimists thought it’d be nearly 3%, and the pessimists thought it might not reach 2%.

The optimists thought it’d be nearly 3%, and the pessimists thought it might not reach 2%. But just about everyone thought it would be positive. The official definition of a recession is two consecutive quarters of negative growth, and very few people thought GDP growth would fall into negative territory—last year or soon thereafter. Long-Term Economic Trends Many investors are concerned about year-to-year economic growth: high or low, positive or negative. The developments they’re asking about are short-term considerations. They’re important, but they’re not everything. In the long run their importance fades and long-term considerations become more relevant.

Growth in the population means there are more people working each year to make and sell products (and also more people to buy and consume them, encouraging production). More production equals more GDP. If the population is growing, hours worked tend to grow, and so does GDP. Thus births are one of the main reasons for the usual presumption that economic growth will be positive. On the other hand, if the population is shrinking, positive GDP growth faces a significant headwind. Population growth doesn’t vary much from year to year. The number of people of child-bearing age doesn’t change much in the short run, and neither does their tendency to have children. These things do change over decades or longer, however, so they cause changes in long-term population.

pages: 290 words: 82,871

The Hidden Half: How the World Conceals Its Secrets
by Michael Blastland
Published 3 Apr 2019

Thus, if the first estimate is that GDP grew by about 0.3% in the quarter from April to July, it would be unsurprising if that were revised up to 0.5%, or down to 0.1%. That’s a heck of a spread. By normal standards, GDP growth of 0.1 would be sickly; 0.5 would be pretty good. It appears that we don’t initially know the difference. This ought to be humbling enough. The first estimate of 0.3% growth might be our first best guess, but there’s evidently considerable uncertainty around GDP growth figures, especially around initial estimates. Not that this uncertainty does much to inhibit a rash of causal inferences from politicians, economists and commentators, explaining why GDP is or is not growing as fast as we think it should be, or as fast or faster than other rich countries, and then telling us what we’re doing right or wrong.

Does this mean we should shut up about GDP growth? No, it matters too much. It’s the cornerstone of economic policy – even if an unstable cornerstone on which we should be careful what we build. But there are better ways of talking about the uncertainty, and it’s worth acknowledging again that some people are extremely careful what they say. In the last chapter, we’ll look at ideas for coping with a lack of reliable knowledge other than by hoping it won’t matter. Meanwhile, we could concentrate less on short-term fluctuations – about which our understanding and confidence is weakest – and point out instead that GDP growth in the UK over the decade up to 2018 was the slowest for 70 years – a conclusion which, even resting on imperfect data, is sufficiently big to make the agitation over quarterly changes of 0.1% here or there pale in comparison.

We have to find a way to measure it ourselves, and we do so with incomplete information, as information tends to be: that is, we use samples of economic activity – big ones as these things go, but samples all the same – and then compare these samples with other sources of data. The first estimate of GDP growth for each quarter of the year is published about 25 days after the quarter ends. That’s fast. But it’s an estimate based on a sample (of 44% ‘actual’ data, according to the Office for National Statistics), and it’s revised as more data come in. The first revision to this initial estimate is published about two months later.

The Unusual Billionaires
by Saurabh Mukherjea
Published 16 Aug 2016

This is similar to what I had explained under ‘Reason 2: Power of Compounding’ where even with a 50 per cent strike rate and perfect symmetry around the returns generated by winning and losing stocks, the portfolio when left untouched for longer periods of time compounds well. Why? Because, over time, the losing stocks become insignificant while the portfolio returns are gradually dominated by the winners. That is the central point of the Coffee Can Portfolio. 1 Nominal GDP growth rate ignores the impact of inflation, unlike real GDP growth which is an inflation-adjusted measure. For the purposes of this book, we use nominal GDP growth rate because inflation provides a natural tailwind for all companies in general. Consumer price inflation in India has averaged 8.4 per cent in the past decade and this would inflate revenue growth for most companies. 2 The rate of return that a company’s equity shareholder demands as compensation for the risk of investing his money in owning the company’s stock. 3 The rate of interest paid on loans taken by the company. 4 Measured over FY05–15; i.e. we take median ROCE over FY05–15 and revenue growth over FY05–15. 5 The Bombay Stock Exchange (BSE) launched the S&P (Standard and Poor’s) BSE200 Index on 27 May 1994.

As I have highlighted in Chapter 1, research shows that companies with higher ROCEs have generated better stock price returns. • Is the industry’s business dependent on India’s broader economic cycle? A company or an industry is called cyclical when its main business is closely linked with the overall economic growth of the country where it operates. As GDP growth rises, so does production, employment and incomes. This increases demand for products. Conversely, when GDP growth stalls, it drags down production, employment and incomes. Sectors like airlines, cement, metals, infrastructure, housing, banking and finance are examples of cyclical industries. On the other hand, industries like consumer staples, information technology and pharmaceuticals are comparatively immune to economic cycles.

For example, the decade from FY06 (i.e. the financial year ending 31 March 2006) to FY15 (i.e. the financial year ending 31 March 2015) coincides with six years of strong economic growth (FY06 to FY11, where average nominal GDP (gross domestic product) growth1 was 15.7 per cent) and four years of weak economic growth (FY12 to FY15, where average nominal GDP growth was 12.8 per cent). Hence, measuring greatness over a decadal period should not unfairly penalize cyclical companies, nor unfairly advantage companies in more stable, steady sectors. Step 3: Define Superior Financial Performance: At the very basic level, a company doing well would mean that it is profitable and it is growing (by successfully reinvesting its profits).

pages: 829 words: 187,394

The Price of Time: The Real Story of Interest
by Edward Chancellor
Published 15 Aug 2022

Real estate development, fuelled by low-cost credit, delivered what President Xi called ‘fictional growth’. By 2019 Chinese GDP growth (per capita) had fallen to half its 2007 level. The Third Plenum of the Eighteenth Chinese Communist Party Congress, held in Beijing in 2013, heralded profound reforms to banking practices. The ceiling on bank deposit rates was lifted, and banks could set their own lending rates. Households earned a little more on their bank deposits, but interest rates remained below nominal GDP growth. The central bank now turned to managing the volatility of the interbank market interest rate.141 The People’s Bank still lacked independence and had to appeal to the State Council for any change to monetary policy.

(Source: Homer and Sylla, from William J. Bernstein, The Four Pillars of Investing: Lessons for Building a Winning Portfolio (New York, 2002)) 5. Discount rate of the New York Federal Reserve, 1920–1930. (Source: Federal Reserve Economic Data) 6. Bank of Japan discount rate and Japanese nominal GDP growth, 1985–1995. (Source: Bank of Japan, Global Financial Data) 7. US monetary policy in the early 2000s. (Source: Federal Reserve Economic Data) 8. Long-term US interest rates, 1945–2021. (Source: Federal Reserve Economic Data) 9. The Great American Wealth Bubble, 1954–2020. (Source: Federal Reserve Economic Data) 10.

After the global stock market crash in October that year, the BOJ further eased credit conditions, with the aim of boosting domestic demand and global economic growth.4 It was widely believed that Japanese interest rates would remain low for some time to come. Japan’s great bubble economy now emerged. The nation’s money supply and credit expanded rapidly while interest rates were held well below the economy’s GDP growth rate.5 Business investment soared. Japanese corporations, which issued foreign currency warrant bonds, enjoyed a negative cost of borrowing after swapping the proceeds back into yen. Financial engineering, known as zaitech, became commonplace: companies borrowed to speculate in stocks through their brokerage trust or tokkin accounts.

pages: 267 words: 74,296

Unhappy Union: How the Euro Crisis - and Europe - Can Be Fixed
by John Peet , Anton La Guardia and The Economist
Published 15 Feb 2014

(eds), The Delphic Oracle on Europe, Oxford University Press, 2011 Tsoukalis, L., The Unhappy State of the European Union, Policy Network, March 2014 Van Middelaar, L., The Passage to Europe, Yale University Press, 2013 Appendix 4 How The Economist saw it at the time May 1st–7th 2010 July 10th–16th 2010 November 20th–26th 2010 December 4th–10th 2010 January 15th–21st 2011 March 12th-18th 2011 June 11th-17th 2011 June 25th-July 1st 2011 October 29th-November 4th 2011 November 5th-11th 2011 November 12th-18th 2011 November 26th-December 2nd 2011 February 18th–24th 2012 March 31st–April 6th 2012 May 19th–25th 2012 May 26th-June 1st 2012 July 28th-August 3rd 2012 August 11th-17th 2012 November 17th-23rd 2012 March 23rd-29th 2013 May 25th–31st 2013 September 14th–20th 2013 October 26th-November 1st 2013 January 4th-10th 2014 Index 1974–75 global recession 10 A accession treaties 112 accountability 125–129, 162 Alliance of Liberals and Democrats for Europe (ALDE) 130–131 Alogoskoufis, George 42 Amsterdam treaty 111–112, 193 Anastasiades, Nicos 2, 86–88 Anglo Irish Bank 53 Ansip, Anders 104 Arab spring 145–146 Argentina 5, 50 Armenia 149 Ashton, Catherine 28, 43, 144 Asmussen, Jörg 51, 82 Austria 111, 127 influence 108 interest rates 93 Azerbaijan 149 Aznar, José Maria 17 B Bagehot, Walter 9 bail-in rules 83, 90–91, 165 see also Cyprus bail-outs national approval requirement 127 no-bail-out rule 45, 162, 163–165 Balkans war 143 Bank of Cyprus 86–87 Bank of England 47, 157 bank recapitalisation 58–59, 74–77, 84 Bankia 72 banking sector characteristics 35 banking supervision see financial supervision banking union 23, 74–75, 77, 83–85, 90–92, 106, 165, 195 see also deposit guarantees; financial supervision Barnier, Michel 41, 138 Barroso, José Manuel early days of crisis 41 European Commission 97, 98, 141, 172 Greece 3, 78 Italy 63 Batista, Paulo Nogueira 46 Belarus 149 Belgium 17, 100, 127 Berlusconi, Silvio euro currency view 151 Italy’s failure to reform 59, 60, 62–63 People of Freedom party (PdL) 107 resignation 64 Black Wednesday 16–17 Blair, Tony 28, 112 BNP Paribas 40 Bolkestein directive 137 bond yields 37, 38, 61, 70, 89 bond spreads 37, 42, 70, 80, 88 Bootle, Roger 1 Bowles, Sharon 98, 129 Brandt, Willy 10 Bretton Woods 9–10 Brown, Gordon 24, 41, 48, 102, 112, 144 Bruegel think-tank 35, 74, 163, 166 budget deficits Maastricht ceiling 15 timescales for meeting targets 88–89 see also stability and growth pact budgets annual, European 21, 27, 118 central 13, 168–170 federal 164, 168 fiscal capacity 84 Bulgaria 108, 113, 124, 126, 147 Bundesbank 16, 23, 157 C Cameron, David 14, 17, 64–65, 117–119, 132, 140 Cannes G20 summit (2011) 62–64 Capital Economics 1 Cassis de Dijon judgment 21 Catalonia 178 CEBS (Committee of European Banking Supervisors) 35 central banks, national 22–23 Centre for European Policy Studies 34 Centre for European Reform 34 CFSP (Common Foreign and Security Policy) 142, 144 China 33, 139, 167 Chirac, Jacques 18, 23, 100, 127 Christofias, Demetris 86 Churchill, Winston 7, 115, 161 Clark, Christopher 178 climate change 135–136 Clinton, Hillary 144 Cockfield, Arthur 13 Committee of European Banking Supervisors (CEBS) 35 Committee of Permanent Representatives (COREPER) 20 Committee of Regions 21 common fisheries policy 100, 138 Common Foreign and Security Policy (CFSP) 142, 144 community method 19, 21–22 Competitiveness Pact see Euro Plus Pact complacency pre-crisis 36–37 Constâncio, Vítor 34 constitution proposals 26–27 convergence criteria 14–16, 41, 112, 193 COREPER (Committee of Permanent Representatives) 20 COSAC (Conference of Community and European Affairs Committees of Parliaments of the European Union) 133 Council of Ministers 20, 121, 130 Council of the European Union see Council of Ministers Court of Auditors 21 Court of First Instance 21 Crafts, Nicholas 9 credit ratings (countries) 69, 77–78, 108 Crimea 150 Croatia 113, 143, 147 current-account (im)balances 25, 31, 88–89, 167–168 customs union, German 9 Cyprus accession 147 bail-out 2, 85–88 entry to euro 112 finances pre-crisis 30 Cyprus Popular Bank (Laiki) 86–88 Czech Republic 113, 118 D Dayton agreement 143 de Gaulle, Charles 9, 22, 96 de Larosière, Jacques 41, 74 Deauville meeting between Sarkozy and Merkel 51–52, 102 debt mutualisation 74, 103, 166–167 defence and security 8, 143, 145 deflation 92 Delors, Jacques 11, 37, 97 Delpla, Jacques 167 democratic accountability 125–129, 162 democratic deficit 121, 129–132, 162–163, 171–172 Denmark European participation 112 justice and home affairs (JHA) 111, 139 ministerial accountability 133 opt-outs 139 referendums 16, 27, 132 shadowing of euro 113 single currency opt-out 110, 115 UK sympathies 119 deposit guarantees 5, 40–41, 74, 77, 91 Deutschmark 10, 12, 16 devaluation, internal 31, 65–66 Dexia 72 Dijsselbloem, Jeroen 24, 87 double majority voting 20, 114 Draghi, Mario 156 appointment as ECB president 23, 68 crisis-management team 2 demand for fiscal compact 64 Long Term Refinancing Operations (LTRO) 68–70 outright monetary transactions (OMT) 78–81 pressure on Berlusconi 59 “whatever it takes” London speech 79 Duisenberg, Wim 23 E e-commerce 137 east–west divide 108 ECB (European Central Bank) bond-buying 47–49, 59–60 crisis-management planning 2, 4 delays 156 European System of Central Banks 22 liquidity provision 40–42, 68–70 outright monetary transactions (OMT) 79–81, 164, 175–176 role and function 22–24, 39–40, 170–171 supervision 6, 99, 175, 195 troika membership 160–161 EcoFin meetings 20, 114 Economic and Financial Committee 20 economic and monetary union (EMU) 11, 112 Economic and Social Committee 21 economic imbalances 30–34 The Economist on ECB responsibilities 15 fictitious memorandum to Angela Merkel 1 ECSC (European Coal and Steel Community) 7–8 EEAS (European External Action Service) 142, 144 EEC (European Economic Community) 8 EFSF (European Financial Stability Facility) 26, 48, 55, 60–61, 81, 194 see also ESM (European Stability Mechanism) EFSM (European Financial Stabilisation Mechanism) 48 Eiffel group 120, 129, 164 elections, European 121, 129–130 Elysée treaty 100 emissions-trading scheme (ETS) 135–136 EMS (European Monetary System) creation of 11 exchange-rate mechanism 16 membership 15 EMU (economic and monetary union) 11, 112 EMU@10 36 energy policies 136 enhanced co-operation 111 enlargement 33, 146–147 environment summits 135 Erdogan, Recep Tayyip 148 ESM (European Stability Mechanism) 194 establishment 26, 55, 80–81 operations 58, 75, 76, 91 Estonia 65, 108 ETS (emissions-trading scheme) 135–136 EU 2020 strategy 137 euro break-up contingency plans 2–3 convergence criteria 14–16, 41, 112, 193 crash danger 47–48 introduction of 4, 18 notes and coins 18 special circumstances 3–4 euro crisis effect on world influence 143–146 errors 155–161 focus of attention 135–141 Euro Plus Pact 55, 195 euro zone 4 economic dangers 175–178 increasing significance of institutions 113–114, 120 performance compared with US 154–155 political dangers 175–178 political integration 125 trust 173 Eurobonds 54, 59, 74, 166–167 Eurogroup of finance ministers 24, 114 European Banking Authority 114, 195 European Central Bank (ECB) bond-buying 47–49, 59–60 crisis-management planning 2, 4 delays 156 European System of Central Banks 22 liquidity provision 40–42, 68–70 outright monetary transactions (OMT) 79–81, 164, 175–176 role and function 22–24, 39–40, 170–171 supervision 6, 99, 175, 195 troika membership 160–161 European Coal and Steel Community (ECSC) 7–8 European Commission commissioners 19, 172 errors 160 future direction 171–172 influence and power 96–97, 99, 119, 125 intrusiveness 127, 140–141 organisation 19 presidency 131, 144 proposals for economic governance 50 European Community 12 European Council 20, 98–99 European Court of Human Rights 21 European Court of Justice 21 European Defence Community 8 European Economic Community (EEC) 8 European External Action Service (EEAS) 142, 144 European Financial Stabilisation Mechanism (EFSM) 48 European Financial Stability Facility (EFSF) 26, 48, 55, 60–61, 81, 194 see also European Stability Mechanism (ESM) European Financial Stability Mechanism 26 see also European Stability Mechanism (ESM) European Investment Bank 21 European Monetary Institute 22 European Monetary System (EMS) creation of 11 exchange-rate mechanism 16 membership 15 European Parliament 20–21, 97–98, 99, 100, 119, 121, 129–132, 171 European People’s Party 117, 127, 130–131 European Political Co-operation 142 European semester 25, 195 European Stability Mechanism (ESM) 194 establishment 26, 55, 80–81 operations 58, 75, 76, 91 European Systemic Risk Board 41 European Union driving forces for monetary union 12–13 expansion 26 historical background 7–12 treaty making 26–28 world influence 140, 142–150 European Union Act (2011) 117, 132 Eurosceptics 13, 123 Finns Party 124 Jobbik 125 League of Catholic Families 125 National Front 124 Party of Freedom (PdL) 124 UK Independence Party (UKIP) 118, 125, 140 excessive deficit procedure 24, 88–89, 194, 195 exchange-rate systems 3, 9–11 exchange rates 164 F Farage, Nigel 98, 118 Federal Deposit Insurance Corporation (FDIC) 77 Federal Reserve (US) 23, 47, 48, 157 federalism 19, 110, 116, 161–165, 168–170, 177–178 financial integration 35–36 financial supervision 195 ECB 6, 99, 175, 195 Jacques de Larosière proposals 41 national 23, 35 single supervisor 76–77, 83–84, 90 Finland accession 26, 111 Finns Party 124 influence 108 ministerial accountability 133 fiscal capacity 84 fiscal compact treaty 25–26, 64–65, 118, 194–195 fiscal policy, focus on 30–31 Five Star Movement 124, 126 fixed exchange-rate systems 3, 9–10 Foot, Michael 116 forecasts, growth 92 foreign policy 142–143 Fouchet plan 22 France credit rating 69, 103 current-account balance 168 EMS exchange-rate mechanism 16 excessive deficit procedure 89 GDP growth 32 and Greece 44 influence 100–104, 142–143 Maastricht deal 12, 16 public debt 159 public opinion of EU 123, 124 single currency views 16–17 unemployment 159 veto of UK entry 115 vote to block European Defence Community 8 freedoms of movement 8, 13 G Gaulle, Charles de 9, 22, 96 Gazprom 136 GDP growth 32 Georgia 149 Germany 2013 elections 90, 106, 125 bond yields 37, 89 Bundesbank 16, 23, 157 constitutional (Karlsruhe) court 45, 95, 128, 158 credit rating 69, 77–78 crisis management errors 155–156 current-account surplus 89, 105, 167–168 demands post Greek bail-out 50–51 economic strengths and weaknesses 14 GDP growth 32 and Greece 44 influence 100–106 Maastricht deal 12, 15–16 national control and accountability 128, 133 parliamentary seats 100 political parties 93, 125 public debt 159 public opinion of EU 123 unemployment 159 unification 16 Zollverein 9 Giscard d’Estaing, Valéry 11, 18, 26, 100 Glienicker group 163, 170 gold standard 9–10 Golden Dawn 124 government spending (worldwide) 4 governments, insolvency of 50 great moderation 31 Greece 2012 election 73, 126 bail-out deal 45–47, 56–58, 65–67, 70, 158 bond yields 37, 61–62 current-account balance 168 debt crisis 42–45 euro membership 18, 112, 115 finances post bail-out 93–94 finances pre-crisis 30, 71 GDP growth 32 potential euro exit 1–5, 81–83 public debt 159, 166 public opinion of EU and euro 113, 123, 124 referendum on bail-out 2, 61–62 unemployment 159 Gros, Daniel 34 H Hague, William 151 Haider, Jörg 127 Hamilton, Alexander 162, 167 Heath, Edward 10, 116 Heisbourg, François 104 Hollande, François 73–74, 89, 103–104, 127 proposed reforms 177 Hungary 41, 113, 126, 147 Hypo Real Estate 41 I Iceland 53, 147 ideological differences 114–115 IKB Deutsche Industriebank 40 immigration 139–140, 146, 147 impossible trinity 13 inter-governmentalism 96, 128, 174 interest rates 93, 164 internal devaluation 31, 65–66 International Monetary Fund (IMF) banking union 74 crisis-management planning 2, 4–5 Cyprus 86–87 errors 160–161 euro zone support 48 Greece 44–46, 56–57, 66, 83, 93–95, 160 Latvia 65 rainy-day funds 169–170 special drawing rights (SDR) 63 Iraq 143 Ireland 89, 110 bail-out 53–54, 56, 57, 89 bank crises 40, 71 bond yields 37, 47, 53, 61, 89 current-account balance 168 finances pre-crisis 30 GDP growth 32 influence 107 opt-outs 111, 139 public debt 159, 166 public opinion of EU 123 referendums 27, 28, 132 unemployment 159 Italy 2013 elections 107, 124, 126 bond yields 37, 61, 89 convergence criteria 17 current-account balance 168 danger of collapse 59 EMS exchange-rate mechanism 16 excessive deficit procedure 89 GDP growth 32 influence 100, 104, 107 interest rates 93 public debt 159, 166 public opinion of EU 123 single currency views 17 unemployment 159 J Jenkins, Roy 11 Jobbik 125 Juncker, Jean-Claude 98, 104, 177 candidate for Commission Presidency 131 EU 2005 budget crisis 28 Eurobonds 54 Eurogroup president 24 justice and home affairs (JHA) 139 K Karamanlis, Kostas 42 Karlsruhe constitutional court 45, 95, 128, 158 Kauder, Volker 105 Kerry, John 144 Kohl, Helmut 12, 18, 100 L labour markets 14, 33–34 Lagarde, Christine 51, 58, 62, 92 Laiki 86–88 Lamers, Karl 111 Lamont, Norman 17 Larosière, Jacques de 41, 74 Latin Monetary Union 9 Latvia 41, 65, 67, 88, 108 Lawson, Nigel 16 League of Catholic Families 125 legislative path 21–22 Lehman Brothers, ECB reaction to collapse 4 Letta, Enrico 107–108 Libya 143, 145 Lipsky, John 57 Lisbon treaty 28, 45, 194 foreign policy 142 institutions 20, 131 justice and home affairs (JHA) 139 subsidiarity 133 voting 20, 114 Lithuania 88, 113, 153 Long Term Refinancing Operations (LTRO) 68–70, 72 Luxembourg 77–78, 100, 108, 169 Luxembourg compromise 97 M Maastricht treaty 11–12, 15, 22, 142, 193 opt-outs and referendums 16, 110–111 MacDougall report (1977) 13, 169 Major, John 12, 111, 116 Malta 100, 112 Maroni, Roberto 34 Mayer, Thomas 1 McCreevy, Charlie 41 MEPs 20–21, 130 Merkel, Angela 2013 re-election 90 banking union 74–77 Cannes G20 summit (2011) 63–64 crisis response 40–41, 44 European constitution 28 fictitious memorandum to 1 future direction 178 power and influence 89, 102–106, 153 Sarkozy collaboration 60, 61–62, 102–103 support for Cyprus 86 support for Greece 5, 45, 49–52, 81–82 support for UK 118–119 union method 22, 128 voter support 125 Messina conference 8, 115 migration 139–140, 146, 147 Miliband, David 144 Mitterrand, François 11, 12, 18, 100 Mody, Ashoka 163 Moldova 149 Monnet, Jean 8, 152 Montebourg, Arnaud 104 Montenegro 147 Monti, Mario 64 influence 70, 75–76, 107 A New Strategy for the Single Market (2010) 137–138 Morocco 146 Morrison, Herbert 8 Morsi, Muhammad 145 Moscovici, Pierre 75 multi-annual financial framework 21, 27, 118 Mundell, Robert 12–13 mutualisation of debt 74, 103, 166–167 N national budgets 89, 125 National Front 124 NATO defence spending targets 145 European security 8 membership 110 Netherlands credit rating 77–78 excessive deficit procedure 89 influence 100, 108 ministerial accountability 133 UK sympathies 119 Nice treaty 194 no-bail-out rule 45, 162, 163–165 north–south divide 33–34, 108 Northern Rock 40 notes and coins 18 Nouy, Danièle 90 Nuland, Victoria 149 O Obama, Barack 63 official sector involvement (OSI) 83 OMT (outright monetary transactions) 79–81, 164, 175–176 Germany’s constitutional court judgment 95, 128 optimal currency-area theory 12–13, 14–15 Orban, Viktor 126 Osborne, George 117, 119 OSI (official sector involvement) 83 outright monetary transactions (OMT) 79–81, 164, 175–176 Germany’s constitutional court judgment 95, 128 P Pact for the Euro see Euro Plus Pact Papaconstantinou, George 43 Papademos, Lucas 64 Papandreou, George 56, 60 election 43 Greek referendum 61–62 resignation 2, 64 Party of Freedom 124 Poland 109, 113 Policy Exchange 1 political parties 124–125, 139–140 political union 10, 12, 133–134 Pompidou, Georges 10 Poos, Jacques 143 Portugal 110 bail-out 54, 57, 89–90 bond yields 37, 47, 53, 61, 89 public opinion of EU and euro 113 power, balance of 99–101 price stability goal of ECB 23 private-sector involvement (PSI) in debt restructuring 51–52 Prodi, Romano 17, 25, 97 Progressive Alliance of Socialists and Democrats (S&D) 130–131 public debt 15, 158–159 see also sovereign debt public opinion of EU and euro 121–124 Putin, Vladimir 149–150 Q qualified-majority voting 13, 20, 99, 121 negative qualified-majority voting 25, 195 quantitative easing (QE) 47, 15 R Rajoy, Mariano 70, 75–76, 127 recapitalisation, bank 58–59, 74–77, 84 redenomination 3–4, 153–154, 175 Reding, Viviane 139 referendums 27, 28, 121–122, 132 REFIT initiative 172 Regling, Klaus 26 Renzi, Matteo 107–108 rescue fund see European Stability Mechanism (ESM) resolution mechanism 90–91, 165, 195 single resolution mechanism (SRM) 195 single supervisory mechanism (SSM) 195 Romania 41, 108, 113, 124, 126, 147 Rome treaty 8, 97, 110, 193 Rösler, Philipp 78 Rueff, Jacques 9 Rumsfeld, Donald 143 Russia, influence on Ukraine 149–150 Rutte, Mark 77 S Samaras, Antonis 2, 78, 82, 93–94 Santer, Jacques 97 Sarkozy, Nicolas crisis response 40–41, 44 economic governance 49–50 European constitution 28 LTROs and the Sarkozy trade 69 Merkel collaboration 51–52, 60, 61–62, 102–103 Schäuble, Wolfgang 62, 75, 84, 90–91, 106, 111, 154 Schengen Agreement 110, 111–112 Schmidt, Helmut 11, 100 Schröder, Gerhard 18, 101, 127 Schulz, Martin 131 Schuman Day 8 Schuman, Robert 7–8 Scotland 112, 178 SDR (special drawing rights) 63 Securities Market Programme (SMP) 48, 79 services directive 34 Shafik, Nemat 65 Sikorski, Radek 109 Simitis, Costas 18 Simms, Brendan 179 single currency benefits 152 club within a club 112 driving forces 12–14 importance of 113 vision for 9 see also euro Single European Act 13, 193 single market 4, 137–138, 174–175 Sinn, Hans-Werner 101 six-pack 25, 50, 195 Slovakia 112 adoption of euro 41 influence 108 Slovenia 88–89, 112 influence 108 SMP (Securities Market Programme) 48, 79 snake in the tunnel 10 Solana, Javier 142 sovereign debt 165–166 see also public debt Spain 110 bail-out 70–73, 89 bank recapitalisation 84 bond yields 37, 89 CDS premiums 72 current-account balance 168 danger of collapse 59 excessive deficit procedure 89 finances pre-crisis 30 GDP growth 32 influence 107 public debt 159 public opinion of EU 123, 124 single currency views 17 unemployment 159 special drawing rights (SDR) 63 stability and growth pact 18, 24, 29, 50–51, 127, 194 Stark, Jürgen 59, 106 Steinbrück, Peer 43 Strauss-Kahn, Dominique 24, 44, 57 stress tests, bank 72, 175 subsidiarity 133, 141 Sweden 109, 111, 112 euro opt-out 18, 115 UK sympathies 119 Syria 145 Syriza 124 T Target II 157 Thatcher, Margaret 27, 110, 116 third energy package 136 Tilford, Simon 34 Tindemans, Leo 111 trade policy 138 Transatlantic Trade and Investment Partnership (TTIP) 138–139 treaty making and change 26–27, 173–174 Treaty of Amsterdam 111–112, 193 Treaty of Lisbon 28, 45, 194 foreign policy 142 institutions 20, 131 justice and home affairs (JHA) 139 subsidiarity 133 voting 20, 114 Treaty of Nice 194 Treaty of Rome 8, 97, 110, 193 Treaty on European Union (Maastricht treaty) 11–12, 15, 22, 142, 193 opt-outs and referendums 16, 110–111 Treaty on Stability, Co-ordination and Governance (TSCG) see fiscal compact treaty Tremonti, Giulio 54, 60 Trichet, Jean-Claude 151, 156 bond-buying 47–48, 52–53 crisis-management planning 2 early warnings 39–40 ECB president 23 IMF 44 Italy 59 True Finns 124 Turkey 132, 147, 148 Tusk, Donald 109, 114 two-pack 25, 89, 195 U UK Independence Party (UKIP) 118, 125, 140 Ukraine 149–150, 179–180 unemployment 158–159, 170 union method 19, 22 United Kingdom current-account balance 168 economic strengths and weaknesses 14 EMS exchange-rate mechanism 16 euro crisis reaction 117–118 euro membership 112 European budget contribution 27–28 European involvement 8, 10, 12, 115–119 future status 174–175 influence 100–101, 106, 109, 142–143 initial application to join EEC 9 opt-outs 110–111, 139 public opinion of EU 123 single currency views 17 United Left party 124 United States abandonment of gold standard 10 federalism model 177 foreign policy 143 performance compared with euro zone 154–155 Urpilainen, Jutta 77 V Van Gend en Loos v Nederlandse Administratie der Belastingen (1963) 21 Van Rompuy, Herman 98 crisis-management planning 3 Cyprus 87 European Council presidency 20, 28 Italy 63 roadmap for integration 74–75, 84, 173 support for Greece 43–45 Venizelos, Evangelos 57, 62 Verhofstadt, Guy 131 Véron, Nicolas 35 Vilnius summit 149 von Weizsäcker, Jakob 166 W Waigel, Theo 17–18 Wall Street flash crash 47 Weber, Axel 49, 56, 106 Weidmann, Jens 40, 80, 82 Weizsäcker, Jakob von 166 Werner report (1971) 10 Wilson, Harold 116 Wolfson Prize 1 World Bank 33 World Trade Organisation 138–139 Y Yanukovych, Viktor 149 Z Zapatero, José Luis Rodríguez 59, 62 Zollverein 9 PublicAffairs is a publishing house founded in 1997.

(eds), The Delphic Oracle on Europe, Oxford University Press, 2011 Tsoukalis, L., The Unhappy State of the European Union, Policy Network, March 2014 Van Middelaar, L., The Passage to Europe, Yale University Press, 2013 Appendix 4 How The Economist saw it at the time May 1st–7th 2010 July 10th–16th 2010 November 20th–26th 2010 December 4th–10th 2010 January 15th–21st 2011 March 12th-18th 2011 June 11th-17th 2011 June 25th-July 1st 2011 October 29th-November 4th 2011 November 5th-11th 2011 November 12th-18th 2011 November 26th-December 2nd 2011 February 18th–24th 2012 March 31st–April 6th 2012 May 19th–25th 2012 May 26th-June 1st 2012 July 28th-August 3rd 2012 August 11th-17th 2012 November 17th-23rd 2012 March 23rd-29th 2013 May 25th–31st 2013 September 14th–20th 2013 October 26th-November 1st 2013 January 4th-10th 2014 Index 1974–75 global recession 10 A accession treaties 112 accountability 125–129, 162 Alliance of Liberals and Democrats for Europe (ALDE) 130–131 Alogoskoufis, George 42 Amsterdam treaty 111–112, 193 Anastasiades, Nicos 2, 86–88 Anglo Irish Bank 53 Ansip, Anders 104 Arab spring 145–146 Argentina 5, 50 Armenia 149 Ashton, Catherine 28, 43, 144 Asmussen, Jörg 51, 82 Austria 111, 127 influence 108 interest rates 93 Azerbaijan 149 Aznar, José Maria 17 B Bagehot, Walter 9 bail-in rules 83, 90–91, 165 see also Cyprus bail-outs national approval requirement 127 no-bail-out rule 45, 162, 163–165 Balkans war 143 Bank of Cyprus 86–87 Bank of England 47, 157 bank recapitalisation 58–59, 74–77, 84 Bankia 72 banking sector characteristics 35 banking supervision see financial supervision banking union 23, 74–75, 77, 83–85, 90–92, 106, 165, 195 see also deposit guarantees; financial supervision Barnier, Michel 41, 138 Barroso, José Manuel early days of crisis 41 European Commission 97, 98, 141, 172 Greece 3, 78 Italy 63 Batista, Paulo Nogueira 46 Belarus 149 Belgium 17, 100, 127 Berlusconi, Silvio euro currency view 151 Italy’s failure to reform 59, 60, 62–63 People of Freedom party (PdL) 107 resignation 64 Black Wednesday 16–17 Blair, Tony 28, 112 BNP Paribas 40 Bolkestein directive 137 bond yields 37, 38, 61, 70, 89 bond spreads 37, 42, 70, 80, 88 Bootle, Roger 1 Bowles, Sharon 98, 129 Brandt, Willy 10 Bretton Woods 9–10 Brown, Gordon 24, 41, 48, 102, 112, 144 Bruegel think-tank 35, 74, 163, 166 budget deficits Maastricht ceiling 15 timescales for meeting targets 88–89 see also stability and growth pact budgets annual, European 21, 27, 118 central 13, 168–170 federal 164, 168 fiscal capacity 84 Bulgaria 108, 113, 124, 126, 147 Bundesbank 16, 23, 157 C Cameron, David 14, 17, 64–65, 117–119, 132, 140 Cannes G20 summit (2011) 62–64 Capital Economics 1 Cassis de Dijon judgment 21 Catalonia 178 CEBS (Committee of European Banking Supervisors) 35 central banks, national 22–23 Centre for European Policy Studies 34 Centre for European Reform 34 CFSP (Common Foreign and Security Policy) 142, 144 China 33, 139, 167 Chirac, Jacques 18, 23, 100, 127 Christofias, Demetris 86 Churchill, Winston 7, 115, 161 Clark, Christopher 178 climate change 135–136 Clinton, Hillary 144 Cockfield, Arthur 13 Committee of European Banking Supervisors (CEBS) 35 Committee of Permanent Representatives (COREPER) 20 Committee of Regions 21 common fisheries policy 100, 138 Common Foreign and Security Policy (CFSP) 142, 144 community method 19, 21–22 Competitiveness Pact see Euro Plus Pact complacency pre-crisis 36–37 Constâncio, Vítor 34 constitution proposals 26–27 convergence criteria 14–16, 41, 112, 193 COREPER (Committee of Permanent Representatives) 20 COSAC (Conference of Community and European Affairs Committees of Parliaments of the European Union) 133 Council of Ministers 20, 121, 130 Council of the European Union see Council of Ministers Court of Auditors 21 Court of First Instance 21 Crafts, Nicholas 9 credit ratings (countries) 69, 77–78, 108 Crimea 150 Croatia 113, 143, 147 current-account (im)balances 25, 31, 88–89, 167–168 customs union, German 9 Cyprus accession 147 bail-out 2, 85–88 entry to euro 112 finances pre-crisis 30 Cyprus Popular Bank (Laiki) 86–88 Czech Republic 113, 118 D Dayton agreement 143 de Gaulle, Charles 9, 22, 96 de Larosière, Jacques 41, 74 Deauville meeting between Sarkozy and Merkel 51–52, 102 debt mutualisation 74, 103, 166–167 defence and security 8, 143, 145 deflation 92 Delors, Jacques 11, 37, 97 Delpla, Jacques 167 democratic accountability 125–129, 162 democratic deficit 121, 129–132, 162–163, 171–172 Denmark European participation 112 justice and home affairs (JHA) 111, 139 ministerial accountability 133 opt-outs 139 referendums 16, 27, 132 shadowing of euro 113 single currency opt-out 110, 115 UK sympathies 119 deposit guarantees 5, 40–41, 74, 77, 91 Deutschmark 10, 12, 16 devaluation, internal 31, 65–66 Dexia 72 Dijsselbloem, Jeroen 24, 87 double majority voting 20, 114 Draghi, Mario 156 appointment as ECB president 23, 68 crisis-management team 2 demand for fiscal compact 64 Long Term Refinancing Operations (LTRO) 68–70 outright monetary transactions (OMT) 78–81 pressure on Berlusconi 59 “whatever it takes” London speech 79 Duisenberg, Wim 23 E e-commerce 137 east–west divide 108 ECB (European Central Bank) bond-buying 47–49, 59–60 crisis-management planning 2, 4 delays 156 European System of Central Banks 22 liquidity provision 40–42, 68–70 outright monetary transactions (OMT) 79–81, 164, 175–176 role and function 22–24, 39–40, 170–171 supervision 6, 99, 175, 195 troika membership 160–161 EcoFin meetings 20, 114 Economic and Financial Committee 20 economic and monetary union (EMU) 11, 112 Economic and Social Committee 21 economic imbalances 30–34 The Economist on ECB responsibilities 15 fictitious memorandum to Angela Merkel 1 ECSC (European Coal and Steel Community) 7–8 EEAS (European External Action Service) 142, 144 EEC (European Economic Community) 8 EFSF (European Financial Stability Facility) 26, 48, 55, 60–61, 81, 194 see also ESM (European Stability Mechanism) EFSM (European Financial Stabilisation Mechanism) 48 Eiffel group 120, 129, 164 elections, European 121, 129–130 Elysée treaty 100 emissions-trading scheme (ETS) 135–136 EMS (European Monetary System) creation of 11 exchange-rate mechanism 16 membership 15 EMU (economic and monetary union) 11, 112 EMU@10 36 energy policies 136 enhanced co-operation 111 enlargement 33, 146–147 environment summits 135 Erdogan, Recep Tayyip 148 ESM (European Stability Mechanism) 194 establishment 26, 55, 80–81 operations 58, 75, 76, 91 Estonia 65, 108 ETS (emissions-trading scheme) 135–136 EU 2020 strategy 137 euro break-up contingency plans 2–3 convergence criteria 14–16, 41, 112, 193 crash danger 47–48 introduction of 4, 18 notes and coins 18 special circumstances 3–4 euro crisis effect on world influence 143–146 errors 155–161 focus of attention 135–141 Euro Plus Pact 55, 195 euro zone 4 economic dangers 175–178 increasing significance of institutions 113–114, 120 performance compared with US 154–155 political dangers 175–178 political integration 125 trust 173 Eurobonds 54, 59, 74, 166–167 Eurogroup of finance ministers 24, 114 European Banking Authority 114, 195 European Central Bank (ECB) bond-buying 47–49, 59–60 crisis-management planning 2, 4 delays 156 European System of Central Banks 22 liquidity provision 40–42, 68–70 outright monetary transactions (OMT) 79–81, 164, 175–176 role and function 22–24, 39–40, 170–171 supervision 6, 99, 175, 195 troika membership 160–161 European Coal and Steel Community (ECSC) 7–8 European Commission commissioners 19, 172 errors 160 future direction 171–172 influence and power 96–97, 99, 119, 125 intrusiveness 127, 140–141 organisation 19 presidency 131, 144 proposals for economic governance 50 European Community 12 European Council 20, 98–99 European Court of Human Rights 21 European Court of Justice 21 European Defence Community 8 European Economic Community (EEC) 8 European External Action Service (EEAS) 142, 144 European Financial Stabilisation Mechanism (EFSM) 48 European Financial Stability Facility (EFSF) 26, 48, 55, 60–61, 81, 194 see also European Stability Mechanism (ESM) European Financial Stability Mechanism 26 see also European Stability Mechanism (ESM) European Investment Bank 21 European Monetary Institute 22 European Monetary System (EMS) creation of 11 exchange-rate mechanism 16 membership 15 European Parliament 20–21, 97–98, 99, 100, 119, 121, 129–132, 171 European People’s Party 117, 127, 130–131 European Political Co-operation 142 European semester 25, 195 European Stability Mechanism (ESM) 194 establishment 26, 55, 80–81 operations 58, 75, 76, 91 European Systemic Risk Board 41 European Union driving forces for monetary union 12–13 expansion 26 historical background 7–12 treaty making 26–28 world influence 140, 142–150 European Union Act (2011) 117, 132 Eurosceptics 13, 123 Finns Party 124 Jobbik 125 League of Catholic Families 125 National Front 124 Party of Freedom (PdL) 124 UK Independence Party (UKIP) 118, 125, 140 excessive deficit procedure 24, 88–89, 194, 195 exchange-rate systems 3, 9–11 exchange rates 164 F Farage, Nigel 98, 118 Federal Deposit Insurance Corporation (FDIC) 77 Federal Reserve (US) 23, 47, 48, 157 federalism 19, 110, 116, 161–165, 168–170, 177–178 financial integration 35–36 financial supervision 195 ECB 6, 99, 175, 195 Jacques de Larosière proposals 41 national 23, 35 single supervisor 76–77, 83–84, 90 Finland accession 26, 111 Finns Party 124 influence 108 ministerial accountability 133 fiscal capacity 84 fiscal compact treaty 25–26, 64–65, 118, 194–195 fiscal policy, focus on 30–31 Five Star Movement 124, 126 fixed exchange-rate systems 3, 9–10 Foot, Michael 116 forecasts, growth 92 foreign policy 142–143 Fouchet plan 22 France credit rating 69, 103 current-account balance 168 EMS exchange-rate mechanism 16 excessive deficit procedure 89 GDP growth 32 and Greece 44 influence 100–104, 142–143 Maastricht deal 12, 16 public debt 159 public opinion of EU 123, 124 single currency views 16–17 unemployment 159 veto of UK entry 115 vote to block European Defence Community 8 freedoms of movement 8, 13 G Gaulle, Charles de 9, 22, 96 Gazprom 136 GDP growth 32 Georgia 149 Germany 2013 elections 90, 106, 125 bond yields 37, 89 Bundesbank 16, 23, 157 constitutional (Karlsruhe) court 45, 95, 128, 158 credit rating 69, 77–78 crisis management errors 155–156 current-account surplus 89, 105, 167–168 demands post Greek bail-out 50–51 economic strengths and weaknesses 14 GDP growth 32 and Greece 44 influence 100–106 Maastricht deal 12, 15–16 national control and accountability 128, 133 parliamentary seats 100 political parties 93, 125 public debt 159 public opinion of EU 123 unemployment 159 unification 16 Zollverein 9 Giscard d’Estaing, Valéry 11, 18, 26, 100 Glienicker group 163, 170 gold standard 9–10 Golden Dawn 124 government spending (worldwide) 4 governments, insolvency of 50 great moderation 31 Greece 2012 election 73, 126 bail-out deal 45–47, 56–58, 65–67, 70, 158 bond yields 37, 61–62 current-account balance 168 debt crisis 42–45 euro membership 18, 112, 115 finances post bail-out 93–94 finances pre-crisis 30, 71 GDP growth 32 potential euro exit 1–5, 81–83 public debt 159, 166 public opinion of EU and euro 113, 123, 124 referendum on bail-out 2, 61–62 unemployment 159 Gros, Daniel 34 H Hague, William 151 Haider, Jörg 127 Hamilton, Alexander 162, 167 Heath, Edward 10, 116 Heisbourg, François 104 Hollande, François 73–74, 89, 103–104, 127 proposed reforms 177 Hungary 41, 113, 126, 147 Hypo Real Estate 41 I Iceland 53, 147 ideological differences 114–115 IKB Deutsche Industriebank 40 immigration 139–140, 146, 147 impossible trinity 13 inter-governmentalism 96, 128, 174 interest rates 93, 164 internal devaluation 31, 65–66 International Monetary Fund (IMF) banking union 74 crisis-management planning 2, 4–5 Cyprus 86–87 errors 160–161 euro zone support 48 Greece 44–46, 56–57, 66, 83, 93–95, 160 Latvia 65 rainy-day funds 169–170 special drawing rights (SDR) 63 Iraq 143 Ireland 89, 110 bail-out 53–54, 56, 57, 89 bank crises 40, 71 bond yields 37, 47, 53, 61, 89 current-account balance 168 finances pre-crisis 30 GDP growth 32 influence 107 opt-outs 111, 139 public debt 159, 166 public opinion of EU 123 referendums 27, 28, 132 unemployment 159 Italy 2013 elections 107, 124, 126 bond yields 37, 61, 89 convergence criteria 17 current-account balance 168 danger of collapse 59 EMS exchange-rate mechanism 16 excessive deficit procedure 89 GDP growth 32 influence 100, 104, 107 interest rates 93 public debt 159, 166 public opinion of EU 123 single currency views 17 unemployment 159 J Jenkins, Roy 11 Jobbik 125 Juncker, Jean-Claude 98, 104, 177 candidate for Commission Presidency 131 EU 2005 budget crisis 28 Eurobonds 54 Eurogroup president 24 justice and home affairs (JHA) 139 K Karamanlis, Kostas 42 Karlsruhe constitutional court 45, 95, 128, 158 Kauder, Volker 105 Kerry, John 144 Kohl, Helmut 12, 18, 100 L labour markets 14, 33–34 Lagarde, Christine 51, 58, 62, 92 Laiki 86–88 Lamers, Karl 111 Lamont, Norman 17 Larosière, Jacques de 41, 74 Latin Monetary Union 9 Latvia 41, 65, 67, 88, 108 Lawson, Nigel 16 League of Catholic Families 125 legislative path 21–22 Lehman Brothers, ECB reaction to collapse 4 Letta, Enrico 107–108 Libya 143, 145 Lipsky, John 57 Lisbon treaty 28, 45, 194 foreign policy 142 institutions 20, 131 justice and home affairs (JHA) 139 subsidiarity 133 voting 20, 114 Lithuania 88, 113, 153 Long Term Refinancing Operations (LTRO) 68–70, 72 Luxembourg 77–78, 100, 108, 169 Luxembourg compromise 97 M Maastricht treaty 11–12, 15, 22, 142, 193 opt-outs and referendums 16, 110–111 MacDougall report (1977) 13, 169 Major, John 12, 111, 116 Malta 100, 112 Maroni, Roberto 34 Mayer, Thomas 1 McCreevy, Charlie 41 MEPs 20–21, 130 Merkel, Angela 2013 re-election 90 banking union 74–77 Cannes G20 summit (2011) 63–64 crisis response 40–41, 44 European constitution 28 fictitious memorandum to 1 future direction 178 power and influence 89, 102–106, 153 Sarkozy collaboration 60, 61–62, 102–103 support for Cyprus 86 support for Greece 5, 45, 49–52, 81–82 support for UK 118–119 union method 22, 128 voter support 125 Messina conference 8, 115 migration 139–140, 146, 147 Miliband, David 144 Mitterrand, François 11, 12, 18, 100 Mody, Ashoka 163 Moldova 149 Monnet, Jean 8, 152 Montebourg, Arnaud 104 Montenegro 147 Monti, Mario 64 influence 70, 75–76, 107 A New Strategy for the Single Market (2010) 137–138 Morocco 146 Morrison, Herbert 8 Morsi, Muhammad 145 Moscovici, Pierre 75 multi-annual financial framework 21, 27, 118 Mundell, Robert 12–13 mutualisation of debt 74, 103, 166–167 N national budgets 89, 125 National Front 124 NATO defence spending targets 145 European security 8 membership 110 Netherlands credit rating 77–78 excessive deficit procedure 89 influence 100, 108 ministerial accountability 133 UK sympathies 119 Nice treaty 194 no-bail-out rule 45, 162, 163–165 north–south divide 33–34, 108 Northern Rock 40 notes and coins 18 Nouy, Danièle 90 Nuland, Victoria 149 O Obama, Barack 63 official sector involvement (OSI) 83 OMT (outright monetary transactions) 79–81, 164, 175–176 Germany’s constitutional court judgment 95, 128 optimal currency-area theory 12–13, 14–15 Orban, Viktor 126 Osborne, George 117, 119 OSI (official sector involvement) 83 outright monetary transactions (OMT) 79–81, 164, 175–176 Germany’s constitutional court judgment 95, 128 P Pact for the Euro see Euro Plus Pact Papaconstantinou, George 43 Papademos, Lucas 64 Papandreou, George 56, 60 election 43 Greek referendum 61–62 resignation 2, 64 Party of Freedom 124 Poland 109, 113 Policy Exchange 1 political parties 124–125, 139–140 political union 10, 12, 133–134 Pompidou, Georges 10 Poos, Jacques 143 Portugal 110 bail-out 54, 57, 89–90 bond yields 37, 47, 53, 61, 89 public opinion of EU and euro 113 power, balance of 99–101 price stability goal of ECB 23 private-sector involvement (PSI) in debt restructuring 51–52 Prodi, Romano 17, 25, 97 Progressive Alliance of Socialists and Democrats (S&D) 130–131 public debt 15, 158–159 see also sovereign debt public opinion of EU and euro 121–124 Putin, Vladimir 149–150 Q qualified-majority voting 13, 20, 99, 121 negative qualified-majority voting 25, 195 quantitative easing (QE) 47, 15 R Rajoy, Mariano 70, 75–76, 127 recapitalisation, bank 58–59, 74–77, 84 redenomination 3–4, 153–154, 175 Reding, Viviane 139 referendums 27, 28, 121–122, 132 REFIT initiative 172 Regling, Klaus 26 Renzi, Matteo 107–108 rescue fund see European Stability Mechanism (ESM) resolution mechanism 90–91, 165, 195 single resolution mechanism (SRM) 195 single supervisory mechanism (SSM) 195 Romania 41, 108, 113, 124, 126, 147 Rome treaty 8, 97, 110, 193 Rösler, Philipp 78 Rueff, Jacques 9 Rumsfeld, Donald 143 Russia, influence on Ukraine 149–150 Rutte, Mark 77 S Samaras, Antonis 2, 78, 82, 93–94 Santer, Jacques 97 Sarkozy, Nicolas crisis response 40–41, 44 economic governance 49–50 European constitution 28 LTROs and the Sarkozy trade 69 Merkel collaboration 51–52, 60, 61–62, 102–103 Schäuble, Wolfgang 62, 75, 84, 90–91, 106, 111, 154 Schengen Agreement 110, 111–112 Schmidt, Helmut 11, 100 Schröder, Gerhard 18, 101, 127 Schulz, Martin 131 Schuman Day 8 Schuman, Robert 7–8 Scotland 112, 178 SDR (special drawing rights) 63 Securities Market Programme (SMP) 48, 79 services directive 34 Shafik, Nemat 65 Sikorski, Radek 109 Simitis, Costas 18 Simms, Brendan 179 single currency benefits 152 club within a club 112 driving forces 12–14 importance of 113 vision for 9 see also euro Single European Act 13, 193 single market 4, 137–138, 174–175 Sinn, Hans-Werner 101 six-pack 25, 50, 195 Slovakia 112 adoption of euro 41 influence 108 Slovenia 88–89, 112 influence 108 SMP (Securities Market Programme) 48, 79 snake in the tunnel 10 Solana, Javier 142 sovereign debt 165–166 see also public debt Spain 110 bail-out 70–73, 89 bank recapitalisation 84 bond yields 37, 89 CDS premiums 72 current-account balance 168 danger of collapse 59 excessive deficit procedure 89 finances pre-crisis 30 GDP growth 32 influence 107 public debt 159 public opinion of EU 123, 124 single currency views 17 unemployment 159 special drawing rights (SDR) 63 stability and growth pact 18, 24, 29, 50–51, 127, 194 Stark, Jürgen 59, 106 Steinbrück, Peer 43 Strauss-Kahn, Dominique 24, 44, 57 stress tests, bank 72, 175 subsidiarity 133, 141 Sweden 109, 111, 112 euro opt-out 18, 115 UK sympathies 119 Syria 145 Syriza 124 T Target II 157 Thatcher, Margaret 27, 110, 116 third energy package 136 Tilford, Simon 34 Tindemans, Leo 111 trade policy 138 Transatlantic Trade and Investment Partnership (TTIP) 138–139 treaty making and change 26–27, 173–174 Treaty of Amsterdam 111–112, 193 Treaty of Lisbon 28, 45, 194 foreign policy 142 institutions 20, 131 justice and home affairs (JHA) 139 subsidiarity 133 voting 20, 114 Treaty of Nice 194 Treaty of Rome 8, 97, 110, 193 Treaty on European Union (Maastricht treaty) 11–12, 15, 22, 142, 193 opt-outs and referendums 16, 110–111 Treaty on Stability, Co-ordination and Governance (TSCG) see fiscal compact treaty Tremonti, Giulio 54, 60 Trichet, Jean-Claude 151, 156 bond-buying 47–48, 52–53 crisis-management planning 2 early warnings 39–40 ECB president 23 IMF 44 Italy 59 True Finns 124 Turkey 132, 147, 148 Tusk, Donald 109, 114 two-pack 25, 89, 195 U UK Independence Party (UKIP) 118, 125, 140 Ukraine 149–150, 179–180 unemployment 158–159, 170 union method 19, 22 United Kingdom current-account balance 168 economic strengths and weaknesses 14 EMS exchange-rate mechanism 16 euro crisis reaction 117–118 euro membership 112 European budget contribution 27–28 European involvement 8, 10, 12, 115–119 future status 174–175 influence 100–101, 106, 109, 142–143 initial application to join EEC 9 opt-outs 110–111, 139 public opinion of EU 123 single currency views 17 United Left party 124 United States abandonment of gold standard 10 federalism model 177 foreign policy 143 performance compared with euro zone 154–155 Urpilainen, Jutta 77 V Van Gend en Loos v Nederlandse Administratie der Belastingen (1963) 21 Van Rompuy, Herman 98 crisis-management planning 3 Cyprus 87 European Council presidency 20, 28 Italy 63 roadmap for integration 74–75, 84, 173 support for Greece 43–45 Venizelos, Evangelos 57, 62 Verhofstadt, Guy 131 Véron, Nicolas 35 Vilnius summit 149 von Weizsäcker, Jakob 166 W Waigel, Theo 17–18 Wall Street flash crash 47 Weber, Axel 49, 56, 106 Weidmann, Jens 40, 80, 82 Weizsäcker, Jakob von 166 Werner report (1971) 10 Wilson, Harold 116 Wolfson Prize 1 World Bank 33 World Trade Organisation 138–139 Y Yanukovych, Viktor 149 Z Zapatero, José Luis Rodríguez 59, 62 Zollverein 9 PublicAffairs is a publishing house founded in 1997.

(eds), The Delphic Oracle on Europe, Oxford University Press, 2011 Tsoukalis, L., The Unhappy State of the European Union, Policy Network, March 2014 Van Middelaar, L., The Passage to Europe, Yale University Press, 2013 Appendix 4 How The Economist saw it at the time May 1st–7th 2010 July 10th–16th 2010 November 20th–26th 2010 December 4th–10th 2010 January 15th–21st 2011 March 12th-18th 2011 June 11th-17th 2011 June 25th-July 1st 2011 October 29th-November 4th 2011 November 5th-11th 2011 November 12th-18th 2011 November 26th-December 2nd 2011 February 18th–24th 2012 March 31st–April 6th 2012 May 19th–25th 2012 May 26th-June 1st 2012 July 28th-August 3rd 2012 August 11th-17th 2012 November 17th-23rd 2012 March 23rd-29th 2013 May 25th–31st 2013 September 14th–20th 2013 October 26th-November 1st 2013 January 4th-10th 2014 Index 1974–75 global recession 10 A accession treaties 112 accountability 125–129, 162 Alliance of Liberals and Democrats for Europe (ALDE) 130–131 Alogoskoufis, George 42 Amsterdam treaty 111–112, 193 Anastasiades, Nicos 2, 86–88 Anglo Irish Bank 53 Ansip, Anders 104 Arab spring 145–146 Argentina 5, 50 Armenia 149 Ashton, Catherine 28, 43, 144 Asmussen, Jörg 51, 82 Austria 111, 127 influence 108 interest rates 93 Azerbaijan 149 Aznar, José Maria 17 B Bagehot, Walter 9 bail-in rules 83, 90–91, 165 see also Cyprus bail-outs national approval requirement 127 no-bail-out rule 45, 162, 163–165 Balkans war 143 Bank of Cyprus 86–87 Bank of England 47, 157 bank recapitalisation 58–59, 74–77, 84 Bankia 72 banking sector characteristics 35 banking supervision see financial supervision banking union 23, 74–75, 77, 83–85, 90–92, 106, 165, 195 see also deposit guarantees; financial supervision Barnier, Michel 41, 138 Barroso, José Manuel early days of crisis 41 European Commission 97, 98, 141, 172 Greece 3, 78 Italy 63 Batista, Paulo Nogueira 46 Belarus 149 Belgium 17, 100, 127 Berlusconi, Silvio euro currency view 151 Italy’s failure to reform 59, 60, 62–63 People of Freedom party (PdL) 107 resignation 64 Black Wednesday 16–17 Blair, Tony 28, 112 BNP Paribas 40 Bolkestein directive 137 bond yields 37, 38, 61, 70, 89 bond spreads 37, 42, 70, 80, 88 Bootle, Roger 1 Bowles, Sharon 98, 129 Brandt, Willy 10 Bretton Woods 9–10 Brown, Gordon 24, 41, 48, 102, 112, 144 Bruegel think-tank 35, 74, 163, 166 budget deficits Maastricht ceiling 15 timescales for meeting targets 88–89 see also stability and growth pact budgets annual, European 21, 27, 118 central 13, 168–170 federal 164, 168 fiscal capacity 84 Bulgaria 108, 113, 124, 126, 147 Bundesbank 16, 23, 157 C Cameron, David 14, 17, 64–65, 117–119, 132, 140 Cannes G20 summit (2011) 62–64 Capital Economics 1 Cassis de Dijon judgment 21 Catalonia 178 CEBS (Committee of European Banking Supervisors) 35 central banks, national 22–23 Centre for European Policy Studies 34 Centre for European Reform 34 CFSP (Common Foreign and Security Policy) 142, 144 China 33, 139, 167 Chirac, Jacques 18, 23, 100, 127 Christofias, Demetris 86 Churchill, Winston 7, 115, 161 Clark, Christopher 178 climate change 135–136 Clinton, Hillary 144 Cockfield, Arthur 13 Committee of European Banking Supervisors (CEBS) 35 Committee of Permanent Representatives (COREPER) 20 Committee of Regions 21 common fisheries policy 100, 138 Common Foreign and Security Policy (CFSP) 142, 144 community method 19, 21–22 Competitiveness Pact see Euro Plus Pact complacency pre-crisis 36–37 Constâncio, Vítor 34 constitution proposals 26–27 convergence criteria 14–16, 41, 112, 193 COREPER (Committee of Permanent Representatives) 20 COSAC (Conference of Community and European Affairs Committees of Parliaments of the European Union) 133 Council of Ministers 20, 121, 130 Council of the European Union see Council of Ministers Court of Auditors 21 Court of First Instance 21 Crafts, Nicholas 9 credit ratings (countries) 69, 77–78, 108 Crimea 150 Croatia 113, 143, 147 current-account (im)balances 25, 31, 88–89, 167–168 customs union, German 9 Cyprus accession 147 bail-out 2, 85–88 entry to euro 112 finances pre-crisis 30 Cyprus Popular Bank (Laiki) 86–88 Czech Republic 113, 118 D Dayton agreement 143 de Gaulle, Charles 9, 22, 96 de Larosière, Jacques 41, 74 Deauville meeting between Sarkozy and Merkel 51–52, 102 debt mutualisation 74, 103, 166–167 defence and security 8, 143, 145 deflation 92 Delors, Jacques 11, 37, 97 Delpla, Jacques 167 democratic accountability 125–129, 162 democratic deficit 121, 129–132, 162–163, 171–172 Denmark European participation 112 justice and home affairs (JHA) 111, 139 ministerial accountability 133 opt-outs 139 referendums 16, 27, 132 shadowing of euro 113 single currency opt-out 110, 115 UK sympathies 119 deposit guarantees 5, 40–41, 74, 77, 91 Deutschmark 10, 12, 16 devaluation, internal 31, 65–66 Dexia 72 Dijsselbloem, Jeroen 24, 87 double majority voting 20, 114 Draghi, Mario 156 appointment as ECB president 23, 68 crisis-management team 2 demand for fiscal compact 64 Long Term Refinancing Operations (LTRO) 68–70 outright monetary transactions (OMT) 78–81 pressure on Berlusconi 59 “whatever it takes” London speech 79 Duisenberg, Wim 23 E e-commerce 137 east–west divide 108 ECB (European Central Bank) bond-buying 47–49, 59–60 crisis-management planning 2, 4 delays 156 European System of Central Banks 22 liquidity provision 40–42, 68–70 outright monetary transactions (OMT) 79–81, 164, 175–176 role and function 22–24, 39–40, 170–171 supervision 6, 99, 175, 195 troika membership 160–161 EcoFin meetings 20, 114 Economic and Financial Committee 20 economic and monetary union (EMU) 11, 112 Economic and Social Committee 21 economic imbalances 30–34 The Economist on ECB responsibilities 15 fictitious memorandum to Angela Merkel 1 ECSC (European Coal and Steel Community) 7–8 EEAS (European External Action Service) 142, 144 EEC (European Economic Community) 8 EFSF (European Financial Stability Facility) 26, 48, 55, 60–61, 81, 194 see also ESM (European Stability Mechanism) EFSM (European Financial Stabilisation Mechanism) 48 Eiffel group 120, 129, 164 elections, European 121, 129–130 Elysée treaty 100 emissions-trading scheme (ETS) 135–136 EMS (European Monetary System) creation of 11 exchange-rate mechanism 16 membership 15 EMU (economic and monetary union) 11, 112 EMU@10 36 energy policies 136 enhanced co-operation 111 enlargement 33, 146–147 environment summits 135 Erdogan, Recep Tayyip 148 ESM (European Stability Mechanism) 194 establishment 26, 55, 80–81 operations 58, 75, 76, 91 Estonia 65, 108 ETS (emissions-trading scheme) 135–136 EU 2020 strategy 137 euro break-up contingency plans 2–3 convergence criteria 14–16, 41, 112, 193 crash danger 47–48 introduction of 4, 18 notes and coins 18 special circumstances 3–4 euro crisis effect on world influence 143–146 errors 155–161 focus of attention 135–141 Euro Plus Pact 55, 195 euro zone 4 economic dangers 175–178 increasing significance of institutions 113–114, 120 performance compared with US 154–155 political dangers 175–178 political integration 125 trust 173 Eurobonds 54, 59, 74, 166–167 Eurogroup of finance ministers 24, 114 European Banking Authority 114, 195 European Central Bank (ECB) bond-buying 47–49, 59–60 crisis-management planning 2, 4 delays 156 European System of Central Banks 22 liquidity provision 40–42, 68–70 outright monetary transactions (OMT) 79–81, 164, 175–176 role and function 22–24, 39–40, 170–171 supervision 6, 99, 175, 195 troika membership 160–161 European Coal and Steel Community (ECSC) 7–8 European Commission commissioners 19, 172 errors 160 future direction 171–172 influence and power 96–97, 99, 119, 125 intrusiveness 127, 140–141 organisation 19 presidency 131, 144 proposals for economic governance 50 European Community 12 European Council 20, 98–99 European Court of Human Rights 21 European Court of Justice 21 European Defence Community 8 European Economic Community (EEC) 8 European External Action Service (EEAS) 142, 144 European Financial Stabilisation Mechanism (EFSM) 48 European Financial Stability Facility (EFSF) 26, 48, 55, 60–61, 81, 194 see also European Stability Mechanism (ESM) European Financial Stability Mechanism 26 see also European Stability Mechanism (ESM) European Investment Bank 21 European Monetary Institute 22 European Monetary System (EMS) creation of 11 exchange-rate mechanism 16 membership 15 European Parliament 20–21, 97–98, 99, 100, 119, 121, 129–132, 171 European People’s Party 117, 127, 130–131 European Political Co-operation 142 European semester 25, 195 European Stability Mechanism (ESM) 194 establishment 26, 55, 80–81 operations 58, 75, 76, 91 European Systemic Risk Board 41 European Union driving forces for monetary union 12–13 expansion 26 historical background 7–12 treaty making 26–28 world influence 140, 142–150 European Union Act (2011) 117, 132 Eurosceptics 13, 123 Finns Party 124 Jobbik 125 League of Catholic Families 125 National Front 124 Party of Freedom (PdL) 124 UK Independence Party (UKIP) 118, 125, 140 excessive deficit procedure 24, 88–89, 194, 195 exchange-rate systems 3, 9–11 exchange rates 164 F Farage, Nigel 98, 118 Federal Deposit Insurance Corporation (FDIC) 77 Federal Reserve (US) 23, 47, 48, 157 federalism 19, 110, 116, 161–165, 168–170, 177–178 financial integration 35–36 financial supervision 195 ECB 6, 99, 175, 195 Jacques de Larosière proposals 41 national 23, 35 single supervisor 76–77, 83–84, 90 Finland accession 26, 111 Finns Party 124 influence 108 ministerial accountability 133 fiscal capacity 84 fiscal compact treaty 25–26, 64–65, 118, 194–195 fiscal policy, focus on 30–31 Five Star Movement 124, 126 fixed exchange-rate systems 3, 9–10 Foot, Michael 116 forecasts, growth 92 foreign policy 142–143 Fouchet plan 22 France credit rating 69, 103 current-account balance 168 EMS exchange-rate mechanism 16 excessive deficit procedure 89 GDP growth 32 and Greece 44 influence 100–104, 142–143 Maastricht deal 12, 16 public debt 159 public opinion of EU 123, 124 single currency views 16–17 unemployment 159 veto of UK entry 115 vote to block European Defence Community 8 freedoms of movement 8, 13 G Gaulle, Charles de 9, 22, 96 Gazprom 136 GDP growth 32 Georgia 149 Germany 2013 elections 90, 106, 125 bond yields 37, 89 Bundesbank 16, 23, 157 constitutional (Karlsruhe) court 45, 95, 128, 158 credit rating 69, 77–78 crisis management errors 155–156 current-account surplus 89, 105, 167–168 demands post Greek bail-out 50–51 economic strengths and weaknesses 14 GDP growth 32 and Greece 44 influence 100–106 Maastricht deal 12, 15–16 national control and accountability 128, 133 parliamentary seats 100 political parties 93, 125 public debt 159 public opinion of EU 123 unemployment 159 unification 16 Zollverein 9 Giscard d’Estaing, Valéry 11, 18, 26, 100 Glienicker group 163, 170 gold standard 9–10 Golden Dawn 124 government spending (worldwide) 4 governments, insolvency of 50 great moderation 31 Greece 2012 election 73, 126 bail-out deal 45–47, 56–58, 65–67, 70, 158 bond yields 37, 61–62 current-account balance 168 debt crisis 42–45 euro membership 18, 112, 115 finances post bail-out 93–94 finances pre-crisis 30, 71 GDP growth 32 potential euro exit 1–5, 81–83 public debt 159, 166 public opinion of EU and euro 113, 123, 124 referendum on bail-out 2, 61–62 unemployment 159 Gros, Daniel 34 H Hague, William 151 Haider, Jörg 127 Hamilton, Alexander 162, 167 Heath, Edward 10, 116 Heisbourg, François 104 Hollande, François 73–74, 89, 103–104, 127 proposed reforms 177 Hungary 41, 113, 126, 147 Hypo Real Estate 41 I Iceland 53, 147 ideological differences 114–115 IKB Deutsche Industriebank 40 immigration 139–140, 146, 147 impossible trinity 13 inter-governmentalism 96, 128, 174 interest rates 93, 164 internal devaluation 31, 65–66 International Monetary Fund (IMF) banking union 74 crisis-management planning 2, 4–5 Cyprus 86–87 errors 160–161 euro zone support 48 Greece 44–46, 56–57, 66, 83, 93–95, 160 Latvia 65 rainy-day funds 169–170 special drawing rights (SDR) 63 Iraq 143 Ireland 89, 110 bail-out 53–54, 56, 57, 89 bank crises 40, 71 bond yields 37, 47, 53, 61, 89 current-account balance 168 finances pre-crisis 30 GDP growth 32 influence 107 opt-outs 111, 139 public debt 159, 166 public opinion of EU 123 referendums 27, 28, 132 unemployment 159 Italy 2013 elections 107, 124, 126 bond yields 37, 61, 89 convergence criteria 17 current-account balance 168 danger of collapse 59 EMS exchange-rate mechanism 16 excessive deficit procedure 89 GDP growth 32 influence 100, 104, 107 interest rates 93 public debt 159, 166 public opinion of EU 123 single currency views 17 unemployment 159 J Jenkins, Roy 11 Jobbik 125 Juncker, Jean-Claude 98, 104, 177 candidate for Commission Presidency 131 EU 2005 budget crisis 28 Eurobonds 54 Eurogroup president 24 justice and home affairs (JHA) 139 K Karamanlis, Kostas 42 Karlsruhe constitutional court 45, 95, 128, 158 Kauder, Volker 105 Kerry, John 144 Kohl, Helmut 12, 18, 100 L labour markets 14, 33–34 Lagarde, Christine 51, 58, 62, 92 Laiki 86–88 Lamers, Karl 111 Lamont, Norman 17 Larosière, Jacques de 41, 74 Latin Monetary Union 9 Latvia 41, 65, 67, 88, 108 Lawson, Nigel 16 League of Catholic Families 125 legislative path 21–22 Lehman Brothers, ECB reaction to collapse 4 Letta, Enrico 107–108 Libya 143, 145 Lipsky, John 57 Lisbon treaty 28, 45, 194 foreign policy 142 institutions 20, 131 justice and home affairs (JHA) 139 subsidiarity 133 voting 20, 114 Lithuania 88, 113, 153 Long Term Refinancing Operations (LTRO) 68–70, 72 Luxembourg 77–78, 100, 108, 169 Luxembourg compromise 97 M Maastricht treaty 11–12, 15, 22, 142, 193 opt-outs and referendums 16, 110–111 MacDougall report (1977) 13, 169 Major, John 12, 111, 116 Malta 100, 112 Maroni, Roberto 34 Mayer, Thomas 1 McCreevy, Charlie 41 MEPs 20–21, 130 Merkel, Angela 2013 re-election 90 banking union 74–77 Cannes G20 summit (2011) 63–64 crisis response 40–41, 44 European constitution 28 fictitious memorandum to 1 future direction 178 power and influence 89, 102–106, 153 Sarkozy collaboration 60, 61–62, 102–103 support for Cyprus 86 support for Greece 5, 45, 49–52, 81–82 support for UK 118–119 union method 22, 128 voter support 125 Messina conference 8, 115 migration 139–140, 146, 147 Miliband, David 144 Mitterrand, François 11, 12, 18, 100 Mody, Ashoka 163 Moldova 149 Monnet, Jean 8, 152 Montebourg, Arnaud 104 Montenegro 147 Monti, Mario 64 influence 70, 75–76, 107 A New Strategy for the Single Market (2010) 137–138 Morocco 146 Morrison, Herbert 8 Morsi, Muhammad 145 Moscovici, Pierre 75 multi-annual financial framework 21, 27, 118 Mundell, Robert 12–13 mutualisation of debt 74, 103, 166–167 N national budgets 89, 125 National Front 124 NATO defence spending targets 145 European security 8 membership 110 Netherlands credit rating 77–78 excessive deficit procedure 89 influence 100, 108 ministerial accountability 133 UK sympathies 119 Nice treaty 194 no-bail-out rule 45, 162, 163–165 north–south divide 33–34, 108 Northern Rock 40 notes and coins 18 Nouy, Danièle 90 Nuland, Victoria 149 O Obama, Barack 63 official sector involvement (OSI) 83 OMT (outright monetary transactions) 79–81, 164, 175–176 Germany’s constitutional court judgment 95, 128 optimal currency-area theory 12–13, 14–15 Orban, Viktor 126 Osborne, George 117, 119 OSI (official sector involvement) 83 outright monetary transactions (OMT) 79–81, 164, 175–176 Germany’s constitutional court judgment 95, 128 P Pact for the Euro see Euro Plus Pact Papaconstantinou, George 43 Papademos, Lucas 64 Papandreou, George 56, 60 election 43 Greek referendum 61–62 resignation 2, 64 Party of Freedom 124 Poland 109, 113 Policy Exchange 1 political parties 124–125, 139–140 political union 10, 12, 133–134 Pompidou, Georges 10 Poos, Jacques 143 Portugal 110 bail-out 54, 57, 89–90 bond yields 37, 47, 53, 61, 89 public opinion of EU and euro 113 power, balance of 99–101 price stability goal of ECB 23 private-sector involvement (PSI) in debt restructuring 51–52 Prodi, Romano 17, 25, 97 Progressive Alliance of Socialists and Democrats (S&D) 130–131 public debt 15, 158–159 see also sovereign debt public opinion of EU and euro 121–124 Putin, Vladimir 149–150 Q qualified-majority voting 13, 20, 99, 121 negative qualified-majority voting 25, 195 quantitative easing (QE) 47, 15 R Rajoy, Mariano 70, 75–76, 127 recapitalisation, bank 58–59, 74–77, 84 redenomination 3–4, 153–154, 175 Reding, Viviane 139 referendums 27, 28, 121–122, 132 REFIT initiative 172 Regling, Klaus 26 Renzi, Matteo 107–108 rescue fund see European Stability Mechanism (ESM) resolution mechanism 90–91, 165, 195 single resolution mechanism (SRM) 195 single supervisory mechanism (SSM) 195 Romania 41, 108, 113, 124, 126, 147 Rome treaty 8, 97, 110, 193 Rösler, Philipp 78 Rueff, Jacques 9 Rumsfeld, Donald 143 Russia, influence on Ukraine 149–150 Rutte, Mark 77 S Samaras, Antonis 2, 78, 82, 93–94 Santer, Jacques 97 Sarkozy, Nicolas crisis response 40–41, 44 economic governance 49–50 European constitution 28 LTROs and the Sarkozy trade 69 Merkel collaboration 51–52, 60, 61–62, 102–103 Schäuble, Wolfgang 62, 75, 84, 90–91, 106, 111, 154 Schengen Agreement 110, 111–112 Schmidt, Helmut 11, 100 Schröder, Gerhard 18, 101, 127 Schulz, Martin 131 Schuman Day 8 Schuman, Robert 7–8 Scotland 112, 178 SDR (special drawing rights) 63 Securities Market Programme (SMP) 48, 79 services directive 34 Shafik, Nemat 65 Sikorski, Radek 109 Simitis, Costas 18 Simms, Brendan 179 single currency benefits 152 club within a club 112 driving forces 12–14 importance of 113 vision for 9 see also euro Single European Act 13, 193 single market 4, 137–138, 174–175 Sinn, Hans-Werner 101 six-pack 25, 50, 195 Slovakia 112 adoption of euro 41 influence 108 Slovenia 88–89, 112 influence 108 SMP (Securities Market Programme) 48, 79 snake in the tunnel 10 Solana, Javier 142 sovereign debt 165–166 see also public debt Spain 110 bail-out 70–73, 89 bank recapitalisation 84 bond yields 37, 89 CDS premiums 72 current-account balance 168 danger of collapse 59 excessive deficit procedure 89 finances pre-crisis 30 GDP growth 32 influence 107 public debt 159 public opinion of EU 123, 124 single currency views 17 unemployment 159 special drawing rights (SDR) 63 stability and growth pact 18, 24, 29, 50–51, 127, 194 Stark, Jürgen 59, 106 Steinbrück, Peer 43 Strauss-Kahn, Dominique 24, 44, 57 stress tests, bank 72, 175 subsidiarity 133, 141 Sweden 109, 111, 112 euro opt-out 18, 115 UK sympathies 119 Syria 145 Syriza 124 T Target II 157 Thatcher, Margaret 27, 110, 116 third energy package 136 Tilford, Simon 34 Tindemans, Leo 111 trade policy 138 Transatlantic Trade and Investment Partnership (TTIP) 138–139 treaty making and change 26–27, 173–174 Treaty of Amsterdam 111–112, 193 Treaty of Lisbon 28, 45, 194 foreign policy 142 institutions 20, 131 justice and home affairs (JHA) 139 subsidiarity 133 voting 20, 114 Treaty of Nice 194 Treaty of Rome 8, 97, 110, 193 Treaty on European Union (Maastricht treaty) 11–12, 15, 22, 142, 193 opt-outs and referendums 16, 110–111 Treaty on Stability, Co-ordination and Governance (TSCG) see fiscal compact treaty Tremonti, Giulio 54, 60 Trichet, Jean-Claude 151, 156 bond-buying 47–48, 52–53 crisis-management planning 2 early warnings 39–40 ECB president 23 IMF 44 Italy 59 True Finns 124 Turkey 132, 147, 148 Tusk, Donald 109, 114 two-pack 25, 89, 195 U UK Independence Party (UKIP) 118, 125, 140 Ukraine 149–150, 179–180 unemployment 158–159, 170 union method 19, 22 United Kingdom current-account balance 168 economic strengths and weaknesses 14 EMS exchange-rate mechanism 16 euro crisis reaction 117–118 euro membership 112 European budget contribution 27–28 European involvement 8, 10, 12, 115–119 future status 174–175 influence 100–101, 106, 109, 142–143 initial application to join EEC 9 opt-outs 110–111, 139 public opinion of EU 123 single currency views 17 United Left party 124 United States abandonment of gold standard 10 federalism model 177 foreign policy 143 performance compared with euro zone 154–155 Urpilainen, Jutta 77 V Van Gend en Loos v Nederlandse Administratie der Belastingen (1963) 21 Van Rompuy, Herman 98 crisis-management planning 3 Cyprus 87 European Council presidency 20, 28 Italy 63 roadmap for integration 74–75, 84, 173 support for Greece 43–45 Venizelos, Evangelos 57, 62 Verhofstadt, Guy 131 Véron, Nicolas 35 Vilnius summit 149 von Weizsäcker, Jakob 166 W Waigel, Theo 17–18 Wall Street flash crash 47 Weber, Axel 49, 56, 106 Weidmann, Jens 40, 80, 82 Weizsäcker, Jakob von 166 Werner report (1971) 10 Wilson, Harold 116 Wolfson Prize 1 World Bank 33 World Trade Organisation 138–139 Y Yanukovych, Viktor 149 Z Zapatero, José Luis Rodríguez 59, 62 Zollverein 9 PublicAffairs is a publishing house founded in 1997.

pages: 311 words: 90,172

Nothing but Net: 10 Timeless Stock-Picking Lessons From One of Wall Street’s Top Tech Analysts
by Mark Mahaney
Published 9 Nov 2021

A growth rate of 20% on a $1 billion revenue base requires adding $200 million in new revenue. A growth rate of 20% on a $162 billion revenue base requires adding $32 billion in new revenue, which is more than the GDP of 100 different countries on this planet. Another way to think about it is that in most years, global GDP growth is in the 2–5% range. So 20% revenue growth implies growth 4x to 10x faster than the global economy. I’ve made the point. A growth rate of 20% is impressive. And Google consistently reported that. Until it didn’t. In the March quarter of 2019. Which led to a sizable 20% correction from April 29 ($1,296) to June 3 ($1,039).

Despite fundamentals that were at times dramatically better than those of other tech stocks—and 95%+ of the S&P 500—these stocks experienced major setbacks, before recovering to continue to materially outperform the market. Even best-in-class stocks aren’t immune from broad market sell-offs. In late 2018, in the wake of a broad market correction tied to trade war concerns, global GDP growth, and rising interest rates, AMZN lost a third of its value, despite no change in its estimates or growth outlook. Be ready to endure material pullbacks, even with best-in-class companies and stocks. There will be blood, for reasons that can sometimes be totally out of the control of specific companies.

TABLE 4.4 The Drivers of the PCLN 100-Bagger Move What comes though so clearly from the table is how exceptional Priceline’s top-line growth and customer metrics were for so long. Over this 14-year period, Priceline averaged almost 40% bookings growth each and every year. That growth is something like 10x that of global GDP growth and something like 8x that of global travel growth. That growth was utterly extraordinary, and it drove stock price performance that was utterly extraordinary. Yes, there were other factors that drove that extraordinary stock price performance. Two in particular. First, throughout that time Priceline was a consistently highly profitable company, averaging close to 30% EBITDA margins over that 14-year period.

pages: 470 words: 148,730

Good Economics for Hard Times: Better Answers to Our Biggest Problems
by Abhijit V. Banerjee and Esther Duflo
Published 12 Nov 2019

This would surely translate into a new era of productivity growth that would pull the economy with it. And indeed it finally happened. Starting in 1995, we saw a few years of high TFP growth (though still significantly less than in the go-go years). It faded quickly, however. Since 2004, TFP growth and GDP growth both in the United States and in Europe seem to be back to the bad days of 1973–1994.11 In the United States, GDP growth did pick up in mid-2018, but TFP growth remains slow. Over the year, TFP grew only at an average of 0.94 percent,12 compared to the 1.89 percent achieved during the 1920–1970 period. This new slowdown has provoked a lively debate among economists.

He said he had reached two of his goals, but he never said which two, although he is reported to have said that there were too many fine horsemen in Austria for him to succeed in all his aspirations.” See https://en.wikipedia.org/wiki/Joseph_Schumpeter. 51 Philippe Aghion and Peter Howitt, “A Model of Growth Through Creative Destruction,” Econometrica 60, no. 2 (1992): 323–51. 52 ‘Real GDP Growth,” US Budget and Economy, http://usbudget.blog spot.fr/2009/02/real-gdp-growth.html. 53 David Leonardt, “Do Tax Cuts Lead to Economic Growth?,” New York Times, September 15, 2012, https://nyti.ms/2mBjewo. 54 Thomas Piketty, Emmanuel Saez, and Stefanie Stantcheva, “Optimal Taxation of Top Labor Incomes: A Tale of Three Elasticities,” American Economic Journal: Economic Policy 6, no. 1 (2014): 230–71, https://doi.org/10.1257/pol.6.1.230. 55 William Gale, “The Kansas Tax Cut Experiment,” Brookings Institution, 2017, https://www.brookings.edu/blog/unpacked/2017/07/11/the-kansas-tax-cut-experiment/. 56 Owen Zidar, “Tax Cuts for Whom?

The import and export licensing regime was abolished, and import duties came down very quickly from an average of nearly 90 percent to something closer to 35 percent, in part because many of the leading figures in the economic ministries had long desired a chance to do something like this, and they were not going to let the opportunity pass.11 There were, unsurprisingly, many who predicted this would lead to disaster. Indian industry, raised behind high tariff walls, was too inefficient to compete with the rest of the world’s powerhouses. The Indian consumer, starved of imports, would go on a binge and bankrupt the economy. And so on. Remarkably, the dog hardly barked. After a sharp drop in 1991, by 1992 GDP growth was back at its 1985–1990 trend of about 5.9 percent per year.12 The economy did not collapse, nor did it dramatically take off. Overall, during the period 1992–2004, growth inched up to 6 percent and then jumped to 7.5 percent in the mid-2000s, where it has remained, more or less, ever since. So should India be counted as a shining example of the wisdom of trade theory, or something closer to the opposite?

pages: 463 words: 140,499

The Tyranny of Nostalgia: Half a Century of British Economic Decline
by Russell Jones
Published 15 Jan 2023

To give some context, a little over 4 million days were lost per year in the 1960s, just over 3 million per year in the 1950s, and some 7.25 million in the 1980s, although this latter number was skewed upwards by the 27 million or more days lost in 1984 during the miners’ strike. Thereafter, as trade union power waned, the figures dropped to a mere fraction of the first four post-war decades. The decade’s dreadful reputation can be overplayed, however. After all, notwithstanding its ups and downs, the 1970s saw real GDP growth average 2.25% per year. While this was well below the pace recorded in the 1950s (just over 3%) and the 60s (almost 3.5%), it was not far short of the rate seen in the 1980s (2.75%), which was supposedly an era of renaissance for the British economy, and it was some way above the figures seen in the 1990s (just over 2%) and in the past two decades (1.75%).

Just as pertinently, official interest rates finally fell back into single digits, and the broader effects on borrowing of the progressive abandonment of credit controls − a tried-and-trusted technique of demand management during the four previous decades − became manifest. With the fiscal and monetary squeeze on the private sector significantly reversed, and the exchange rate coming down, the cyclical upswing gathered momentum. Real GDP growth exceeded 3.5% in 1983, and a cavernous output gap finally began to close. And 1983 was, of course, an election year. Whatever the initial claims around the longer-term focus of the MTFS, the political manipulation of the business cycle that characterized the 1950s, 1960s and 1970s lived on. Despite the high level of unemployment, a combination of fiscal largesse, lower interest rates, economic recovery, military success in the Falklands War and a Labour Party opposition beset by internecine warfare and espousing policies that were too left-wing resulted in a landslide victory for the Conservatives in the June 1983 election.

Instead, taking his lead from Alan Walters and other hardcore monetarists, who favoured the use of narrower definitions of money as intermediate objectives because they were less subject to distortions, he switched the focus of monetary policy towards M0, thereby letting a target that was apparently easier to hit overshadow one that, although it was badly behaved, at least had some meaningful relationship with the overall price level. The MTFS was overhauled in the budget of 1984. It was given a five-year time horizon, rather than one of three or four years as previously, and M3 and M0 were presented as parallel monetary targets. The monetary targets were then supplemented in 1985 by medium-term projections for nominal GDP growth, in effect reinstating the demand management in cash terms that had been at the heart of the 1944 White Paper on Employment Policy. In reality, however, even if it was not yet subject to a formal target, it was the exchange rate that was increasingly afforded the greatest weight in policy. It is ironic that the years 1983, 1984 and 1985 finally saw both monetary growth and the budget deficit and the inflation rate largely coming to heel, but the weakness of the exchange rate – fed in part by erratic communications on currency policy, falling oil prices and production, and a growing deficit in manufacturing trade – kept interest rates in double digits for the most part.

pages: 437 words: 115,594

The Great Surge: The Ascent of the Developing World
by Steven Radelet
Published 10 Nov 2015

The rapidly growing importance of developing countries to the global economy became clear during the 2008 global financial crisis. Growth in Europe and North America ground to a halt, and the emerging countries kept the global economy moving forward. In 2009, rich-country economies contracted sharply, with GDP growth averaging a dismal -4.2 percent. Many thought the impact on developing countries would be disastrous. It wasn’t. Developing-country GDP growth remained a relatively buoyant 3.1 percent, helping to moderate the impact on the global economy. Trade plunged sharply, reflecting the abrupt slowdown in global economic activity. But within two years, trade was back to near its peak.

More specifically, let’s look at the number of developing countries for which growth in GDP per capita has exceeded the benchmarks of 2 percent and 4 percent per capita, and how the patterns have changed over time. (Note that these are per capita growth rates, so that in countries where populations are growing by 2 percent, they are roughly equivalent to GDP growth rates of 4 percent and 6 percent, respectively.I) Why these benchmarks? Economists often use 2 percent per capita growth as a standard for a respectable rate of moderate growth for two reasons: it is roughly equal to the average long-term growth rate for the United States and other leading economies since the industrial revolution, and it is roughly equal to the world average growth rate since 1960.

More worrisome, GDP (and NNP) ignores the costs of the depreciation (or destruction) of natural capital such as forests, water and air supplies, biodiversity, and natural resources. If GDP is expanding because loggers are clear-cutting forests with no replanting, that growth is unsustainable. In such cases, GDP growth overstates the improvement in the country’s welfare, since it doesn’t count the loss of the trees. Perhaps the most visible example of this problem is the massive increase in air pollution in China’s cities. When at its worst, as Beijing was in the early months of 2013, it is hard to see more than a few hundred yards, and people can smell, taste, and gag on it.

All About Asset Allocation, Second Edition
by Richard Ferri
Published 11 Jul 2010

FIGURE 11-8 S&P 500 Earnings Growth is Highly Correlated with Per Capita GDP Growth 100,000 1,000 10,000 100 1,000 10 1000 1 10 GDP per capita (left scale) S&P 500 earnings (right scale) 2009 2004 1999 1994 1989 1984 1979 1974 1969 1964 1959 1954 1949 1944 1939 1934 0 1929 1 Realistic Market Expectations 235 The long-term correlation between annual GDP per capita growth and S&P 500 earnings growth has been over ⫹0.9. The correlation is higher if earnings are smoothed over 10 years to reduce the effect of recessionary earnings lulls. THE FEDERAL RESERVE AND GDP GROWTH The Federal Reserve has two primary mandates: first, to foster full employment by promoting controlled GDP growth, and second, to keep inflation in check.

In a sense, the Federal Reserve is the tail that wags the dog. It is difficult to envision real GDP growth at 3 percent in the United States given the mounting federal deficit, soaring state deficits, the trade deficit, the aging population, and potential tax increases to pay for all these deficits. On the other hand, earnings may increase at a faster rate than GDP in the foreseeable future resulting from productivity gains from technology, a leaner workforce, and a greater percentage of earnings coming from overseas ventures by U.S. multinational corporations. So, while 3 percent real GDP growth may be difficult to accomplish, a 3 percent real earnings growth may still happen, and that is the important number for stock price valuation.

TA B L E 11-4 Examples of Expected Returns Derived by Layering Risk Premiums T-Bills IntermediateTerm Treasury Notes IntermediateTerm LargeCorporate Cap Bonds Stocks Real risk-free rate Term risk premium (intermediate) Credit risk premium (intermediate) Equity risk premium Value stock risk premium Small stock risk premium 0.5 0.5 0.5 0.5 0.5 1.5 1.5 1.5 1.5 1.0 1.0 2.0 1.0 2.0 Real expected return Inflation 0.5 3.0 2.0 3.0 3.0 3.0 5.0 3.0 8.0 3.0 Total expected return 3.5 5.0 6.0 8.0 11.0 SmallCap Stocks 2.0 1.0 Realistic Market Expectations 233 MODEL 2: ECONOMIC FACTOR FORECASTING A second method for calculating expected market returns is through a “top-down” approach using an economic growth assumption. Gross domestic product (GDP) is the sum of all goods and services produced or sold in the United States. The Federal Reserve has a target for overall GDP growth, and it attempts to control that growth through changes in monetary policy. That growth number is about 3.0 percent after inflation. About 10 percent of corporate-generated GDP eventually flows through to corporations as earnings. This number has been fairly consistent over time. Since corporate earnings are ultimately reflected in stock prices, economic growth forecasts can be used to forecast stock returns.

pages: 371 words: 98,534

Red Flags: Why Xi's China Is in Jeopardy
by George Magnus
Published 10 Sep 2018

In a nutshell, China, like many countries, is faced with the challenge of having to boost its total factor productivity (TFP). A brief explanation would be helpful here because TFP isn’t actually measurable. It is in fact a residual in GDP growth accounting, once we have accounted for the more measurable contributions made by changes in labour and capital inputs. It is, basically, an efficiency term that captures the impact of technical progress and institutional arrangements that enable total GDP growth to exceed the sum of its labour and capital parts. Think, for example, of things like changes in knowledge and ‘know-how’, as opposed to information; the impact of new technologies on new products and processes; competition rules, the operation of the rule of law, and the security of contracts; the way factories or offices are organised; business processes and management techniques; and the effects of high levels of trade and commercial integration.

It is important to try and understand the circumstances under which this slowdown will occur. It is also worth noting that China’s manicured, official GDP data reveal very little about the sometimes volatile nature of what’s going on in the economy. Systemic bias in the collection of data arises from the practice of setting annual GDP growth targets. Once set, state and local government authorities are duty-bound to hit the target even if, as in recent years, this involves misallocated investment and the rapid accumulation of debt. Reported steady growth of 6.5–7 per cent, therefore, includes misallocated or uncommercial investment, and overstates GDP.

In agriculture, productivity growth rose from about 0.2 to almost 4 per cent per year. In industry and construction, it almost doubled from 3.7 to 6.7 per cent per year. In the tertiary, or services sector, it surged from 1.8 to 5.9 per cent per year. This shift explained almost all of the rise in GDP growth that occurred.14 Labour and capital were more productive because China was able to exploit, mix and manage them better, and to do this it had to reform the way markets and institutions functioned. Reform in China was never going to be straightforward, but was facilitated by three hugely important developments.

pages: 244 words: 66,977

Subscribed: Why the Subscription Model Will Be Your Company's Future - and What to Do About It
by Tien Tzuo and Gabe Weisert
Published 4 Jun 2018

Overall, the SEI reveals that subscription businesses grew revenues about eight times faster than S&P 500 company revenues (17.6 percent versus 2.2 percent) and about five times faster than US retail sales (17.6 percent versus 3.6 percent) from January 1, 2012, to September 30, 2017. There is a correlation between SEI growth and GDP growth. Both the SEI and GDP slowed around the end of 2016 and beginning of 2017: US GDP growth peaked in Q3 2016 at 2.8 percent and then sank to just 1.2 percent in Q1 2017. At the same time, the SEI growth rate also peaked in Q3 2016 at 21.6 percent, and then cooled to an average annual growth rate of 14.3 percent. Recently, both the SEI and GDP roared back in Q2 and Q3: SEI grew at approximately a 24 percent annual rate for two consecutive quarters, the fastest growth since Q2 2014.

Recently, both the SEI and GDP roared back in Q2 and Q3: SEI grew at approximately a 24 percent annual rate for two consecutive quarters, the fastest growth since Q2 2014. At the same time, GDP posted a very strong rebound, growing at a surprise annual rate of 3.1 percent in Q2, the best result since Q1 2015, and a healthy 2.5 percent in Q3. SEI Growth vs. GDP Growth A comparison of SEI growth (left axis) versus American GDP growth (right axis). Note that the SEI generally tracked with the overall GDP slowdown around the end of 2016, and the subsequent acceleration in 2017. TWO SUBSCRIPTION ECONOMY GROWTH LEVERS: ARPA AND NET ACCOUNTS The following figure demonstrates the two primary levers of growth in the Subscription Economy—average revenue per account (ARPA) and net account growth.

.* Sources S&P Dow Jones Indices http://us.spindices.com/indices/equity/sp-500 US Census Bureau, “Monthly Retail Trade and Food Services” www.census.gov/econ/currentdata/dbsearch?program=MRTS&startYear=1992&endYear=2016&categories=44000&dataType=SM&geoLevel=US&adjusted=1&notAdjusted=1&submit=GET+DATA&releaseScheduleId= McKinsey, “Grow Fast or Die Slow” www.mckinsey.com/industries/high-tech/our-insights/grow-fast-or-die-slow US GDP Growth www.bea.gov/newsreleases/national/gdp/gdpnewsrelease.htm ACKNOWLEDGMENTS I’d like to start by thanking my cofounders K. V. Rao and Cheng Zuo for taking me on the journey to create the Subscription Economy. I’m grateful to Marc Benioff for giving me the opportunity at Salesforce.com and encouraging me to take my own plunge.

pages: 327 words: 90,542

The Age of Stagnation: Why Perpetual Growth Is Unattainable and the Global Economy Is in Peril
by Satyajit Das
Published 9 Feb 2016

They allow savers to invest, and provide existing investors with the ability to liquidate their investments when circumstances require. Financialization undermines these functions. Stock markets have increasingly decoupled from the real economy. Despite the fact that shares represent claims on the real economy, equity prices now do not correlate to fundamental economic factors, such as GDP growth, or, sometimes, earnings. High-frequency trading (HFT), which entails super-fast computers rapidly trading stocks, usually with other computers, constitutes up to 70 percent of the trading volume in some markets. The average holding period of HFT is around ten seconds. The investment horizon of portfolio investors has also shortened.

It would also create inflation, boosting nominal growth and reducing the ratio of debt to GDP by increasing the latter. The sustainable level of borrowing depends on the existing level of public debt (percent of GDP), the current budget position (percent of GDP), nominal interest rates, and nominal growth rates: Changes in Government Debt = Budget Deficit + [(Interest Rate × Debt)—GDP Growth] Assuming borrowing costs of 3 percent and a debt-to-GDP ratio of 90 percent, a nation needs to grow at a minimum of 2.7 percent to avoid increasing its debt burden, provided the budget is balanced. Following the GFC, despite governments expanding their borrowing, a global chronic deficiency of demand meant growth has not recovered to the level needed.

In the Eurozone and UK, the effect of higher asset prices on consumption was also low. Successive rounds of central bank bond-buying have had a minimal impact on real activity. US Fed purchases of US$600 billion worth of long-term government bonds in the second QE program of November 2010 may have only added about 0.13 percent to real GDP growth in late 2010, and 0.03 percent to inflation. The improvement in US economic conditions may have less to do with Fed policy than with natural factors: “As long as people have babies, capital depreciates, technology evolves, and tastes and preferences change, there is a powerful underlying (and under-appreciated) impetus for growth….”10 Although asset prices increased sharply after 2009, there was little evidence of inflation, other than for some commodities affected by structural factors, such as a weak US dollar.

Deep Value
by Tobias E. Carlisle
Published 19 Aug 2014

Other research extending Dimson, Marsh, and Staunton’s findings to emerging markets, where presumably GDP growth rates are at their highest, finds the same relationship. Paul Marson, the chief investment officer of Lombard Odier, one of the largest independent Swiss private banks, examined the drivers of returns in developing countries over the period 1976 to 2005, and could find no correlation between GDP growth and stock market returns.15 Commenting on Marson’s research in its Buttonwood column, The Economist identified China as the classic example of this phenomenon; average nominal GDP growth between 1993 and 2009 was 15.6 percent, the compound stock market return over the same period was negative 3.3 percent.

Research undertaken by Elroy Dimson, Paul Marsh, and Mike Staunton from the London Business School suggests that chasing growth economies is akin to chasing overvalued stocks, and generates similarly disappointing results.14 In one study of 17 countries’ stock markets going back to 1900, Dimson, Marsh, and Staunton found that there was a negative relationship between investment returns and growth in GDP per capita; in other words, higher GDP growth led to lower stock market returns. In a second test, they took the five-year growth rates of the economies and divided them into quintiles, or fifths. The stock markets in the economies with the highest growth rate produced average returns over the following year of 6 percent. Those in the lowest-growth quintile produced returns of 12 percent, double the returns of the high-growth economies. In a third test, Dimson, Marsh, and Staunton could find no statistical link between one year’s GDP growth rate and the next year’s investment returns. In each country, returns were either unrelated to short-term growth of GDP, or inversely related, which means that high growth predicted low returns, and vice versa.

Paul Marson, the chief investment officer of Lombard Odier, one of the largest independent Swiss private banks, examined the drivers of returns in developing countries over the period 1976 to 2005, and could find no correlation between GDP growth and stock market returns.15 Commenting on Marson’s research in its Buttonwood column, The Economist identified China as the classic example of this phenomenon; average nominal GDP growth between 1993 and 2009 was 15.6 percent, the compound stock market return over the same period was negative 3.3 percent. Buttonwood contrasted China’s performance with “stodgy old Britain,” which saw average nominal GDP growth of just 4.9 percent, but annual market returns of 6.1 percent—better than nine percentage points ahead of booming China. On his Efficient Frontier web site, author and American financial theorist William J. Bernstein observed that “[y]ou don’t have to go cross-eyed with regression analyses to convince yourself; a few anecdotes tell the story:”16 During the twentieth century, England went from being the world’s number one economic and military power to an overgrown outdoor theme park, and yet it still sported some of the world’s highest 88 DEEP VALUE equity returns between 1900 and 2000.

Stocks for the Long Run, 4th Edition: The Definitive Guide to Financial Market Returns & Long Term Investment Strategies
by Jeremy J. Siegel
Published 18 Dec 2007

This chapter will analyze all these issues, coming to the conclusion that the long-term future of equity returns looks bright if the United States keeps its capital markets open to the rest of the world. GDP GROWTH AND STOCK RETURNS Some very surprising results are shown in Figure 8-1. In Chapter 1 we reported on the long-term stock returns of 16 major markets around the world from 1900 through 2006. The long-term dollar returns of each country reported against the average real growth of its GDP are plotted in Figure 8-1a. The results are striking. Real GDP growth is negatively correlated with stock market returns.2 That is, higher economic growth in individual countries is associated with lower returns to equity investors.3 Similarly, the stock returns for the developing countries against their GDP growth are plotted in Figure 8-1b.4 Again, despite the huge returns chalked up to developing markets in recent years, there is a negative relation between the returns to individual countries and the growth rates of their GDP.

It is also of interest that the growth of earnings and dividends per share is higher since World War II than before even though the GDP growth is lower. The cause of the higher earnings growth in the last 60 years is the decline in the dividend-payout ratio and subsequent increase in the use of retained earnings to finance growth. As explained in Chapter 7, the valuation of a firm is independent of the dividend policy chosen as long as the rate of return on retained earnings is identical to that demanded by shareholders. This can be shown TABLE 8–1 Summary Statistics for Dividends per Share, Earnings per Share, and Stock Returns for the U.S. Economy, 1871 through December 2006 Real GDP Growth Real per Share Real per Share Earnings Growth Dividend Growth Dividend Yield* Payout Ratio* 1871-2006 3.57% 1.88% 1.32% 4.58% 58.17% 1871-1945 3.97% 0.66% 0.74% 5.29% 66.78% 1946-2006 3.09% 3.40% 2.03% 3.53% 51.38% *Denotes median. 128 PART 2 Valuation, Style Investing, and Global Markets by the Gordon model.

73 Conclusion 74 Appendix: History of the Tax Code 74 Chapter 6 The Investment View of Stocks: How Fickle Markets Overwhelm Historical Facts 77 Early Views of Stock Investing 79 The Influence of Smith’s Work 80 Common Stock Theory of Investment 82 A Radical Shift in Sentiment 82 The Postcrash View of Stock Returns 83 The Beginning of the Great Bull Market 85 Warnings of Overspeculation 86 The Top of the Bubble 88 The Bear Market and Its Aftermath 89 PART 2 VALUATION, STYLE INVESTING, AND GLOBAL MARKETS Chapter 7 Stocks: Sources and Measures of Market Value 95 An Evil Omen Returns 95 Valuation of Cash Flows from Stocks 97 Sources of Shareholder Value 98 The Value of Stock as Related to Dividend Policy 100 viii Earnings Concepts 102 Earnings Reporting Methods 102 The Employee Stock Option Controversy 104 Controversies in Accounting for Pension Costs 105 Standard & Poor’s Core Earnings 107 Earnings Quality 108 Downward Biases in Earnings 109 Historical Yardsticks for Valuing the Market 110 Price-Earnings Ratios 110 The Fed Model, Earnings Yields, and Bond Yields 113 Corporate Profits and National Income 115 Book Value, Market Value, and Tobin’s Q 117 Market Value Relative to the GDP and Other Ratios 119 Conclusion 121 Chapter 8 The Impact of Economic Growth on Market Valuation and the Coming Age Wave 123 GDP Growth and Stock Returns 124 The Gordon Dividend Growth Model 126 Economic Growth and Stock Returns 127 Factors That Raise Valuation Ratios 128 Factors That Impact Expected Returns 129 The Equity Risk Premium 130 More Stable Economy 131 New Justified P-E Ratios 132 The Age Wage 133 Demography Is Destiny 134 The Bankruptcy of Government and Private Pension Systems 135 Reversal of a Century-Long Trend 135 The Global Solution: An Opportunity to Make a Trade 136 Attraction of U.S.

pages: 523 words: 111,615

The Economics of Enough: How to Run the Economy as if the Future Matters
by Diane Coyle
Published 21 Feb 2011

There’s no doubt that in a number of ways GDP is a flawed statistic as a measure of welfare. But any replacement would be flawed too, not to mention much harder for many countries to collect and measure; at least with the familiar GDP statistics we know what we’re getting. At the same time, it is equally clear that GDP growth will not in itself give members of society an adequate sense of meaning or purpose. Policymakers need to aim for more than just GDP growth. Thus one conclusion is that we should look at a much wider array of indicators. The “dashboard” approaches I described should be given due prominence when politicians are assessing how they are doing, or when citizens and journalists are holding politicians to task.

No abundance can relieve his famine: his throat is parched with burning thirst, and, justly, he is tortured by the hateful gold.”1 Economists themselves, drawing on research by psychologists, are now asking: Do the higher incomes created by economic growth make people happy? If not, what will increase people’s happiness, and what economic policies will help? Should economics continue to insist that governments should always aim to increase GDP growth? There is a happiness bandwagon which says not. It’s widely taken as a fact by media commentators and many academics that GDP has gone up but happiness hasn’t increased. Consequently, some prominent economists and psychologists even advocate policies that trade off growth for happiness, including taxes on luxury goods to stop consumers indulging in wasteful spending.2 Their call for governments to force people out of the rat race has gathered quite a lot of support on the center-left of politics, enough to grab significant media attention although not always enough to win votes in elections.

I am not aware of any attempt to take account of the undermeasurement of GDP by the omission of new and better quality goods apart from the Boskin Commission in the United States. It looked mainly at capturing better the improved quality of electronic goods. Its 1996 report found that the statistics had overstated U.S. price inflation by about 1.1 percent, and correspondingly understated real GDP growth.19 National statistical offices do by and large now try to incorporate some allowance for improvements in quality of goods such as computers or cameras. However, William Nordhaus has shown that for some technologies—he looks at lighting and computers—the improvements are far, far greater than has been reflected in GDP statistics.20 No estimates exist for the understatement of GDP by failing to take account of the whole range of new goods and quality improvements; whatever the figure, it would be extremely large.

pages: 471 words: 97,152

Animal Spirits: How Human Psychology Drives the Economy, and Why It Matters for Global Capitalism
by George A. Akerlof and Robert J. Shiller
Published 1 Jan 2009

It is also worth noting that in the United States the price of one type of land, agricultural land, has appreciated at a much slower rate than the growth of GDP over the past century. Its real value increased only by a factor of 2.3 over the whole century, or about 0.9% per year—far below GDP growth.10 That suggests a dismal return overall for investors. Agricultural land was in fixed supply, but prices did not keep up with real GDP growth because it was not a major factor in this GDP growth. According to the National Income and Product Accounts, agriculture, forestry, and fishing accounted for 8.3% of U.S. national income in 1948, but only 0.9% of national income in 2008. An economy increasingly dominated by the service sector has not been an intensive user of land for some time.

There is in fact, as has long been known, a strong historical connection (in terms of correlation across countries) between national savings rates and national economic growth rates (see, for example, Modigliani 1970 and Carroll and Weil 1994). 19. See http://ask-us.cpf.gov.sg/?prof=mem. 20. Peebles (2002). 21. In standard growth accounting the contribution of savings to GDP growth would be the product of the “share of capital” (which is typically between 1/4 and 1/3) and the rate of growth of the capital stock. With a capital output ratio of 3 and a net savings rate of 1/3 the capital stock will be growing at the rate of 1/9. The contribution of savings to GDP growth will be between 1/36 and 1/27. 22. The information that follows comes from Andy Di Wu’s personal interviews. 23. Feinberg (1986, p. 355). 24.

The previous boom had been top-heavy in expenditures on capital equipment.5 Investment in equipment and software had been especially high just prior to the Y2K scare. In this new boom the stimulus came from housing. In the four short years from 2001 to 2005 expenditures on housing increased by 33.1%, while GDP growth was only 11.2%.6 But then, as we have already recounted, odd things began to happen. These are the types of things that happen in booms as overconfidence takes hold. People began to buy housing as if this were their last chance ever to buy a house (because, they thought, prices would continue to escalate beyond their means), and speculators began to make investments in housing, as if other people were going to think that they should buy now, at almost any price, because they would not be able to afford to buy a house later.

pages: 435 words: 127,403

Panderer to Power
by Frederick Sheehan
Published 21 Oct 2009

Those business economists who had read the May 2000 Survey of Current Business published by the Bureau of Economic Analysis would have seen that businesses had spent $97.8 billion in 1999 on computers but that “real” spending, according to the BEA, had been $220 billion.10 That is, computers bought in 1999 had cost businesses $97.8 billon. The $220 billion included the Bureau of Economic Analysis’s adjustment for how much the $98 billion of spending contributed to the economy. The $220 billion was used when the government calculated GDP growth and productivity. The $122 billon difference was fictional; those dollars never existed. The $122 billion of fiction was more than 1 percent of the gross domestic product in 1999. 6 FOMC meeting transcript, December 19, 1995, p. 38. 7Michael Barone and Richard E. Cohen, Almanac of American Politics, 2008 (Washington, D.C.: National Journal Group, 2007), p. 682.

Bunning had been an investment broker and agent from 1960 to 1986. 8Alan Greenspan, “Business Data Analysis,” speech via videoconference, New York Association for Business Economics, New York, June 13, 2000. It would seem that all but the most skeptical would question whether the recreational mathematics that the bureaucrats at the BEA applied accurately calculated GDP growth.11 “Irrespective of how measured” would also dismiss a study published by the Congressional Budget Office in June 1999. Robert J. Gordon, a professor at Northwestern University, was the author. Gordon wrote: “There has been no productivity growth acceleration in the 99% of the economy located outside the sector which manufactures computer software.… Indeed, far from exhibiting productivity acceleration, the productivity slowdown in manufacturing has gotten worse”12 [authors’ italics]. 10 Bureau of Economic Analysis, Survey of Current Business, May 2000.

Fleckenstein with Frederick Sheehan, Greenspan’s Bubbles: The Age of Ignorance at the Federal Reserve (New York: McGraw-Hill, 2008), p. 102, discusses the CBO paper in more detail. 15 In 2000, business computer sales of $101 billion were inflated to hedonically adjusted “real sales” of $290 billion—the difference being about 2 percent of GDP growth. Data from Survey of Current Business, Bureau of Economic Analysis, December 2001. 16 “Longterm expectations of the security analysts, which we presume reflect the views of corporate management, have not diminished. Indeed, they continue to move up for both the hightech and the old economy firms.”

The Limits of the Market: The Pendulum Between Government and Market
by Paul de Grauwe and Anna Asbury
Published 12 Mar 2017

This lowered the return (after taxes) on assets, because in those countries incomes from assets were taxed in the same way. After World War II GDP growth accelerated dramatically, largely as a result of rebuilding after the horrific destruction of the war. This led to a unique combination of historically low return on capital and historically high growth. Suddenly the inequality r > g was reversed, leading to higher growth in GDP than the return on capital in this period. Wage earners whose growth in income was mainly determined by GDP growth saw their position improve, while the capitalists saw their income position deteriorate. This did not last long, however.

In a monetary union such as the eurozone the national governments are vulnerable to movements driven by fear and panic on the financial markets. This fear is fed when a country is affected by a recession. Market movements can push the governments into a liquidity crisis, which compels them to make radical spending cuts. They thus have to make cuts just when things are going badly for the economy. 10 GDP GROWTH (IN %) 5 0 –5 –10 –15 –20 –5 y = –1,3889x + 6,4349 R2 = 0,8941 0 5 10 15 AUSTERITY MEASURES (IN % GDP) Figure .. Cumulative growth in GDP and budgetary austerity – Source: IMF, Fiscal Observer and European Commission, AMECO  20 EUR O THR EAT TO T HE M AR KET SY STEM One of the achievements of recent decades is that modern government budgets have automatic stabilizers, so that when the country enters a recession the budget automatically goes into the red because tax revenues drop and benefits payments rise.

The Rentiers are Back The dynamics which emerges from the restoration of r > g also has a further implication for society: an increasingly large proportion of the top incomes go to the rentiers, i.e. those who own capital. At face value that might not seem obvious, but it follows from the fact that r > g. If GDP growth is low compared with the return on (and growth of ) capital, then capital becomes ever greater than GDP. This means that it becomes much easier to grow filthy rich from owning a lot of assets than from working hard. In such a world, inherited assets will also become ever greater in comparison with those which can be created by individual efforts.

pages: 339 words: 88,732

The Second Machine Age: Work, Progress, and Prosperity in a Time of Brilliant Technologies
by Erik Brynjolfsson and Andrew McAfee
Published 20 Jan 2014

On television, in the pages of the business press, and in the blogosphere, a chorus of analysts debate and predict trends in interest rates, unemployment, stock prices, deficits and myriad other indicators. But when you zoom out and consider trends over the past century, one overwhelming fact looms above all others: overall living standards have increased enormously in the United States and worldwide. In the United States, the rate of GDP growth per person has averaged 1.9 percent per year going back to the early 1800s.1 Applying the rule of 70 (the time to double a value is roughly equal to 70 divided by its growth rate), we see that this was enough to double living standards every thirty-six years, quadrupling them over the course of a typical lifetime.* This increase is important because economic growth can help solve a host of other challenges.

How do we measure the benefits of free goods or services that were unavailable at any price in previous eras? What GDP Leaves Out Despite all the attention it gets from economists, pundits, journalist, and politicians, GDP, even if it were perfectly measured, does not quantify our welfare. The trends in GDP growth and productivity growth covered in chapter 7 are important, but they are not sufficient measures of our overall well-being, or even our economic well-being. Robert Kennedy put this poetically in his quote at the beginning of this chapter. While it would be unrealistic to put a dollar value on stirring oratory like RFK’s, we can do a better job of understanding our basic economic progress by considering some of the changes in the goods and services that we are able to consume.

A simple switch to using a free texting service like Apple’s iChat instead of SMS, free classifieds like Craigslist instead of newspaper ads, or free calls like Skype instead of a traditional telephone service can make billions of dollars disappear from companies’ revenues and the GDP statistics.5 As these examples show, our economic welfare is only loosely related to GDP. Unfortunately many economists, journalists, and much of the general public still use “GDP growth” as a synonym for “economic growth.” For much of the twentieth century, this was a fair comparison. If one assumes that each additional unit of production created a similar increment in well-being, then counting up how many units were produced, as GDP does, would be a fine approximation of welfare.

There Is No Planet B: A Handbook for the Make or Break Years
by Mike Berners-Lee
Published 27 Feb 2019

To date this has been linked to both carbon and energy growth and those who think the link is inevitable logically draw the conclusion that GDP growth must halt too. However, at heart GDP is just an abstract human construct that has no inevitable connection to any physical activities. It would be physically possible for everyone to go about their life in exactly the same way without the exchange or use of money at all. 122 5 GROWTH, MONEY AND METRICS On the other hand, I’m not sold on the idea that GDP growth is the root of all our problems either. It would be possible, in theory at least, to grow GDP simply by charging for new services that have lower physical impact (examples include neighbourly care, other forms of human contact, and cloud computing), whilst phasing out or charging more for higher impact activities like petrol cars, it would clearly be possible to reduce humankind’s impact on our planet whilst growing GDP2.

It is a brutal reality that every life saved by a health service carries an opportunity cost. We would do better to look at this clearly than pretend it isn’t true. Worth remembering too that increased life expectance carries with it an implication on population growth. Wellbeing: An infinitely superior goal than GDP growth. Whether it lends itself to measurement is another question. In fact, the exercise of trying to strangle human wellbeing into quantifiable metrics could be self-defeating. Awareness: Crucially important. Appreciation of small things could be the most critical and essential thing for humans to be growing.

We need a new system of economics fit for the twenty-first century We need to think through from scratch the roles of growth, jobs, investments, technology, the way wealth is distributed, the metrics we use and the role of markets. Within this there are Big Picture Summary 197 big and challenging messages and opportunities for business, including some reframing of the concept itself. Some types of growth are still healthy but others are not We have to shrink our environmental impacts. GDP growth is now harmful as a measure of success. Things we do need to grow as fast as we can include global empathy, stewardship, diversity, and quality of life for all species and our capacity for the types of thinking that will allow us to steer our way through the Anthropocene. We will require globally shared values of respect for all people, for the planet, and for truth Cultural values and economic frameworks reinforce each other.

pages: 241 words: 81,805

The Rise of Carry: The Dangerous Consequences of Volatility Suppression and the New Financial Order of Decaying Growth and Recurring Crisis
by Tim Lee , Jamie Lee and Kevin Coldiron
Published 13 Dec 2019

The result is then a “vanishing point,” as trend economic growth and interest rates fall progressively lower, eventually to zero. GDP today occurs at the expense of GDP in the future. It should be noted that this is completely contrary to a conventional economic perspective. A conventional economist would believe that GDP growth begets more GDP growth—as new jobs and new demand are created—and that there is no such thing as some sort of limiting point to GDP growth. But what needs to be understood is that the carry regime is taking us farther away from the type of market economy that is assumed by conventional economic analysis. In fact, put in conventional terms, it is taking us away from a market economy in which risks are borne by individuals and individual businesses and institutions and priced in the market, to an economy in which risks are socialized, or perceived to be socialized.

Why should profit share have risen progressively through the cycles of carry bubbles and carry crashes as economic growth was decaying? As Figure 8.4 shows, US personal net worth, or wealth, showed roughly the same pattern of development relative to GDP. The fact that underlying economic growth has been decaying is indisputable. It is evidenced from data—for average rates of real GDP growth and productivity—and, more importantly, by the progressively lower level of real interest rates (long-term interest rates adjusted for underlying inflation). Very low real interest rates— which were roughly zero globally by 2015—must mean that the return to real investment is very low and trend economic growth is low.

See quantitative easing QE3, 101, 103 quantitative easing (QE), 101, 105, 127, 136, 196, 209, 219 BOJ and, 31 real economic activity, measures of, 56 real estate booms, currency carry trades contributing to, 13 228 realized volatility, 90, 164, 167–168 anti-carry regime and, 172 implied volatility relationship to, 158 recessions, carry and consequences of, 6 recipient currencies, 10–11, 13, 65 crashes in, 23 volatility in, 215 regulatory capture, 176 rent-seeking carry as, 175–177 defining, 175 reporting horizons, 70–71 reserve balances, 109–110 resource allocation, carry regime and, 114–115 return, risk and, 99 risk carry trade profit explanations and, 48 of carry trades, 3, 5 of CDOs, 36–37 currency, 12 exchange rate, 12–13 market, 99 mispricing of, 21, 35–37, 132, 134–140, 142 return and, 99 ruin, 65, 72 selling optionality and, 153 socialization of, 136 spreading, 35 risk controls, 65 risk premium, 148, 152 portfolio volatility and, 159 roll yield, 91 rubisco, 189 ruin risk, 65, 72 sawtooth patterns, 96–97, 97f shadow banks, 137 Shin, Hyun Song, 22, 80–81 short squeezes on liquidity, 165 short-term reporting horizons, 70–71 social hierarchies, 187 social networks, 187 social realities, 184 socialization of risk, 136 South Africa, 55n6 sovereign bonds, 162 equity indexes correlation to, 161 Sovereign Wealth Fund Institute, 75 INDEX sovereign wealth funds, 75–76 growth of, 83 S&P 500, 53–55, 55n6, 56, 95 carry regime importance of, 86–87, 87f as carry trade, 160–162 equity risk trade correlation with, 99 gamma for, 154, 154f liquidity premiums for, 161 market corrections and, 79 mean reversion of, 154f, 155 quantitative easing and, 103 selling volatility on, 98 volatility of, as global volatility risk factor, 99 volatility selling in, 89–92 volatility trading on, 85, 86 S&P 500 front e-mini future, 159 stagflation, 217 stochastic discount factor, 99 stock buybacks, 82, 83f stock market crashes, of 1987, 155 stock markets carry and structures of, 7 emerging currency stability compared with, 55 performance of, 1 recessions and crashes in, 6 volatility bets in, 89 stocks, put options against, 34 stopped out, 94 structured finance, 135 subprime mortgages, 36 superstar effects, 186 Swiss franc, 29, 31, 33, 34 taxi licensing, 175 Thai baht, 25 Thailand, balance of payments current account deficit, 25 Theron, Charlize, 185 trading frequency, 74 tulip bulbs, 133 Turkey, 19, 20, 23, 39, 202 balance of payments, 45 carry bubble and bust, 42–46 consumer price index, 44 credit and claims data for, 43, 43f GDP growth, 45 interest rates, 12–13 INDEX Turkish lira, 11, 13, 20, 21, 23, 44, 55n6 carry crash of 2018 in, 45, 65 Twitter, 186 uncovered interest rate parity (UIP), 47, 48 United States capital flows into, 18 carry trade funding and, 17–20 current account deficit, 17 personal net worth in, 137, 138f savings rates, 18, 19 US Federal Reserve, 14, 26 balance sheet of, 101–102 carry crashes limited by, 127 carry regimes and, 107, 208 carry trades by, 103 creation of, 218 interest rates and, 14, 137, 208 liquidity swaps by, 104–105, 196–198 quantitative easing and, 101, 105 US household financial assets, 117–120, 117f–120f valuation metrics, 204 vanishing point, 116, 195, 209–210 variance, 94 VIX, 85, 95, 99 forward curve average, 92, 92f money value and, 100, 122 shorting, 96 spikes in, 98 VIX futures, 90–92 selling volatility using, 156, 158 shorting, 148, 157 VIX futures rolldown, 59, 96 VIX index, 53n5 volatility, 3 currency, 62 currency carry trade collapse signs from, 215 direct bets on, 89 equilibrium structure of premiums for, 156–160, 157f equity, 59 financial crises and spikes in, 52 in funding currencies, 215 global, 99, 101 implied, 57, 90 market making as premium for, 158–159 229 negatively priced liquidity and, 166 optionality and, 93–95 options and, 146–148 portfolio, 159 realized, 90 in recipient currencies, 215 selling, as short position, 156 selling, by receiving implied and paying realized, 148–150 selling, by receiving realized and paying realized, 151–156 short, 4 signs of carry regime ending and, 214–218 spikes in, 98 time horizons of, 152, 153f, 154, 154f value of money and, 98–101, 122 of volatility, 90 volatility carry, 86 volatility selling, 86, 96 central banks and, 101–105 in S&P 500, 89–92 volatility shock, 161 volatility-selling trades, 33–35, 57, 69 Volcker Rule, 77 Volmageddon, 98, 161 VXO index, 53, 53n5, 54, 55n6, 90n2 VXX, 92 wealth distribution, carry and, 2 wealth inequality, central bank stabilization actions and, 6 “What Explains the Persistence of Global Imbalances?”

pages: 497 words: 123,778

The People vs. Democracy: Why Our Freedom Is in Danger and How to Save It
by Yascha Mounk
Published 15 Feb 2018

Nicholas Crafts and Gianni Toniolo, 210–239 (Cambridge: Cambridge University Press, 1996); and “France GDP Growth Rate by Year,” Multpl, http://www.multpl.com/france-gdp-growth-rate/table/by-year, accessed April 5, 2017. For Germany, see Jurgen Weber, Germany, 1945–1990: A Parallel History (Budapest: Central European University Press, 2004), 37–60; and “Germany GDP Growth Rate by Year,” Multpl, http://www.multpl.com/germany-gdp-growth-rate/table/by-year, accessed April 5, 2017. For Italy, see Vera Zamagni, The Economic History of Italy 1860–1990 (Oxford: Oxford University Press, 1993); and “Italy GDP Growth Rate by Year,” Multpl, http://www.multpl.com/italy-gdp-growth-rate/table/by-year, accessed April 5, 2017. 7. Different measures of equality paint a slightly divergent picture of just how strong the increase in inequality has been.

See also Juan Antolin-Diaz, Thomas Drechsel, and Ivan Petrella, “Tracking the Slowdown in Long-run GDP Growth,” Review of Economics and Statistics 99, no. 2 (2017): 343–356; and Robert J. Gordon, The Demise of U.S. Economic Growth: Restatement, Rebuttal, and Reflections, NBER Working Paper No. 19895, National Bureau of Economic Research, February 2014, http://www.nber.org/papers/w19895. 6. For France, see Pierre Sicsic and Charles Wyplosz, “France: 1945–92,” in Economic Growth in Europe since 1945, ed. Nicholas Crafts and Gianni Toniolo, 210–239 (Cambridge: Cambridge University Press, 1996); and “France GDP Growth Rate by Year,” Multpl, http://www.multpl.com/france-gdp-growth-rate/table/by-year, accessed April 5, 2017.

pages: 566 words: 155,428

After the Music Stopped: The Financial Crisis, the Response, and the Work Ahead
by Alan S. Blinder
Published 24 Jan 2013

In particular, while the economy was clearly somewhat wounded, I was not convinced we were headed for a serious recession. After all, real GDP growth averaged 2.2 percent in 2007 and just slightly below zero in the first two quarters of 2008. But on September 15, 2008, I turned deeply pessimistic. So did lots of other people—perhaps most important, business-people who make hiring and firing decisions. Layoffs skyrocketed. The two panels of figure 6.1, one for quarterly GDP growth (on the left), the other for monthly job growth (on the right), are repeated from chapter 1. They show the dramatic worsening of an already-weak economy after September 2008.

In fact, business investment grew at essentially the same rate as housing. In terms of share in overall GDP, homebuilding rose from 4.5 percent in 2000 to just over 6 percent in 2005. That extra 1.5 percentage points of GDP, spread out over five years, added just 0.3 percent per year to the overall GDP growth rate. Not much. But inside the small housing sector it was a very big deal. American builders started 1.6 million new homes in 2000 but 2.1 million in 2005. That’s a half million more new dwellings per year—too many, in retrospect. When homebuilding peaked in the second half of 2005, few people viewed that development with alarm.

In that quarter, real GDP fell at a 3.7 percent annual rate. Then it dropped at a frightening 8.9 percent rate in the fourth quarter, and then at a rapid 5.3 percent rate in 2009:1. The graph gives the unmistakable visual impression of something sliding downhill fast—right after the truck hit us. FIGURE 1.5 Falling Off the Table I (real GDP growth, in percent) Job losses, which had averaged “only” 152,000 per month over the first eight months of 2008, leaped to 596,000 jobs per month over the last four, and then to 780,000 a month over the first three months of 2009. Figure 1.6, which depicts these numbers, looks downright scary—and it felt so at the time.

pages: 511 words: 151,359

The Asian Financial Crisis 1995–98: Birth of the Age of Debt
by Russell Napier
Published 19 Jul 2021

Real economic growth had fallen from its 2Q 1993 high of 15% year on year, but in 1Q 1996 the economy was still growing at 11%. Hong Kong’s imported US dollar interest rates were set by a US central bank focused on its own GDP growth rate of 2.6% and its inflation rate of 2.7%. US interest rates had risen sharply from 3% in early 1994 to 6% by January 1995. Now US interest rates were falling. This was occurring as real GDP growth in China was still very high despite the austerity programme. US nominal interest rates seemed increasingly inappropriate for economic conditions in Hong Kong. At the start of 1996, the Hang Seng Index was still 17% below the level it had reached in January 1994, before the rise in US interest rates had begun.

The CEOs were told to do their bit to boost confidence and help ensure a smooth transition. From Hong Kong’s point of view, the timing couldn’t be better. The economy is in the doldrums and the forces of deflation are still evident. For some time the Hong Kong authorities have done their best to conceal the territory’s economic plight and reported GDP growth and inflation have remained high. On the other hand, we have been convinced that the powers of deflation would inevitably assert themselves and reduce the level of asset prices in Hong Kong. However, the PRC authorities have now entered the fray to side with the Hong Kong government against the powers of deflation; the risk/reward ratio for holding over the next 12 months has changed significantly.

The economy may not bottom this quarter, but the fact that China has made it a three-line whip for state-owned firms to expand their Hong Kong operations aggressively can mean only one thing: China will underwrite Hong Kong’s asset prices for at least the next 18 months. Moreover, it is doing it with the only thing that matters in Hong Kong – money. The rise in US interest rates combined with slowing growth in China had taken its toll on Hong Kong. GDP growth was just 1.3% year on year in 3Q 1995 and was to be recorded at just 1.6% in 4Q 1995. These were very low levels of growth by Hong Kong standards, but the economy had in fact bottomed by 3Q 1995. As the handover of Hong Kong to the PRC was approaching, there were legitimate fears of a drain on capital, but the news of this meeting in Shenzhen raised the prospect that this could be more than offset by capital inflow from China.

Thinking with Data
by Max Shron
Published 15 Aug 2014

Do children who use antibiotics get sick more frequently? What is the favorite color of colorblind men? Is the F1 score of this model higher than that of the other model? The typical questions of science are disputes of fact. Does this chemical combination in this order produce that reagent? Does the debt-to-GDP ratio predict GDP growth? Does a theorized subatomic particle exist? What all of these questions have in common is that we can outline the criteria that would convince you to agree to an answer prior to any data being collected. The steps might be simple: count the people in group A, count the people in group B, report if A has more members than B.

If the conditions are already obvious and held by the audience, we can skip straight to demonstrating that they are satisfied. If they aren’t, then our first task is to make a case that we identified a series of steps or conditions that imply the claim. Take a famous example, the claim that a debt-to-GDP (gross domestic product) ratio of over 90% results in negative real GDP growth. That is, if a national government had debt equal to 90% or more of its GDP in one year, then on average its GDP in the following year would fall, even adjusting for inflation. For several years, this was taken as a fact in many policy circles, based on a paper by the Harvard economists Reinhart and Rogoff.[6] Reinhart and Rogoff stipulated the following truth condition: collect debt-to-GDP ratios for a number of years, across dozens of countries.

Excel errors excluded the first five countries (Australia, Austria, Belgium, Canada, and Denmark) entirely from the analysis. Additional country-year pairs were also omitted from the whole data set, the absence of which substantially distorted the result. Herndon, Ash, and Pollin made a counter-claim. They declared that there is no sharp drop in GDP growth at a 90% debt-to-GDP ratio, and that in fact the growth slowly falls from an average of 3% per year to around 2%, in the 30% to 120% debt-to-GDP ratio range, beyond which the data volume falls out. Their truth condition was simply a smoothed graph fit to the original data, without any bucketing.

pages: 261 words: 86,905

How to Speak Money: What the Money People Say--And What It Really Means
by John Lanchester
Published 5 Oct 2014

material well-being A blanket term for measuring how well-off people are in the round, not just in terms of how much money they have. It’s used in opposition to a narrow emphasis on GDP and tries to emphasize factors such as health, life expectancy, equality, education, and opportunity. If the future of the world is to involve lower GDP growth, which certainly seems likely in the developed world at least, then other factors contributing to material well-being will become more important. We could have flat or low GDP growth but be living longer, be better educated, feel happier, and have less inequality—which would be a win. The attempt to find hard, non-touchy-feely ways of measuring material well-being is a focus of interest in some areas of economics at the moment.

But I do think their choices are in some sense rational. It’s always rational to choose the thing that means most. I don’t want to leave you with the impression that neoliberal economics are never an effective way of growing an economy. They are—indeed, they can be argued to be the most effective technique that we know for rapid GDP growth. But the policies don’t always work, and when they do work, as I’ve argued, it’s often at the price of sharp, arguably unsustainable levels of rising inequality. Similarly, the idea of utility maximization is a potent and effective one, as what scientists call a “first-order approximation” of human motives and behavior.

At the moment the United States’ is 8.2, which is pretty low by global standards—well below the OECD rich-country average of 11.0. Can you guess the most miserable moment in modern US history? June 1980, when the index peaked at 21.98 percent. Some economists have proposed refinements to the misery index, in the form of the growth misery index (which takes account of GDP growth) and the super misery index (which incorporates growth and also the deficit). The most miserable country in the world, on the basis of these measures, is Zimbabwe.58 moat Something protecting a business from competitors, especially from new entrants to the business seeking to compete on price.

pages: 438 words: 84,256

The Great Demographic Reversal: Ageing Societies, Waning Inequality, and an Inflation Revival
by Charles Goodhart and Manoj Pradhan
Published 8 Aug 2020

Most ageing economies (i.e. post-dividend and late-dividend stage) are the richer ones. The concentration of economic power thus rests heavily in the hands of economies that are ageing and have already ‘used up’ their demographic dividend, as shown in Table 3.3.Table 3.3Share of growth of countries at different stages of demographic cycle 2012–2018 period GDP Growth Contributions to Global GDP growth % of Global GDP in PPP terms Early cycle economies 4.9 27 21 Mid-cycle economies 2.4 28 41 Late cycle economies 4.5 45 38 Most worryingly, it is not just the share of global GDP that the ageing economies dominate, they also account for the lion’s share of global growth over the last 15 years.

The over-confidence of central banks in their ability to control inflation, volatility and financial stability contributed to the under-regulated rise of house prices. The rest, as they say, is history. 2.3 China’s Great Reversal China’s greatest contribution to global growth and globalisation is past us. The current account surplus peaked in 2007 and it will now move into a deficit over time. Nominal GDP growth topped out in 2012 at around 18% and fell very sharply to just over 5% in 2015 before recovering somewhat. Investment growth and the property sector mirrored this fall but have remained in a much more subdued, post-crisis-type state since then. Its stock of hard currency reserves still stands at USD 3 trillion but could fall further as the current account moves into deficit territory.

Diagram 9.1 shows Japan’s outperformance over almost every advanced economy when it comes to output per worker. Diagram 9.1Japan’s GDP per worker has outperformed that of its peers handsomely (Source IMF) Rising firm productivity, as a matter of fact, is one of two competing hypotheses to explain Japan’s exit from its lost decade. A surge of exports in 2000 and its contribution to GDP growth for the rest of the decade is the other. Ogawa et al. (IMF 2012) decompose the export function into two parts—one that depends on the income stream of Japan’s trading partners and the other that is a function of the ‘total factor productivity’ of firms as well as input costs. Total factor productivity, they find, accounts for around 50% of the variation in export growth whereas incomes among trading partners account only for about 20%.

pages: 408 words: 108,985

Rewriting the Rules of the European Economy: An Agenda for Growth and Shared Prosperity
by Joseph E. Stiglitz
Published 28 Jan 2020

We emphasize, over and over, that rising GDP does not necessarily indicate greater well-being, particularly when we examine different slices of the population. There is no plausible moral or economic argument for a market economy whose growth benefits only a small number of people while excluding the great majority from its fruits. The sad truth is that Europe is not performing well in this century. The three charts in Figure I.1 show GDP growth from 1980 to 2015 for the Eurozone, the United States, and the European Union. There was no increase in growth rates in the Eurozone after the creation of the euro. In fact, even before the onset of the financial crisis, growth was lower than in prior decades. Moreover, Eurozone countries responded to the crisis less effectively than the non-Eurozone countries.

As we shall discuss at length, the euro eliminated key mechanisms for adjustment, which amplified the effects of crises such as the 2008 financial meltdown and brought on the sovereign debt disaster that followed. Figure I.1a: Eurozone * * * Figure I.1b: United States * * * Figure I.1c: European Union * * * FIGURE I.1: GDP GROWTH FROM 1980 TO 2015 For each of the regions—Eurozone, United States, European Union—the figures show three lines. The black line is actual GDP (WEO, 2018). The gray dotted line is the fitted exponential trend on GDP data for 1980–2000. The solid gray line is an extrapolation of an exponential trend.

Three propositions are at its core: the economy is not an end in itself but a means; a country’s economic growth, on its own, will not necessarily translate into the well-being of all (or even most) of its citizens; and finally, the government can make a difference both in enhancing sustainable growth and ensuring that the fruits of that growth are equitably shared. A variant of the theory of trickle-down economics holds that high growth will redound to the benefit of all and therefore that economic policy should be directed at maximizing growth. The evidence of the past 40 years has thoroughly discredited this idea. A high rate of GDP growth does not necessarily mean that most within the country see an increase in their living standards. Poverty can increase even when output rises, which is happening in large parts of Europe. A well-functioning society has to have some mechanisms for ensuring that the fruits of the economy are appropriately shared.

pages: 274 words: 60,596

Millionaire Teacher: The Nine Rules of Wealth You Should Have Learned in School
by Andrew Hallam
Published 1 Nov 2011

William Bernstein, using data from Morgan Stanley’s capital index and the International Monetary Fund, reported in his book, The Investor’s Manifesto, that fast-growing countries based on gross domestic product (GDP) growth paradoxically have produced lower historical returns than the stock markets in slower growing economies from 1988 to 2008. Table 8.2 shows that when we take the fastest growing economy (China’s economy) and compare it with the slowest growing economy (the U.S.) we see that investors in U.S. stock indexes would have made plenty of money from 1993 to 2008. But if investors could have held a Chinese stock market index over the same 15-year period, they would not have made any profits despite China’s GDP growth of 9.61 percent a year over that period.

Table 8.2 Growing Economies Don’t Always Produce Great Stock Market Returns Source: The Investor’s Manifesto by William Bernstein Country 1988–2008, After Inflation Annualized GDP Growth (in Percentages) Average Stock Growth (in Percentages) United States 2.77 8.8 Indonesia 4.78 8.16 Singapore 6.67 7.44 Malaysia 6.52 6.48 Korea 5.59 4.87 Thailand 5.38 4.41 Taiwan 5.39 3.75 China 9.61 −3.31 (as of 1993) Similarly, as revealed in Table 8.3, Yale University’s celebrated institutional investor, David Swensen, warns endowment fund managers not to fall into the GDP growth trap either. In his book written for institutional investors, Pioneering Portfolio Management, he suggests from 1985 (the earliest date from which the World Bank’s International Finance Corporation began measuring emerging market stock returns) to 2006, the developed countries’ stock markets earned higher stock market returns for investors than emerging market stocks did.

pages: 422 words: 113,830

Bad Money: Reckless Finance, Failed Politics, and the Global Crisis of American Capitalism
by Kevin Phillips
Published 31 Mar 2008

He singled out the GDP deflator, which alleged that inflation grew at a rate of 1.33 percent during the April-June quarter, which would be the lowest in five years—this while even CPI reports showed a much higher rate.56 A year earlier, Peter Schiff of EuroPacific Capital had wryly noted that Washington orchestrated its latest growth rate only by declaring a mere 8⁄10 of 1 percent inflation level, the lowest deflator claim since the Eisenhower era.57 The reader must keep in mind the importance of an honest inflation deflator. For example, assuming nominal GDP growth of 3 percent, a 1 percent deflator would mean 2 percent real growth, whereas a 5 percent deflator would turn real growth negative by 2 percent. Iconoclast John Williams, who watches the federal data for ShadowStats, calculated in late 2008 that real GDP growth had been negative since 2006.58 Critical characterizations could fill a book. Bloomberg columnist Caroline Baum noted that the two economic performance reports published more or less simultaneously by the federal Bureau of Economic Analysis—the GDP and gross domestic income (GDI)—should resemble each other but recently have displayed a conspicuous overperformance by GDP.

What remained, however, was powerful data on how hedonic calculations had falsely ballooned computer sales and thereby artificially enlarged GDP growth. Steve Milunovich, a well-regarded computer analyst at Merrill Lynch, explained in a 2004 report that the federal Bureau of Economic Analysis, responsible for ascertaining the gross domestic product each quarter, had stopped reporting the real computer hardware shipment figure that was used to calculate GDP growth. The government, it seemed, decided that between the second quarter of 2000 and the fourth quarter of 2003, real tech spending had risen by $111 billion, from $446 billion to $557 billion.

He added that CPI data hadn’t reflected the sharp run-up in the housing market before the 2007 credit crisis, that food and energy prices shouldn’t be excluded when judging inflation’s long-run trend, and that “we’re much more inclined to say there are improvements in quality” rather than rising inflation.51 This was a concern for global investors, because GDP growth data, as well as the CPI, pivots on inflation or its lack. If such complaints rarely stirred partisan divisions, that was because of a forty-year record of both Republican and Democratic presidents abetting what outsider critic John Williams called “polyanna creep”—making federal economic data more friendly to incumbents and cheerleaders (see pp. 80-89).

pages: 346 words: 90,371

Rethinking the Economics of Land and Housing
by Josh Ryan-Collins , Toby Lloyd and Laurie Macfarlane
Published 28 Feb 2017

We will show how deregulation of the financial sector led banks to transform into property lenders and contribute to excessive house price inflation. Credit liberalisation also led to land prices and property wealth coming to play an important role in determining consumption demand, the main contributor to economic growth in advanced economies today (around two-thirds of GDP growth is driven by domestic consumption in the UK). This process has led to the emergence of a feedback loop, with ever rising house prices and ever increasing household debt making our economy highly vulnerable to economic shocks. 5.2 House and land prices, income and bank credit The UK has experienced some of the highest increases in house prices of any advanced economy over the past two decades and considerable house price volatility (swings in prices).

Similar results have been found in studies of single countries, including Japan (Werner, 1997), the United Kingdom (Ryan-Collins et al., 2016) and the United States (Bezemer, 2014). Another study of thirty countries in the period 1960–2012 found that an increase in the household debt-to-GDP ratio over three years predicts lower subsequent GDP growth and higher unemployment, features that IMF and OECD forecasters failed to predict (Mian et al., 2015). Mortgage credit may be useful as a form of spreading the cost of a large durable consumer good over a longer period. However, mortgage credit will not support increased growth in the economy unless it enables residential investment, home building or consumption.

No longer able to borrow to fund their existing loan repayments, investors began to rapidly sell off properties loaded with debt, leading to a rapid decline in real estate values, followed by a collapse in stock prices. Banks, firms and households deleveraged and demand was depressed (Koo, 2011). The crash appears to have permanently lowered real GDP growth per capita. This averaged 3.7% in the twenty years leading up to 1991 but has been under 1% since, with inflation negative in the majority of years that have followed. Other Asian economies experienced similar real estate related bubbles in the early 1990s, with a noticeable feature being that increases in real estate prices pushed up stock prices which further boosted confidence and fed back into increases in land values (Kindleberger and Aliber, 2005, pp. 29–30).

The End of Accounting and the Path Forward for Investors and Managers (Wiley Finance)
by Feng Gu
Published 26 Jun 2016

Commenting on the October 2014 market volatility (the S&P 500 decreased 6 percent in mid-October 2014, yet ended the month in record high), an opinion piece in the Wall Street Journal reminded readers: . . . the volatility in the macro (real) economy is very low. . . . [L]ooking back over the entire business cycle, the volatility of GDP growth during the past four years is comparable to the previous two business-cycle expansions. . . . To describe similar phenomena in the 1990s, about a decade ago economists coined the term the Great Moderation—and its back in use today.8 Thus, we experience a great moderation rather than rising turbulence.

For quite some time, leading economists like Blanchard and Simon (2001), noticed “a long and large decline in US output volatility over the last half century.” In particular, economists recorded a shift in the mid-1980s toward stabilization of economic activity: It has been estimated that, since 1984, the variance (a statistical measure of volatility) of GDP growth has declined by an astounding 50 percent. The search for a full understanding of this phenomenon goes on, but stabilizing factors like improved inventory management by companies, better control of firms’ operations brought about by information technology, smarter government interventions in crises, and the increased use by companies of stabilizing (risk hedging) financial innovations are among the volatility-reducing factors already identified.

A 2014 study by Furman shows that the pre-crisis declining volatility was resumed after the financial crisis (“ . . . but overall volatility still appears to be at a lower level than in the past.”)9 So, our documented declining usefulness of financial information cannot be blamed on an increasingly turbulent business environment. If anything, this environment is getting more tranquil. While being a major determinant of companies’ volatility, overall economic activity (say, GDP growth) isn’t the only factor affecting corporate turmoil. Industry-specific technological disruptions, resource price 72 MATTER OF FACT changes, and abrupt shifts in consumers’ demand, among other factors, also contribute to business volatility. Perhaps these micro volatility factors diminish accounting usefulness?

pages: 279 words: 90,888

The Lost Decade: 2010–2020, and What Lies Ahead for Britain
by Polly Toynbee and David Walker
Published 3 Mar 2020

The former was ruled out, until political desperation later demanded it; the latter were forbidden because higher taxes would affect the Tories’ core vote. Cutting spending and, specifically, the incomes of poorer families had a strong and immediate downwards push on demand, which continued through to 2020. Public investment was slashed; the rebuilding of schools and hospitals was stopped in its tracks. This hit GDP growth directly. Any pick-up after the recession was delayed, and the annual rate of growth never got above 2 per cent. Austerity had continuing effects, too, which after 2016 were compounded by Brexit. The UK fell from top of the G7 countries for growth in 2015 to bottom. No sooner was a key 2010 promise realised – nine years on, public sector net borrowing (the budget deficit or gap between receipts and revenues each year, allowing for investment) fell, to 2 per cent of national income – than its political pain proved too great and it was promptly abandoned.

Among the reasons the Tories succeeded in both 2010 and 2015, and became the biggest party in 2017 despite continuing austerity, was a public reluctance to pay more. By 2018 tax as a proportion of GDP was almost exactly the same as in the last of Labour’s ‘normal’ years, 2007. Because there had been a small amount of GDP growth since, this meant that people and firms were paying more tax in total at the end of the decade. Average earnings, while not rising much, tipped over the threshold, so that a rising proportion of income was taxed at the higher rate. Even though millions paid tax day in, day out, it was not much understood.

How well a child did (let alone their enjoyment of school) depended on home income, the parents’ jobs, their educational level and what they owned – in other words, on class. Here was a scary conclusion, which will define Britain in the 2020s: inequality, not education, was a principal part of the explanation for a lack of productivity. Of course, school and college made a difference. That was shown by the association between education spend and GDP growth. International and historical comparisons suggested the UK should be spending more than 5 per cent of its GDP on education; the figure was only 4.3 per cent in 2018. Worse, core education spending was falling; schools were poorer. The government, typically, tried to massage the figures, but the impeccably honest IFS calculated that per school pupil spending in England fell by 8 per cent between 2010 and 2018.

pages: 312 words: 91,835

Global Inequality: A New Approach for the Age of Globalization
by Branko Milanovic
Published 10 Apr 2016

The graph also shows the fairly strong position of the United States, which, rather against the grain of what is assumed nowadays, experienced very high growth (more than 30 percent per decade) and a very strong reduction in inequality (more than 3 Gini points per decade)—simultaneously. FIGURE 2.19. Relationship between change in inequality and growth during the downward portion of the first Kuznets wave This graph shows average per capita GDP growth rate per decade during the period of the Great Leveling on the horizontal axis, and on the vertical axis, the average decline in Gini points per decade during the same period. Countries that had higher growth rates generally also had larger declines in inequality. Data sources: See sources for Figures 2.10–2.13, 2.15, and 2.18.

This long period of some 150 years involved, as we have seen, an increase in inequality, peaking variously between the late nineteenth century and the early twentieth, and then decreasing more or less continuously during the next seventy or eighty years. Thus the upward and the downward portion seemed to have lasted approximately the same amount of time. FIGURE 2.20. Relationship between change in inequality and growth during the upward portion of the second Kuznets wave This graph shows the average per capita GDP growth rate per decade during the period of the recent upswing in inequality (starting around 1980) on the horizontal axis, and on the vertical axis, the average increase in Gini points per decade during the same period. All countries experienced increases in inequality, and those with the greatest amount of increase (the UK, USA, and Italy) registered greater increases in Gini points per unit of growth.

The top bureaucracy controls the judiciary but allows some policy flexibility among regionally decentralized units, such as provinces and even counties. The combination of centralization with local flexibility has been used, with huge success, to motivate competition between lower-level units in achieving material targets (like GDP growth rates) and to spur experimentation with various economic policies and forms of ownership. The system has allowed experimentation ranging from the Special Economic Zones in the 1980s to the Shanghai bourse in recent years. But while this political structure has performed very well in the past half century, it contains a number of vulnerable points.

pages: 304 words: 90,084

Net Zero: How We Stop Causing Climate Change
by Dieter Helm
Published 2 Sep 2020

It relies on the borrowing increasing spending, multiplied through the economy. It is the sort of argument the right in the US advanced in advocating unfunded tax cuts under Ronald Reagan, George W. Bush and now Trump. This is a conventional Keynesian GDP growth approach, and there are lots of reasons to be sceptical about its likely success and the impact of the debts that result. If the general problem with GDP growth is that consumption is unsustainably high, it is hard to see how boosting consumption through borrowing is going to make the economy greener. The second problem comes with who gets to inherit the debt. It is the next generation, the young, who will get the pollution we are causing now and that we have already caused, and the debts to pay for clearing it up.

It shows the scale of the transformation. In 1990 Chinese GDP was around US$360 billion. By 2018 it was $13.6 trillion. That is 38 times bigger. To get your head around these astonishing numbers, the UK’s GDP in 1990 was just over $1 trillion, and now it is just over $2.6 trillion. With all this GDP growth comes pollution, and in China’s case pollution on a planetary scale. Every other country in the world pales into insignificance in terms of added environmental pollution since 1990. The Europeans deindustrialised, and the US went sideways. From around 2005, the US had natural gas to substitute for coal, and hence it could both grow and limit its carbon emissions.

It will need to: the existing technologies cannot crack the climate change problem on their own and feed the world. We will need to open up the light spectrum, invent more new materials, and peer into the genetic box to transform food production. That is what will drive sustainable economic growth. The environmentalists are right to argue that current GDP growth cannot be sustained, but that is because GDP measures the wrong (and often highly polluting) things.[7] There needs to be a rebasing, to a sustainable consumption level, and then growth can continue as ideas, science and technology increase human possibilities. What is the best way to deliver this sustainable economy?

pages: 701 words: 199,010

The Crisis of Crowding: Quant Copycats, Ugly Models, and the New Crash Normal
by Ludwig B. Chincarini
Published 29 Jul 2012

The prior recessions were also shorter lasting than the most recent one. TABLE K.4 Real GDP Growth and Per Capita Growth When we compute real GDP growth per capita and per laborer, which gives us an indication of how individuals in the United States are doing, the growth rates are much smaller. Remember, with a growing population, the increased output must be shared with more people. Historically, the growth per capita of the United States has been about 1.88% and during the recession it dropped by 3.86%. It is also interesting to observe what happened to GDP growth after the 2008 recession and compare it to other recessions.

Businesses as well as consumers were afraid to invest in real estate due to its overvaluation and were also weary of a fragile economy and wanted to be more frugal. Figure K.5 Consumption and Investment Components of GDP Growth During and After the Financial Crisis Source: BEA. Although many of us still feel that the economy is in a recession, the recession officially ended in the second quarter of 2009. How did the economy come out of the recession? We already mentioned the average of GDP growth since the crisis was positive. But what types of growth contributed to the positive growth in output in the United States? Looking at Figure K.5, one can see that in the third quarter of 2009, there was a large bump in durable good spending.

Research Lehman’s research business was among the most elite, especially in fixed income, which distributed its reports all over the world. The group did quantitative, qualitative, economic, strategic, and trade-related research in equity and fixed income. A typical economic research piece might have discussed the economies of one or more countries, offering forecasts about inflation, GDP growth, and other important economic fundamentals. A typical trade research piece might have offered ideas on how to profit from a market anomaly, such as situations in which two companies are mispriced but should converge to the same value, or discussed how to use a foreign-exchange option to hedge foreign-currency risk.

pages: 585 words: 151,239

Capitalism in America: A History
by Adrian Wooldridge and Alan Greenspan
Published 15 Oct 2018

Advances in material science have allowed us to produce lighter cars (per unit of horsepower) and more efficient buildings. By our estimates, the decline in materials used per dollar of real GDP added 0.26 percentage points a year to real GDP growth between 1879 and 2015. That added 40 percent to real GDP by 2015. The annual gains were markedly greater from 1879 to 1899, where effectiveness added 0.52 percentage points a year to real GDP growth. That added 10.6 percent to the level of real GDP in 1899. An additional aspect of creative destruction is the reduction in transportation costs. Cold-rolled steel sheet is worth more on a car located in a car dealership than rolling off a steel mill in Pittsburgh.

With globalization the height of fashion, a growing number of emerging-market countries, most notably China, followed the export-oriented economic model of the Asian Tigers (Hong Kong, Singapore, South Korea, and Taiwan): combining cheap and well-educated workforces with first-world technology and management methods, and protecting business with a stable economic policy and the rule of law. The result was an explosion of economic growth that sent shock waves through the global economy: real GDP growth in the developing world was more than double real GDP growth in the developed world from 2000 to 2007, as global multinationals opened facilities in the emerging world and emerging-market companies sprang from nowhere. The International Monetary Fund estimates that the world added about 500 million workers to the export-oriented economy between the fall of the Berlin Wall and 2005.

One leading business historian has gone so far as to argue that “no causal relationship between the two events of late October 1929 and the Great Depression has ever been shown.” This is unconvincing. Econometric analysis suggests that, by itself, change in asset prices has a significant effect on GDP, accounting for nearly 10 percent of GDP growth in the postwar years.8 Given that stock and asset holdings relative to GDP were roughly the same in the years 1927 to 1932 as in the postwar years, the collapse of the stock market must have had a significant “wealth effect.” The 2008 crisis was another reminder that financial crises impose damage on the general economy if they are accompanied by toxic assets that are highly leveraged.9 In the 1920s stocks provided the toxic assets and call money funded by brokers’ loans provided the leverage.

pages: 179 words: 43,441

The Fourth Industrial Revolution
by Klaus Schwab
Published 11 Jan 2016

“Secular stagnation” describes a situation of persistent shortfalls of demand, which cannot be overcome even with near-zero interest rates. Although this idea is disputed among academics, it has momentous implications. If true, it suggests that global GDP growth could decline even further. We can imagine an extreme scenario in which annual global GDP growth falls to 2%, which would mean that it would take 36 years for global GDP to double. There are many explanations for slower global growth today, ranging from capital misallocation to over indebtedness to shifting demographics and so on. I will address two of them, ageing and productivity, as both are particularly interwoven with technological progress.

Take carbon emissions, a major negative externality, as an example. Until recently, green investing was only attractive when heavily subsidized by governments. This is less and less the case. Rapid technological advances in renewable energy, fuel efficiency and energy storage not only make investments in these fields increasingly profitable, boosting GDP growth, but they also contribute to mitigating climate change, one of the major global challenges of our time. Third, as I discuss in the next section, businesses, governments and civil society leaders with whom I interact all tell me that they are struggling to transform their organizations to realize fully the efficiencies that digital capabilities deliver.

Falling Behind: Explaining the Development Gap Between Latin America and the United States
by Francis Fukuyama
Published 1 Jan 2006

Before proceeding, it would be pertinent to examine the evolution of per capita income by looking at the growth of total gross domestic product (GDP) and of population (see table 5.2). Note that the period 1820–1870 was disastrous for Latin America.19 On the other hand, between 1871 and 1980, total GDP growth in Latin America was slightly higher than in the United States.20 The faster GDP growth in the United States between 1700 and 1870 was accompanied by a much faster increase in population, in large part due to immigration.21 From 1930, population growth was higher in Latin America, but growth of table 5.1 Per Capita Incomes, 1700–2000 Brazil Mexico Latin America* United States Latin America: United States 1700 1820 1870 1930 2000 459 568 521 527 0.99 646 759 701 1257 0.56 713 674 756 2445 0.31 1048 1618 1873 6123 0.31 5556 7218 5844 28129 0.21 *Population weighted averages for countries for which data are available: 17 countries in 1700 and 1820 (excluding Cuba and Dominican Republic); Brazil, Mexico, Argentina, Uruguay, and Venezuela in 1870; 13 countries in 1930; 18 in 2000.

The retreat of the Spanish reduced access to some markets and technology and collapsed the internal customs unions that had existed within their empire, all of which was very costly in terms of growth. The period from 1870 to 1970 was, in contrast, a period of modest catching up for most of Latin America. In the earlier part of that period, until 1929, per capita GDP growth was actually higher there than in the United States, as it was again in the period from 1950 to 1970. Throughout the region, post-independence regimes slowly consolidated, and there were prolonged periods in which both the internal and external environments were relatively benign. Growth from 1870 to 1970 was, of course, dramatically interrupted by the Great Depression after 1929 and the outbreak of World War II.

That country was Puerto Rico, which had free access to the U.S. market and which, in terms of income distribution and growth, outperformed both Argentina and Mexico in the 1950s.7 A second group of countries dominated the overall statistical results for Latin America because of the disproportionate size of their economies and, in those years, their solid economic growth patterns: Brazil and Mexico. In both countries, sustained GDP growth at more than 6 percent annually for the better part of a quarter century exceeded that of Germany and Italy during the same period, was much faster than that of the United States, and brought about major transformations in their internal economic structures.8 However, both Brazil and Mexico were less successful in generating prosperity than their European and East Asian counterparts, though more successful vis-à-vis the Explaining Latin America’s Lagging Development 77 United States, given the higher population growth rates in Brazil and Mexico.

Money and Government: The Past and Future of Economics
by Robert Skidelsky
Published 13 Nov 2018

Capital mobility and banking crises, 1900–2010 333 63. Current account balances, pre-crash: China and USA 334 64. Current account balances, pre-crash: Eurozone core and periphery 335 65. Total cross-border capital inflows, 1990–2011 337 66. UK public investment as a share of total investment, 1948–2011 354 67. GDP growth in the OECD, 1986–2016 369 xv This page intentionally left blank Preface We are at a junction where the whole of macroeconomic policy is up for grabs. Everything we thought settled by the Great Moderation of the fifteen pre-recession years, a period of exceptional stability in Western economies, has been thrown into turmoil by the scale of the collapse of 2008–9 and the feebleness of the recovery from it.

‘If a central bank had a clear inflation objective, and established a reputation in achieving it, that would anchor expectations and reduce the impact of shocks on the macroeconomy.’69 To illustrate how central banks decided on policy in the pre-crash years, we can use a brief, simplified version of the model used in Woodford’s Interest and Prices.70 The model consists of three parts: 1. An expectational IS equation relating current output positively to expected future output and negatively to the real interest rate; if GDP growth is expected to be strong and interest rates to be low, then output will be high. 2. A New Keynesian Phillips Curve, linking current inflation to expected future inflation and the output gap. If inflation in the future is expected to be high, then (for example) workers will demand increases in nominal wages, pushing up current inflation.

Between September and December 2008, the Federal Reserve and the European Central Bank made available €2 trillion of credit to banks at 1 per cent interest, and started buying government and commercial debt on a small scale. In the fourth quarter of 2008 and first quarter of 2009, GDP in industrial nations fell at an annualized rate of 7–8 per cent. GDP growth slowed down in China and Asia, the main transmitters of the crisis to the developing world being the collapse in their terms of trade (including commodity prices) and paralysis of private capital markets. With an 8 per cent GDP drop, Russia experienced the fastest and steepest collapse in the G20 world. 4.

pages: 336 words: 95,773

The Theft of a Decade: How the Baby Boomers Stole the Millennials' Economic Future
by Joseph C. Sternberg
Published 13 May 2019

That was years after the Great Recession officially ended in 2009, and a longer lag than the American economy had experienced after any previous recession during Millennials’ lifetimes.28 Even after recovering the ground lost in the recession, the economy hardly roared back to life. GDP growth averaged around 2 percent per year in the first five years of the recovery. This was unprecedented compared to previous recessions, when the economy had rebounded much more quickly, with growth rates topping 3 percent in the early years after the downturn.29 One percentage point might sound undramatic, but it makes an enormous difference in an economy America’s size—hundreds of billions of dollars in output that never happened. And because GDP growth compounds, the slow recovery put America on a permanently lower trajectory.

Labor productivity has started to grow faster during recessions—and yet that productivity gain doesn’t trigger an economic recovery. Millennials saw this firsthand after 2009, where an early growth spurt in output per hour worked (4.6 percent in 2008 and 3.3 percent in 2009) failed to spark anything more than an anemic recovery in overall GDP growth after the Great Recession.33 The other surprise, meanwhile, is that the labor share—the proportion of GDP paid out to workers in compensation—has generally fallen over the past fifty years, despite occasional improvements from time to time. It plunged to an average of 60 percent in the five years after the Great Recession and so far shows little sign of improving again.34 Conventional economic theories had always assumed this labor share would be roughly stable—that it might change from time to time but would return to its average level over a period of a few years.

Because Japan’s total population already is shrinking, achieving economic growth now would require much faster and sustained increases in productivity per worker than any developed economy has managed in recent decades, to make up for the decrease in workers. Most “plans” for Japan to grow its way out of debt generally figure that an average annual GDP growth rate of around 3 percent will do the trick, which is fanciful for an economy like Japan’s and especially so when governments in Tokyo have spent decades failing to deregulate domestic markets to stimulate more productivity-enhancing investment. That leaves one last tax Japan can try to impose on its Millennials to pay its bills: inflation.

pages: 238 words: 73,121

Does Capitalism Have a Future?
by Immanuel Wallerstein , Randall Collins , Michael Mann , Georgi Derluguian , Craig Calhoun , Stephen Hoye and Audible Studios
Published 15 Nov 2013

A contingent conjunction of different economic, ideological, and political causal chains (not military in this case) still threatens to cascade into a much worse “double-dip” recession. Again, however, the Great Recession spread very unevenly around the world. From World Bank data on GDP growth we can see that almost every country had a difficult 2008 or 2009. In this brief phase the crisis was indeed global. It then deepened in the United States, and across Europe as far east as Russia and its eastern neighbors, and in some poor indebted countries. But by 2010 numerous countries had bounced back to achieve their highest GDP growth rates of the 21st century—including important countries like Brazil, Mexico, Turkey, Nigeria, Canada, Malaysia, Korea, and Singapore.

If taxation is levied on the total throughput of nonrenewable resources and not on either business or labor in general, as at present, then that would encourage the hiring of labor. This could be the next wave of creative destruction. It would certainly destroy the fossil fuel industries. Not only capitalism has to be reined in. We have to also rein in the treadmill of the nation-state’s obsession with growth. All nation-states measure national success by GDP growth and yet this increases environmental degradation. That means reining in political elites who believe that they can only retain power by promoting short-term growth within the period of a single electoral cycle. A low-emissions regime would certainly reduce growth in the short run, while hopefully increasing it more in the long run, given that in the long run the do-nothing “business as usual” scenario will prove disastrous for the planet and its inhabitants.

Of course, if there is an enduring global crisis of capitalism, and world production heads downward, then (after a delay during which already “baked in” emissions will continue upwards) emissions will stop growing and even begin to decline. Conversely, if capitalism, nation-states, and consuming citizens are reined in, then GDP growth will decline through global consensus and everyone will be content with almost zero growth. Every cloud has a silver lining! But if action is not timely, and climate disaster begins to strike hard, the optimistic scenario would be that at that point the world’s states would take coordinated action to impose severe restrictions on capitalism, states and citizens.

pages: 270 words: 73,485

Hubris: Why Economists Failed to Predict the Crisis and How to Avoid the Next One
by Meghnad Desai
Published 15 Feb 2015

Jim O’Neill of Goldman Sachs coined the acronym BRIC to represent Brazil, Russia, India and China as a group of four high-growth economies. Later, South Africa was added to the list to make it BRICS. The creation of the acronym signified the shifting center of global economic activity eastward and southward. China had notched up double-digit GDP growth for nearly 20 years by then and had emerged as a potential giant soon to rival Japan and the US in size of total GDP. India had also woken up from its four decades of slow, so-called “Hindu rate of growth” and was growing at high single-digit rates. These were the two economies with low to moderate per capita income but a billion plus in population each.

These were the two economies with low to moderate per capita income but a billion plus in population each. Brazil and Russia were economies rich in land and minerals that were beginning to realize their potential. But there were other economies – Indonesia, Malaysia, South Korea – that were not far behind in the vigor of their GDP growth. Three important things happened the significance of which both singly and jointly was not recognized by economists in academia or in policy-making circles. Firstly, the entry of China and other Asian countries in the global economy as exporters of manufacturing goods had shifted the supply curve of manufactures to the right.

Raghuram Rajan, who was Chief Economist of the IMF and a professor at Chicago, did warn in 2005 that there were fault lines in the global financial architecture which financial innovations might expose. But he was dismissed as a “Luddite.” This was an amazing situation, with low inflation, low interest rates and plenty of credit. But then another aspect of globalization impinged on the world economy. GDP growth accelerated in China and this put pressure on raw material prices, especially oil prices. The Fed saw signs of impending inflation and US interest rates went up to 5 percent by 2007. This was the classic Wicksellian situation. The market rate of interest had been so low that investments with even a modest rate of return – a low natural rate – had become profitable to invest in.

pages: 555 words: 80,635

Open: The Progressive Case for Free Trade, Immigration, and Global Capital
by Kimberly Clausing
Published 4 Mar 2019

For those born in the 1980s, only half do.1 Figure 2.1: Growth in US Median Household Incomes Lags Behind GDP Per Capita Notes: Both series are indexed so that 1984 = 100. The median shows the typical household in the middle of the economy’s distribution of income. Unlike averages, medians are not affected by large incomes at the top of the distribution. Data source: Federal Reserve Economic Data. How does so much GDP growth occur without benefiting the typical worker? In short, the growth has been accompanied by increasing inequality. This was not always the case. Pretax income growth over the period 1946 to 1980 exceeded 100 percent for the bottom 90 percent of the population, and the percentage growth in incomes was actually lower for the richest members of the population.

This chart follows the same method as a widely cited 2004 paper by economists David Dollar and Aart Kraay, who classified nations as mature-economy “rich countries,” developing-economy “globalizers,” or developing-economy “non-globalizers” and calculated the average of each group’s real per-capita GDP growth over four decades. Here, we update their findings using World Bank data.13 The globalizers among the developing economies consistently outperform the non-globalizers in terms of economic growth and, as shown in the next chart, employment. To be sure, correlation is not causality—but if trade were harming countries’ economic growth or job prospects, we would expect to see very different patterns in these data.

Comparing these lists reveals the increased profitability of the world’s largest companies in recent years. From the 2004 to the 2018 list, combined profits of the top two thousand companies increased over 400 percent, while sales of these companies increased about 200 percent. Although the sales of the top two thousand global firms increased at a rate commensurate with world GDP growth over this period, profits increased much faster—despite the collapse of profits in the years surrounding the Great Recession. By 2017, the Forbes Global 2000 collectively made a profit of about $3.2 trillion on $39 trillion in sales. There is substantial evidence that market concentration is on the rise.

pages: 286 words: 79,305

99%: Mass Impoverishment and How We Can End It
by Mark Thomas
Published 7 Aug 2019

What the data show is that the period from 1945 up to about 1980 was indeed a Golden Age of Capitalism, but that it has been followed by thirty-five years of poor results on almost every measure. Even the much-reviled 1970s were better than the ten years from 2007–17. During the 1970s, average real GDP growth in the UK was just over 2 per cent; in the last ten years it has been only just over 1 per cent. If it comes to economic performance – astonishingly – going back to the 1970s would be a big improvement. From 1980–2015, we ran a thirty-five-year experiment with the economy, testing the system of Market Capitalism.

And this is despite the fact that real GDP per capita has grown by 17 per cent over that same period4 – in other words, most people have received a less than 0 per cent share of the benefits of economic growth. When they might reasonably have expected to be 17 per cent better off, they have instead found that they are around 20 per cent worse off. That’s a 37 per cent difference over just 15 years. Politicians of all parties (and in all countries) fixate on GDP growth. The media pretty much agrees, too – it’s taken for granted that if a political party can deliver growth in GDP, then they’re doing a good job… for everyone. The fact that it is entirely possible for real GDP to display dramatic growth, while at the same time most wage earners in the population see no benefit from it – in fact less than none – merits astonishingly little enquiry by the media.

In other words, if it is true at all, the Law of Marginal Productivity is true only in a highly technical sense that bears no relationship to the way in which it is normally understood – as meaning that market forces reward most highly those who contribute most to society. Once this becomes clear, the justification of huge differentials in income and wealth on the grounds of ‘meritocracy’ are exposed as a sham. Lastly, there is Okun’s Law. This states that change in the unemployment rate in an economy has a straight-line relationship to real GDP growth. Although Okun’s Law was derived from statistical observation, and therefore has some grounding in reality, it has not stood up well to long-term scrutiny. When Edward S. Knotek II of the Federal Reserve Bank of Kansas City examined the data, he found that: Okun’s Law has not been useful as a stable relationship, since its parameters have varied considerably over time and over the course of the business cycle.

pages: 303 words: 74,206

GDP: The World’s Most Powerful Formula and Why It Must Now Change
by Ehsan Masood
Published 4 Mar 2021

On the other hand, health and welfare spending fell to even lower levels than had been forecast.11 GDP had grown at a modest 2.5 percent.12 At the end of their first five-year experiment at pulling Pakistan’s people out of poverty by ramping up one of the components of GDP, Pakistan’s planners were none too satisfied. GDP growth of 2.5 percent was pretty poor, and so by the time Mahbub ul Haq had arrived in the Planning Commission, thinking had begun on the next five-year plan, which would take the country from 1960 to 1965.13 The planners stuck to their formula, again focusing most of the spending on farming and industry; with education, health, and welfare altogether occupying only 7 percent of the budget.14 The medicine worked, in that GDP duly increased by around 6 percent for the period of the second plan, from 1960 to 1965, with manufacturing growing by more than twice that rate.15 The young economists basked in the glow of fame and were tasked with preparing a third plan, largely along the same lines as the first two, although this time with a larger share given to social services.

He added, “The first priority was growth; the other issues had to take a secondary place. The commitment to a growth philosophy was so wholehearted that all other policies were subordinated to it.” And yet Haq and his advisers could also see that the raw numbers were masking a more complex picture. Several problems stood out: First, GDP growth rates in the east were lower than in the west, especially in manufacturing, which was concentrated in the west. Second, as we’ve seen, the original National Plan’s priorities to build hospitals and schools had been torn up. Third, the lack of a minimum wage and controls on trade unions meant there was no external incentive to enable wages to keep pace with inflation, which was leading to strikes.

And so Bhutan’s policy makers stepped back, something that the policy makers of very few countries do. At the same time, Bhutan’s policy makers discovered that they didn’t really need McKinsey. Bhutan’s national income in 2012 was around $3.5 billion. In 2007 it was around $1.6 billion, which amounts to an economic miracle of sorts. For the past decade, Bhutan’s rate of GDP growth has been averaging 7 to 8 percent each year, helping to lift the country into the lower rungs of middle-income nations. The population clearly has more money to spend. In the five years between 2008 and 2012, spending by households doubled to around $645 million. Government spending nearly doubled to $300 million in the same period.11 And so to the broader question: Can Gross National Happiness be exported to countries outside the Himalayan kingdom?

pages: 466 words: 127,728

The Death of Money: The Coming Collapse of the International Monetary System
by James Rickards
Published 7 Apr 2014

But if her earnings are held constant, and prices drop 5 percent, she has the same $5,000 increase in her standard of living, but the government cannot tax the gain because it comes in the form of lower prices rather than higher wages. Deflation increases the real value of government debt, making it harder to repay. If deflation is not reversed, there will be an outright default on the national debt, rather than the less traumatic outcome of default-by-inflation. Deflation slows nominal GDP growth, while nominal debt rises every year due to budget deficits. This tends to increase the debt-to-GDP ratio, placing the United States on the same path as Greece and making a sovereign debt crisis more likely. Deflation also increases the real value of private debt, creating a wave of defaults and bankruptcies.

State-controlled banks are funneling cheap money to state-owned enterprises that are wasting the money on overcapacity and the construction of ghost cities. Even more disturbing is the fact that this infrastructure investment is not only wasteful, it is unsustainable. Each dollar of investment in China produces less in economic output than the dollar before, a case of diminishing marginal returns. If China wants to maintain its GDP growth rates in the years ahead, investment will eventually be well in excess of 60 percent of GDP. This trend is not a mere trade-off between consumption and investment. Households deferring consumption to support investment so that they may consume more later is a classic development model. But China’s current investment program is a dysfunctional version of the healthy investment model.

Still, accepting the IMF conclusion that China needs to reduce investment by 10 percent of GDP, he writes: Let us . . . give China five years to bring investment down to 40% of GDP from its current level of 50%. Chinese investment must grow at a much lower rate than GDP for this to happen. How much lower? . . . Investment has to grow by roughly 4.5 percentage points or more below the GDP growth rate for this condition to be met. If Chinese GDP grows at 7%, in other words, Chinese investment must grow at 2.3%. If China grows at 5%, investment must grow at 0.4%. And if China grows at 3% . . . investment growth must actually contract by 1.5%. . . . The conclusion should be obvious. . . .

pages: 459 words: 138,689

Slowdown: The End of the Great Acceleration―and Why It’s Good for the Planet, the Economy, and Our Lives
by Danny Dorling and Kirsten McClure
Published 18 May 2020

This does not happen in China, India, Germany, or Argentina. This is unique to the English-speaking, oily countries—the US, the UK, and Australia—where the power of the fossil fuel interests is used to influence both politics and public opinion.”13 He might be heartened to see the slowdown shape of the current trend in GDP growth in the United States in figure 48. Look carefully at figure 48 and ask yourself in which year the relative rise was actually greatest. Absolute change was greatest in 1998 and 1999, and so that period stands out the most, given the way change is calculated here, from the year before to the year after.

The goods being discussed are the most high-tech that many consumers have ever owned, but what they do is not so essential that you must always have the latest version: While we anticipated some challenges in key emerging markets, we did not foresee the magnitude of the economic deceleration, particularly in Greater China. In fact, most of our revenue shortfall to our guidance [of estimated future earnings], and over 100 percent of our year-over-year worldwide revenue decline, occurred in Greater China across iPhone, Mac and iPad. China’s economy began to slow in the second half of 2018. The government-reported GDP growth during the September quarter was the second lowest in the last 25 years. We believe the economic environment in China has been further impacted by rising trade tensions with the United States. As the climate of mounting uncertainty weighed on financial markets, the effects appeared to reach consumers as well, with traffic to our retail stores and our channel partners in China declining as the quarter progressed.

His predecessors were worried about whether it was best to manufacture in China and what the risks might be. Cook is now increasingly worried about the country as a place where he will be able to continue to sell his products, about the competing products the Chinese may make, and especially about China’s slowing GDP growth. The timeline in figure 49 shows that China has rebounded from two very recent and almost identical growth per capita maxima, in 2010 and 2017 (both as measured in absolute terms). The relative rate of GDP per capita growth in China had three earlier recent maxima: 13.4 percent in 1984, 13.0 percent in 1992, and 14.8 percent in 2006.

pages: 772 words: 203,182

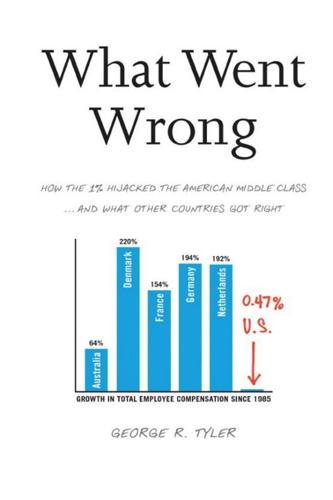
What Went Wrong: How the 1% Hijacked the American Middle Class . . . And What Other Countries Got Right
by George R. Tyler
Published 15 Jul 2013

Their nonpartisan experts expect the future maximum potential productivity growth rate to range around the 1.4–1.5 percent level, a rate barely one-half the level during the golden age.63 When combined with slowing population growth, the consequence of this mediocre productivity outlook is to significantly lower the ceiling on potential growth in US GDP. During the golden age, robust investment led to robust productivity growth, with America’s potential GDP growth ceiling averaging 3.9 percent from 1950–1973, as reproduced in Chart 23.1 from CBO statistics. But as investment and innovation dwindled in the Reagan decline, productivity growth descended to a lower plane, reducing the ceiling on potential GDP growth to an average of 2.3 percent from 2002–2011. Through at least 2017, the CBO is projecting a continued decline in the GDP growth ceiling to only 2 percent due to weakening productivity. Chart 23.1. Source: “What Accounts for the Slow Growth of the Economy After the Recession,” Congressional Budget Office, fig. 2, November 2012, http://www.cbo.gov/sites/default/files/cbofiles/attachments/43707-SlowRecovery.pdf.

During the 1990s, corporate compensation has shifted to relying substantially on stock options … leading first to the temptation to engage in accounting tricks during 1998–2000 to maintain the momentum of earnings growth, and then sheer desperation to cut costs in response to the post-2000 collapse in reported S&P earnings and in the stock market.”34 This new pattern explains why employment fell more than the GDP during the credit crisis and recession, and why job growth has been anemic during the rebound. The outcome is a new Reagan-era paradigm, where jobs gyrate more than the economy. It also means weak recoveries with unwarranted job cuts slowing consumer spending. This pattern is a direct outgrowth of shareholder capitalism: with employment and wages lagging GDP growth, much of the gain from a rebounding economy now flows to the business community. Economists Andrew Sum, Ishwar Khatiwada, Joseph McLaughlin, and Sheila Palma at Northeastern University found that in the first eighteen months since the recovery began in mid-2009, “Corporate profits captured a lopsided 88 percent of the growth in real income, while aggregate wages and salaries accounted for only slightly more than 1 percent.”35 And recall we learned earlier that the wages of jobs lost during the 2008–2009 recession were well above wages for new jobs created during the recovery in 2010–2012.36 In contrast, during the recovery in the early 1980s in the first days of the Reagan era, profits and wages both increased, with the portion going to higher profits representing only 10 percent of the combined increase.

Perot’s quixotic campaign for fiscal rectitude succeeded, in the sense that his presence on the ballot enabled the election of President Clinton, who did in fact balance the national accounts. In contrast to President Reagan, Clinton proved to be a fiscal tightwad, raising taxes and limiting spending as we have learned, to the extent that half of his budgets actually ended in surplus. Thanks in part to outside factors like robust GDP growth, President Clinton added virtually nothing to the debt. In fact, Clinton’s budgetary record is remarkable, with credit due to his Treasury Secretaries Lloyd M. Bentsen, Robert Rubin, and Lawrence H. Summers. It was a proud time to be a Treasury official. Despite the bloated national debt that he inherited, Clinton controlled spending and raised taxes sufficiently to set the nation on a course to entirely eliminate the national debt.

pages: 72 words: 21,361

Race Against the Machine: How the Digital Revolution Is Accelerating Innovation, Driving Productivity, and Irreversibly Transforming Employment and the Economy
by Erik Brynjolfsson
Published 23 Jan 2012

Twenty-four percent of respondents to a June 2011 Gallup poll identified “unemployment/jobs” as the most important problem facing America (this in addition to the 36% identifying “economy in general”). The grim unemployment statistics puzzled many because other measures of business health rebounded pretty quickly after the Great Recession officially ended in June 2009. GDP growth averaged 2.6% in the seven quarters after the recession’s end, a rate 75% as high as the long-term average over 1948-2007. U.S. corporate profits reached new records. And by 2010, investment in equipment and software returned to 95% of its historical peak, the fastest recovery of equipment investment in a generation.

We discuss ways to put this principle into practice, concentrating on ways to accelerate organizational innovation and enhance human capital. Conclusion: The Digital Frontier We conclude in Chapter 5 on an upbeat note. This might seem odd in a book about jobs and the economy written during a time of high unemployment, stagnant wages, and anemic GDP growth. But this is fundamentally a book about digital technology, and when we look at the full impact of computers and networks, now and in the future, we are very optimistic indeed. These tools are greatly improving our world and our lives, and will continue to do so. We are strong digital optimists, and we want to convince you to be one, too.

pages: 304 words: 80,143

The Autonomous Revolution: Reclaiming the Future We’ve Sold to Machines
by William Davidow and Michael Malone
Published 18 Feb 2020

Jones, “The Facts of Economic Growth,” in Handbook of Macroeconomics, vol. 2 (Elsevier, 2016), http://web.stanford.edu/~chadj/facts.pdf (accessed June 26, 2019); “U.S. Population, 1790–2000: Always Growing,” United States History.com, https://www.u-s-history.com/pages/h980.html; and “United States GDP Growth Rate,” Trading Economics, http://www.tradingeconomics.com/united-states/gdp-growth (accessed June 26, 2019). 18. Jones, “The Facts of Economic Growth.”. 19. “Turing Pharmaceuticals,” Wikipedia, https://en.wikipedia.org/wiki/Turing_Pharmaceuticals (accessed June 26, 2019). 20. Kathryn A. Francis, “U.S. Postal Service Workforce Size and Employment Categories FY1995–FY2014,” Congressional Research Service, October 21, 2015, https://fas.org/sgp/crs/misc/RS22864.pdf (accessed June 26, 2019). 21.

In the years to come, we will have to accept that not all productivity is created equal. The productivities to which we are all accustomed—that is, monetizable productivities—brought with them expansions in the GDP and a prosperity that was widely shared. By comparison, much of the productivity of the future will be nonmonetizable. Its effects may in fact slow down GDP growth and drive middle-class wages down even further. And the ratio between non-monetizable and monetizable productivity will only increase. For the past 250 years, the Industrial Revolution has created a deluge of monetizable productivity increases that were collectively responsible for one of history’s greatest economic free lunches.

That said, while numerous studies and theories discuss how economic inequality undermines democracy, incontrovertible scientific evidence to that effect is missing. The sociologists Kenneth Scheve and David Stasavage have gone so far as to assert that “simple conjectures … that wealth inequality leads to democratic failure are not supported by the evidence.”17 What we do know is that, for the last two decades, average annual GDP growth has slowed to a crawl, and wages have stagnated. This lack of expansion has exacerbated competition between groups and heightened resentment of immigrants. Meanwhile, the rise of the global economy and the creation of new financial tools (such as high-frequency trading algorithms) have massively rewarded a fraction of the citizenry, while the rest have fallen behind.

pages: 482 words: 117,962

Exceptional People: How Migration Shaped Our World and Will Define Our Future
by Ian Goldin , Geoffrey Cameron and Meera Balarajan
Published 20 Dec 2010

Macroeconomic studies of developed countries with significant foreign-born populations have consistently found that migration boosts and sustains growth. A recent longitudinal study of OECD countries found that increased immigration is accompanied by commensurate increases in total employment and GDP growth.12 A government-sponsored study in the UK found that migrants contributed about £6 billion to the national economy in 2006.13 George J. Borjas estimates that migrants make a modest net contribution of $10 billion a year to the U.S. economy, a figure that other economists have suggested is at the low end of the range.14 Between 1995 and 2005, 16 million jobs were created in the United States, and 9 million of them were filled by foreigners.15 During the same period, migrants made up as many as two-thirds of new employees in Western and Southern European countries.16 While economists agree that immigration produces net benefits for the economy, they debate how to measure these effects.

The most dramatic increases in emigration occur as economic growth in low-income countries leads to rising incomes, demographic changes, and better education, which together will help propel more people over borders. The World Bank's 2009 medium-term economic growth projections anticipate the fastest rates of real GDP growth in sub-Saharan Africa and in South and East Asian countries.28 While some policy analysts have proposed to boost trade, foreign direct investment, and aid to the least developed countries in order to slow migration, such policies are more likely to increase migration in the short to medium term.

Bracero program brain circulation patterns Brazil: in migrant decision-making models, social impacts of modern migration Brazil, historic migration influences: imperialistic commerce indentured labor during mass migration era, refugee policies slavery Britain: as future migration policy example future migration pressures in migrant decision-making model social impacts of modern migration, social welfare of modern migrants Britain, economic impacts of modern migration: fiscal costs, GDP growth rate overview, perceptions of wage/employment levels Britain, historic migration influences: agricultural emergence decolonization exploration activity, identification documents, imperialistic commerce indentured labor during mass migration era during post-World War II economic boom, race/ethnicity-based restrictions refugee policies slave trade trade network expansion between world wars Britain, modern regulatory channels: border control technologies detention centers economic policies, overview refugee flows, social categories Brown, Gordon Brown, Lester Brown, Oli Buddhism Bulgaria Burma/Myanmar Burundi, in refugee regulatory channel businesses, border control role Byng, Gustav Cairo Population Conference Cambodia Cameron, David Canada: as future migration policy example, future migration pressures in migrant decision-making model Canada, historic migration influences: exploration activity indentured labor during mass migration era, race/ethnicity-based policies refugee policies, between world wars Canada, impacts of modern migration: economic issues social issues social welfare of modern migrants Canada, modern regulatory channels: border control technologies economic policy approaches, refugee flows, social categories Cappadocia Carens, Joseph Caribbean countries: in economic regulatory channel future migration pressures, impacts of modern migration, in migrant decision-making model.

pages: 457 words: 125,329

Value of Everything: An Antidote to Chaos The
by Mariana Mazzucato
Published 25 Apr 2018

How different notions of value might affect the distribution of revenues between workers, public agencies, managers and shareholders at, say, Google, General Electric or BAE Systems, goes unquestioned. Third, in trying to steer the economy in particular directions, policymakers are - whether they recognize it or not - inevitably influenced by ideas about value. The rate of GDP growth is obviously important in a world where billions of people still live in dire poverty. But some of the most important economic questions today are about how to achieve a particular type of growth. Today, there is a lot of talk about the need to make growth ‘smarter' (led by investments in innovation), more sustainable (greener) and more inclusive (producing less inequality).19 Contrary to the widespread assumption that policy should be directionless, simply removing barriers and focusing on ‘levelling the playing field' for businesses, an immense amount of policymaking is needed to reach these particular objectives.

But when real-estate prices appreciate rapidly, as in the US and the UK before 2007 and in hotspots such as London even after the financial crisis, there are alarming implications for measuring. Rising house prices mean rising implicit rentals, and hence rising incomes when the implicit rental is included. The paradoxical result is that a house price bubble, perhaps caused by low interest rates or relaxed lending conditions, will show up as an acceleration of GDP growth. Why? Because households' services to themselves - as their own landlords, charging themselves implicit rentals - are suddenly rising in value, and that is counted as income which adds to GDP. By the same token, if you strip out those imputed rentals, GDP can be shown to have risen more slowly in the years before the financial crash than after 2009.33 Prostitution, Pollution and Production So national accountants' approach to valuation affects the production boundary, sometimes in intriguing ways.

This way of thinking reconciles the case for large financial markets with the high incomes paid to employees in financial services, because incomes supposedly reflect the huge benefits of financial services to the economy.32 From the perspective of marginal utility, therefore, the expansion of finance is highly desirable and should increase its value added, and hence its positive contribution to GDP growth,33 even though it was only a convenient decision to treat finance as productive in the national accounts in the first place.34 But it is impossible to understand the rise of finance without analysing the background dynamics which allowed it to thrive: deregulation and rising inequality. FROM CLAIMS ON PROFIT TO CLAIMS ON CLAIMS Commercial banks seem literally to have been given a licence to print money, through their ability to create money in the process of lending it, and to lend it at higher interest rates than they borrow.

pages: 180 words: 55,805

The Price of Tomorrow: Why Deflation Is the Key to an Abundant Future
by Jeff Booth
Published 14 Jan 2020

Countries rely primarily on different levers because the inputs compete against each other. GDP tells you how each country is managing the four inputs together. As a by-product of that, it also tells you what a government values more to drive their economy and jobs. Higher-income countries typically rely on consumer spending as a primary driver of GDP growth, while lower-income countries are more likely to depend on net exports. These inputs compete against each other: for example, in countries with higher incomes, consumer spending naturally increases, but because their jobs pay more, their exports to other countries are disadvantaged by being more expensive.

Tipping points can come from anywhere and can come quite suddenly, often with little warning of the cascading effects. But what happens when, instead of the monopoly being a business or a small part of an overall economy, the monopoly is our entire interconnected economic system? Our way of making money and our inflationary bias? Put the lagging GDP growth with illusionary asset inflation, plus an impossible-to-maintain rise of debt, against a backdrop of technology growing at an exponential rate, and the phase transition starts to come into focus. We will need a whole new way of seeing things and perhaps a whole new way of living. What is coming next in technology changes the rules in a way that too few understand. 3 It Is Hard to Think Differently We often look at previous generations or to other areas of the world and see examples of thinking that we find almost impossible to believe with our current knowledge.

At the same time, technology companies act quickly to implement more technology that removes jobs quicker, since they cannot compete with platforms otherwise. Unless global jobs and our economies expand at a rate that exceeds debt creation (which even at backwards-looking rates of progress seems impossible), the age of inflation is already over. We just don’t know it yet. It took $185 trillion of debt to produce about $46 trillion of GDP growth over the last twenty years. The growth rate would likely have been negative without all of that stimulus. How much so is impossible to tell. Asset prices would be far lower as well. (For all the Keynesians reading this, please refrain from jumping to any conclusion yet.) So what comes next? The majority of the deflation is still in front of us—driven by technology advancing at an exponential rate.

pages: 586 words: 159,901

Wall Street: How It Works And for Whom
by Doug Henwood
Published 30 Aug 1998

Growth between the recession's trough in 1991 and the last quarter of 1997 was the slowest of any post-World War II business cycle. Despite the mighty stock market, investment levels are only middling, and productivity growth, modest. From the hype, you'd also think the U.S. was leaving its major rivals in the dust, but comparisons of per capita GDP growth rates don't bear this out. At the end of 1997, the U.S. was tied with France at second in the growth league, behind Canada, and just tenths of a point ahead of the major European countries. Step back a bit, and the U.S. sags badly. For the 1989-95 period, when the U.S. was stuck in a credit crunch and a sputtering recovery, it was at the bottom of the G7 growth league, along with Canada and the U.K.

The language used to describe this economic strengthening would seem surreal to one untrained in the subtle wisdom of Wall Street. Phrases like "dark clouds" and "threat overhanging the market" have been thrown around for the last six months or so to describe a situtation that might seem like good news to the outside world. Wall Street has become convinced that GDP growth over 2.5-3.0% and unemployment rates below 6.5% are now "unsustainably strong," and must be reined in by tighter Federal Reserve policies. After nearly four years of falling interest rates, the Fed began reversing the trend in early 1994. As of this week, the central bank had tightened policy in three notches, starting on February 4, and was expected to continue to do so over the next several months.

Though the machinery has gotten considerably more complicated over the years, econometricians essentially compare two or more variables with each other to find some pattern among them — or to find it missing, if they're trying to disprove something. An analyst might devise a model in which changes in money growth, interest rates, private investment, and government spending were tested separately and together for their capacity to anticipate changes in GDP growth. In such a model, GDP would be the dependent, and the others the independent, variables. Kennedy (1987, p. 69) offered this advice on how to choose the variables for your model: The first and most important ingredient in such a search is economic theory. If economic theory cannot defend the use of a variable as an explanatory variable, it should not be included in the set of potential independent variables.

Affluenza: When Too Much Is Never Enough
by Clive Hamilton and Richard Denniss
Published 31 May 2005

We know that above a certain threshold more income does not mean more happiness, yet our entire political and social structure is oriented towards a single goal: maximising the rate of GDP growth. The book argues that growth fetishism and affluenza can cause severe damage to some of the things that really do affect our wellbeing—our health, our personal relationships, our communities, and the natural environment. GDP growth has virtually no relationship with improvements in national wellbeing, and one of the first demands of an alternative political philosopher would be to identify the things that matter and insist that government policies promote them.

Nor will it be enough for political leaders to change their rhetoric from economics to ‘family-friendly’ policies and concern about overwork. That is already happening, but it is a façade. Although there has been some change in the rhetoric, the promotion of consumerist values and growth at all costs continues, and these are precisely the things downshifters are turning away from. Yet governments continue to sacrifice to GDP growth the things downshifters value, and no amount of family-friendly rhetoric can conceal this. The main political parties are a long way from redefining the Australian dream in a way that accords with the ideals and actions of the downshifters. It has been interesting to watch the right-wing commentators’ reaction to the downshifting phenomenon.

pages: 226 words: 58,341

The New Snobbery
by David Skelton
Published 28 Jun 2021

The decline of manufacturing and other structural changes to the economy has led to a situation in which many workers aren’t sharing the benefits of growth, and many firms are failing to invest properly in their workforce. Recent decades have created a situation in which many workers are working more but taking home less, as more cash goes to executive salaries, profits and dividends. Economic insecurity has become the norm for many. A belief amongst many London-based decision-makers that aggregate increases in GDP growth are what matters, ignores the fact that, as the saying goes, people don’t live their lives in aggregate. The counterpoint to booming cities, and particularly a booming south-east, has been many towns becoming reliant on low-productivity, low-skilled employment that provides workers with little in the way of dignity, security or respect.

The claim that a rising tide lifts all boats has proven to be trite and flawed. In the years since the banking crash (which is discussed further later in this chapter) that brought the global economy to its knees, executive salaries have soared, as has the stock market. Until Covid brought on a deep recession, the UK had enjoyed almost a decade of unbroken GDP growth, and unemployment has been low. At the same time, the benefits that should have been flowing from corporate success to the workforce have simply stopped existing for a great swathe of the workforce. For many, the link between hard work and reward seems to have been broken. Over the same period, ‘real wages’ – the take-home pay for the majority of working people – had, at best, stagnated.

Other than Greece, which saw its economy devastated by austerity and euro membership, the UK has experienced one of the biggest squeezes in real wages of any advanced economy. Recent projections suggest this trend will last until 2025 at least, meaning that the wages of workers have stagnated for the best part of two decades. This was an acceleration of a decades-long trend whereby wages failed to keep up with GDP growth, employment growth or productivity growth. What economists know as the ‘labour share of income’ – the proportion of GDP that goes to workers in wages – fell from a high of 65 per cent in the mid-1970s to being stuck in the ’50s for the past four decades. For many, this feeling of working harder and harder for less and less reward had become the norm.

pages: 756 words: 120,818

The Levelling: What’s Next After Globalization
by Michael O’sullivan
Published 28 May 2019

As we move through 2019, the combination of incrementally less quantitative easing and higher inflation could dramatically ignite this great debt burden. Historically, spikes in indebtedness are associated first with a rise in growth, followed by a sharp fall. In general, high levels of debt (from 80 percent debt to GDP upward) are associated with lower levels of GDP growth. For example, countries with debt to GDP in the 50–70 percent bracket tend to have GDP growth rates of 2 percentage points higher than those with debt to GDP in the 110 percent plus bracket. When interest rates are low, the risks associated with bad loans are less obvious, but as rates rise, default rates can climb quickly. The tide of higher interest rates in the United States has been slowly creeping in since 2018 when the Federal Reserve made a series of rate hikes.

If these aspirations are checked, as has happened in Mexico and Brazil, then other emerging countries may witness the same political volatility seen in the developed world. Wealth of Nations However, income inequality is only half the picture. Wealth is a more important metric, because it is the key factor that motivates people’s large-scale purchasing decisions. When someone wants to buy a new car, she doesn’t necessarily think of the expected GDP growth of her country; she tends to think in terms of the stock of their wealth. Wealth inequality, compared to income inequality, is important because shifts in wealth are typically slower moving but longer lasting in their effects on consumption behavior. Arguably, income inequality can be fairly easily affected by tax policy and redistribution by governments, but wealth inequality is harder to tackle across the board.

In the aftermath of Brexit, for instance, the Bank of England reignited its QE program. Sweden’s Riksbank gives us perhaps the best example of how QE clouds the judgment of a central banker, and the way QE is prosecuted by the Riksbank is akin to dousing a fire with petrol. Between the years 2016–2017, the Riksbank continued to engage with a QE program, despite GDP growth of close to 5 percent, mounting inflation, and house-price growth of nearly 10 percent. The Only Game in Town The impact of QE on markets has been profound, and in sharp contrast to the performance of real-world indicators. From the first announcement of quantitative easing by the US Federal Reserve in 2009 to October 2018, the Standard & Poor’s (S&P) 500 Index is up nearly 270 percent, the European high-yield benchmark is up 230 percent, and the Morgan Stanley Capital International (MSCI) Emerging Markets Index is up 150 percent, as compared to only 20 percent aggregate rises in inflation, wages, and house prices across the United States.

World Cities and Nation States
by Greg Clark and Tim Moonen
Published 19 Dec 2016

This chapter emphasises how London’s governance has gone through several important cycles in the past 30 years: from the abolition of the citywide government, the creation of the Government Office for London in the 1990s, the increasing self‐organisation of the London business community, and finally the Table 3.1: London’s metropolitan area: size and economic performance GVA per % of % of capita vs national national national population GDP average (1) City global competitiveness rank Country global competitiveness rank Annualised employment Annualised % of growth GDP growth national 2000–14 2000–14 employment 19% 2 10 1.1% 28% 1.44 Source: Parilla et al., 2015; OECD Stat., 2014; World Economic Forum, 2015; EIU, 2012. 1.3% 20% London 37 CONTRIBUTION OF WORLD CITY TO NATIONAL ECONOMY £600bn trade with rest of UK p.a £34bn net fiscal contribution p.a ‘Escalator’ region for British talent and firms Great Britain London Greater South East Region ‘Trophy’ projects; 2012 Olympics, Crossrail Enhanced London Mayor powers Competitive tax rates and immigration rules CONTRIBUTION OF NATIONAL GOVERNMENT TO WORLD CITY Figure 3.1: Reciprocity between London and the UK central government.

The hierarchical model of a Paris Region Table 4.1: Paris–Île‐de‐France’s metropolitan area: key statistics GVA per % of % of capita vs City global Country global national national national competitiveness competitiveness population GDP average (1) rank rank Annualised employment Annualised % of growth GDP growth national 2000–14 2000–14 employment 19% 0.3% 31% 1.41 4 22 Source: Parilla et al., 2015; OECD Stat., 2014; World Economic Forum, 2015; EIU, 2012. 0.7% 20% 56 World Cities and Nation States CONTRIBUTION OF WORLD CITY TO NATIONAL ECONOMY Corporate and aviation hub World class higher education centre Cultural centre and icon for nation Paris French Republic Ile-deFrance Maintain aviation advantage Enhance role of regional council Accelerate key projects (eg.

Entrenched vested interests continue to resist the sorts of transformative reform in Tokyo that would sustain its competitiveness across multiple sectors. Tokyo is now Table 6.1: Tokyo’s metropolitan area: key statistics GDP per % of % of capita vs City global Country global national national national competitiveness competitiveness population GDP average (1) rank rank Annualised employment Annualised % of growth GDP growth national 2000–14 2000–14 employment 28% 0.5% 32% 1.17 6 6 Source: Parilla et al., 2015; OECD Stat., 2014; World Economic Forum, 2015; EIU, 2012. 0.6% 29% Tokyo 83 CONTRIBUTION WORLD CITY TO NATIONAL ECONOMY Decision-making and education centre Corporate and population hub Large customer for services from other regions Tokyo Japan Greater Tokyo Area Management of housing stock Focused regeneration Commitment to rule of law, IP rights CONTRIBUTION OF NATIONAL GOVERNMENT TO WORLD CITY Figure 6.1: Reciprocity between Tokyo and the Japanese central government.

The Age of Turbulence: Adventures in a New World (Hardback) - Common
by Alan Greenspan
Published 14 Jun 2007

American business was doing exceptionally well— profits at large companies were up 18 percent and the stock market had had its best growth in twenty years. Fiscal and monetary policy were both working, with the 1996 deficit projected to shrink to less than $110 billion, and inflation still below 3 percent. GDP growth was starting to revive without a recession. The relationship between the Fed and the Treasury had never been better. As New Year's came and went, the press began speculating that the president might ask me to stay. In January, Bob Rubin and I went to a G7 meeting in Paris. During a pause in the proceedings, we wandered off to the side.

It still doesn't work as well in forecasting as I always thought it should, but the notion was a backdrop to my thoughts at a December 1995 FOMC meeting. Mike Prell, the Fed's top domestic economist, argued that the wealth effect might boost consumer expenditures by $50 billion in the coming year, causing GDP growth to accelerate. Governor Larry Lindsey who would go on to become President George W. Bush's chief economic adviser, thought this was implausible. Most stocks were held in pension funds and 401 (k)s, he argued, making it hard for consumers to lay hands on their gains. And most individuals who owned large stock portfolios were already very well off, not the types to indulge automatically in spending sprees.

THE NATION CHALLENGED to fall. The Japanese seemed unable to break the grip of deflation and must have been quite fearful that they were in the type of downward spiral that nobody had witnessed since the 1930s. Deflation became the focus of increasing concern within the Fed. While the economy eked out 1.6 percent real GDP growth during 2002 ; it clearly was being constrained. Even powerful companies like Aetna and SBC Communications were showing weak profits, laying people off, and reporting difficulty making price increases stick. Unemployment had risen from 4 percent at the end of 2000 to 6 percent. At the FOMC meeting in late June, where we voted to reduce interest rates still further, to 1 percent, deflation was Topic A.

pages: 221 words: 55,901

The Globalization of Inequality
by François Bourguignon
Published 1 Aug 2012

The crisis had a more or less uniform negative impact on growth rates across the world so that developing countries retained their advantage over developed countries. They lost a few percentage points of GDP growth, but, overall, their growth rate remained quite positive, whereas growth disappeared or even became negative in the majority of developed countries. Without any change in national inequalities, the Gini coefficient would thus have kept going down since 2008. Of course, it remains to be seen whether slower GDP growth has been accompanied by a worsening of income distribution within countries. Available data suggest that this was not the case as of 2010.

For Globalization and Costly Inequality127 the first group, there is a high risk that the revenues from natural resources (oil, mineral, agricultural products) are being monopolized by a small section of society with little benefit to the rest of the population. This is already the case in a large number of countries. We can thus imagine that rapid GDP growth will be accompanied by a rise in true, as opposed to observed,4 inequality and a slow reduction of poverty—perhaps even a rise due to demographic pressure. The future will be different for countries where reforms, notably in governance, permit a more transparent management of resources. But even in these countries, there is reason to doubt that growth on the “emirates” model, which is to say, based exclusively on rents from natural resources and on meeting the resulting demand for nontradable goods and services, is possible over the long term, given the size of these countries and their rates of demographic growth.

pages: 517 words: 139,477

Stocks for the Long Run 5/E: the Definitive Guide to Financial Market Returns & Long-Term Investment Strategies
by Jeremy Siegel
Published 7 Jan 2014

Canada, whose banks never became as overleveraged in real estate assets as in the United States, experienced the mildest downturn. FIGURE 3-1 International Comparisons of GDP Through the Financial Crisis and Great Recession (2007 Q4 = 100) Figure 3-1 also shows that the emerging economies withstood the economic shock much better than the developed world; real GDP growth slowed but did not decline in fast-growing countries such as China and India. For emerging economies as a whole, GDP declined only 3 percent; and by the second quarter of 2009, their output had surpassed their previous high. In contrast, it was not until the end of 2011 that the United States regained the output lost, while Japan just reached its peak output by the end of 2013 while Europe was still below its peak.

In 20 years that will shrink to one-third, and by the end of this century, it will fall to one-quarter. By contrast, the output of the emerging economies will increase to three-quarters of the world GDP by the end of this century. FIGURE 4-3 World GDP 1980-2100 Based on IMF, OECD, and U.N. Forecasts The GDP growth of China and India is particularly noteworthy. China has grown from only 2 percent of world output in 1980 to 16 percent today and is forecast to reach a maximum of 32 percent of world output in 2032 before falling back to 14 percent by the end of the century. This decline is due to China’s one-child policy plus the fact that as its per capita GDP nears that of developed countries, its growth will slow.

The real yield on Treasury bonds is determined by many factors, such as the state of the economy, fears of inflation, and the risk attitudes of investors. But in almost all economic models, the most important factor influencing the real return on bonds is economic growth. Indeed, the 3.4 percent yield set at the first TIPS auction was almost exactly equal to real GDP growth in the 1990s. As real economic growth slowed to about 2 percent from 2002 through 2007, the yields on TIPS fell accordingly. But no forecaster in 2012 predicted real economic growth over the next decade would be negative, as the yield on TIPS suggested. Only extreme risk aversion can explain why investors were willing to accept negative after-inflation returns on government bonds even though other assets, such as equities, have consistently delivered long-term real returns of 6 to 7 percent per year.

pages: 363 words: 101,082

Earth Wars: The Battle for Global Resources
by Geoff Hiscock
Published 23 Apr 2012

China is helping to build ports and rail lines in Africa, investing in Brazil’s gas and power sector, and hoping to tie up more of Australia’s iron ore and coal. India harbours the same ambitions. To understand China and India’s thinking, it helps to realise that an economy that grows at an average 10 percent a year doubles its size in seven years, and one that grows at 7 percent a year takes 10 years to double its size. China’s average GDP growth for the seven years 2004 to 2010 was 11.0 percent, meaning its economy comfortably doubled in size during that time. For India, the figure was 8.1 percent. Brazil came in at 4.5 percent, even with a small contraction in 2009 because of the global financial crisis. Russia averaged 4.7 percent, after a 7 percent fall in 2009.

CNPC press release, “CNPC and Cupet sign expanded oil cooperative framework agreement,” 8 June 2011. 11. Rosen, Daniel H. & Hanemann, Thilo, “An American Open Door? Maximising the Benefits of Chinese Direct Investment,” Asia Society and Woodrow Wilson Centre for Scholars, May 2011. CHAPTER 12 Japan after the Deluge When one looks at GDP growth to working age population (defined as population aged 20–60), one gets a surprising result: Japan has actually done better than the U.S. or most European countries over the last decade. —Daniel Gros, director of the Centre for European Policy Studies, January 6, 2011 Japan may be softly receding into nonimportance in the eyes of the more strident backers of Chinese or Indian twenty-first-century economic supremacy, but its global influence remains significant.

Overseas investors turned their sights on more lucrative opportunities, particularly as China opened up. With demography against it and catastrophes such as the 1995 Kobe earthquake exacerbating the pressures on its financial system, Japan struggled to regain momentum. There was a spurt inspired by the information and communications revolution of the late 1990s and early 2000s that lifted GDP growth to 3 percent in 2004, but it was not enough to inspire the market. The Nikkei reached its nadir in March 2009, falling below 7200 as the economy struggled along in the low single-digits, sometimes dropping into negative territory as the turbulence of the late 2000s swept through. Even in this difficult environment, Japan remained the world’s second-largest economy until 2010; its domestic demand, its science and technology, its proven manufacturing expertise—including its ability to establish world-class plants offshore—its trading networks and its intellectual and financial capital ensured its continued importance in global business circles.

pages: 124 words: 30,520

Rebooting Democracy: A Citizen's Guide to Reinventing Politics
by Manuel Arriaga
Published 1 Jan 2014

Such a tension only appears to exist to a very small, but highly influential, group: those who believe that maximum economic output should be a nation’s primary objective. For them, politics is a relatively simple affair: governing well is an issue of avoiding any decisions that would harm GDP growth. Unsurprisingly, one who embraces this view easily arrives at the conclusion that a tame, oligarchic “managed democracy” is preferable to a political system in which the popular will could conceivably get in the way of single-mindedly maximizing GDP growth.[xxxiv] However, for anyone who does not subscribe to this radical vision, no such tension between democracy and the economy exists at all. The economy is not the enemy of—nor is it threatened by—our exercise of political freedom.

pages: 378 words: 110,518

Postcapitalism: A Guide to Our Future
by Paul Mason
Published 29 Jul 2015

Millions took to the streets, again with the networked generation in the lead – but now their grievances went to the heart of what is broken in modern capitalism. In Istanbul, on the barricades around Gezi Park in June 2013, I met doctors, software developers, shipping clerks and accountants – professionals for whom Turkey’s 8 per cent GDP growth rate was no compensation for the theft of a modern lifestyle by the ruling Islamists. In Brazil, just as economists were celebrating the creation of a new middle class, they actually turned out to be low-paid workers. They’d escaped slum life into a world of regular salaries and bank accounts only to find themselves cheated of basic amenities, at the mercy of brutal police and corrupt government.

THE DISRUPTED WAVE IN PICTURES When change is massive and obvious but takes place over decades, two-dimensional charts are sometimes the clearest way to see the big picture. The graphs that follow indicate very clearly what does and does not fit the classic pattern predicted by Kondratieff. They can also give us a clue as to why. 1. World GDP growth The chart above shows the overall shape of the fourth long wave at a single glance. There’s a clear phase change in the early 1970s. Using the IMF definition of a global recession – when the growth rate dips below 3 per cent – there were no recessions for the first twenty-five years of the wave and six after 1973, the last one a humdinger.34 2.

Once you introduce free machines and products into a model of capitalism that runs over time, even a crude one like this, it is as electrifying as introducing the figure zero into mathematics. The four-line spreadsheet outlined above should really have an extra row for profit and instead of simply declining, each value should grow by perhaps 3 per cent a year, representing GDP growth. But suppose you did add profit and growth? Once the zero marginal cost effect kicks in, there would have to be tremendous profits and growth to offset the eventual impact on labour costs. In other words, there would have to be new industrial revolutions every fifteen years, very rapid nominal growth and ever bigger monopoly firms.

pages: 777 words: 186,993

Imagining India
by Nandan Nilekani
Published 25 Nov 2008

The resources that are normally put into building up the economy—in infrastructure, capital and savings—are being diverted to raise children . . . you are not building as many bridges, digging as many harbors, or creating as many ports.” Additionally, as the number of children per woman in East Asia fell from six to two, women were able to join the workforce and contribute to GDP growth. This demographically rich generation drove East Asia’s rise as a manufacturing and technology power—including the growth of Singapore in manufacturing and retail, of Hong Kong in finance and of Taiwan in electronics. In all, Bloom and Williamson discovered, this wave of young workers contributed to as much as one third of East Asia’s economic rise between 1965 and 1990.l “We showed,” David tells me, “that particular kinds of population growth could dramatically drive the country’s growth, not impede it as economists used to believe.”

That event was usually a war. The Second World War—which forced people to postpone having children, and then have them all together in one big wave—led to a baby boom and demographic dividend in the United States. Here, the postwar dividends enabled rapid growth, and it contributed to an estimated 20 percent of GDP growth between 1970 and 2000. In Ireland it was the legalization of birth control that fueled its demographics—there were few infant deaths, but when this deeply Catholic country finally legalized contraceptives in 1979, Ireland’s high fertility rate began to fall rapidly. David writes, “In 1970, the average Irishwoman had 3.9 children; by the mid-1990s, that number was less than two.”

As a result we have not progressed much in these ideas beyond the extravagant yet unspecific promises that our politicians offer time and again, for “better education,” “more jobs” and “better roads.” Our hesitation around these urgent issues has meant that India has remained far below its potential in growth, productivity gains and in creating employment, and a large sector of the economy—agriculture—continues to stagnate, skimming the bottom in incomes and dragging down our overall GDP growth. These yet unanswered questions will determine the path of income growth for individual Indians—whether it remains a narrow, rocky path, difficult to ascend, or a broad, accessible route to economic mobility and wealth. So far, there has been no resolution in sight. And even as we fight over these ideas, Indians, especially the poor, have grown impatient with the slowness of change, which has significantly limited their income opportunities, the future of their children and their access to products and services.

pages: 661 words: 185,701

The Future of Money: How the Digital Revolution Is Transforming Currencies and Finance
by Eswar S. Prasad
Published 27 Sep 2021

When a central bank such as the US Federal Reserve (Fed) changes the interest rates it directly controls, it influences interest rates on commercial bank deposits and loans in a way that is reasonably well understood. The corresponding effects on the lending rates of other institutions and platforms are much less clear. This makes it harder for a central bank to manage the economic variables it cares about—inflation, unemployment, and gross domestic product (GDP) growth. Digitalization of money is not a cure-all, by any means. The issuance of CBDCs will not mask underlying weaknesses in central bank credibility or other factors, such as a government’s undisciplined fiscal policies, that affect the value of central bank money. When a government runs large budget deficits, the presumption that the central bank might be directed to print money to finance those deficits tends to raise inflation and reduce the purchasing power of central bank money, whether physical or digital.

Since the financial crisis of 2008–2009, the ratio of currency to nominal GDP has in fact gone up in the three major advanced economies, with this ratio hitting 23 percent in Japan in 2020. These patterns are the result of the rapid expansion of outside money by these economies’ central banks, coupled with low nominal GDP growth. In 2020, nearly all major economies (China being a key exception) experienced a contraction in nominal GDP, boosting these ratios across the board, most visibly in the cases of India and Russia. Thus, while cash is becoming less important in the money supply of most economies and is losing ground as a payment mechanism (as we will see later in this chapter), it cannot be written off quite yet.

Countries such as Nigeria, Russia, and Saudi Arabia rely on oil exports for much of their revenues, and their economic fortunes are consequently tied to the price of oil. Canada exports large volumes of oil as well but has a more diversified economy, making it less vulnerable to swings in the price of oil. Saudi Arabia has been trying to diversify its economy for precisely this reason. Even setting aside such commodity-dependent volatility in a country’s GDP growth or stock markets, investors in one country can diversify their portfolios by investing in a basket of international stocks rather than just stocks in domestic companies. This used to be a difficult proposition since investing in foreign stocks meant having to learn about foreign companies and managing the complications and costs of currency conversions and trading in overseas markets.

pages: 868 words: 147,152

How Asia Works
by Joe Studwell
Published 1 Jul 2013

In the end the size of your working-age population is still less important to your developmental progress than what you do with that population. The other influence on development that is given only a background role in this book is education. Here, the reason is that the evidence of a positive correlation between total years of education and GDP growth is much weaker than most people imagine.11 The strongest evidence globally concerns primary schooling, but even with respect to that formative period of education when people learn basic literacy and numeracy skills there are states like South Korea and Taiwan that took off economically with educational capital that was well below average.

Like other businessmen, Chung was learning to pay close attention to the policy documents put out by the Blue House and the EPB, because they determined where domestic bank finance, overseas loan guarantees, export subsidies, tax exemptions, reduced utility rates, tariff rebates and more would be directed. Within five years of Park’s coup, business was listening to government as it never had before. Meanwhile, GDP growth between 1962 and 1971 averaged 10 per cent a year and the manufacturing share of exports rose from one-quarter to more than four-fifths.103 Government and business were forging an effective partnership for development, a shotgun marriage in which Park held the weapon. The Road to Somewhere Driving down the Number One expressway that Hyundai Construction helped build in a Hyundai Avante, one can still see how this road – a bellweather for Korea’s industrial take-off – was imposed on the rural society of the late 1960s.

However, instead of ploughing on with its industrialisation big push as the Koreans did through oil crises and global recessions in the 1970s and 1980s – Mahathir cut back on new projects and sought to balance the government’s books.155 A regional boom driven heavily by foreign investment took hold in the late 1980s and early 1990s, and the GDP growth rate shot up. It was tempting to believe in these circumstances that Malaysia was making real progress in its industrial development. Indeed, it appears that Mahathir did think this. In 1991, he announced his ‘Vision 2020’ – that Malaysia could, and would, be an industrialised developed country by 2020.

pages: 264 words: 76,643

The Growth Delusion: Wealth, Poverty, and the Well-Being of Nations
by David Pilling
Published 30 Jan 2018

It would mean leaving everything that matters in life to the self-designated experts. And look where that has got us. * For the purposes of this book, unless otherwise stated, “the economy” and “GDP” are interchangeable terms since we define the economy by the size of its GDP. The economy will also sometimes appear as “national income.” GDP growth is synonymous with growth. 1 KUZNETS’S MONSTER For most of human history the workings of what we casually refer to as “the economy” were pretty much a black box. Indeed, for millennia the concept of an economy hardly existed at all. There were at least two reasons for this. First, before the eighteenth-century Industrial Revolution, there was really no such thing as economic growth.

Giving “undivided attention to the maximization of GNP can be dangerous,” she said in a speech, “for the results are almost always social and political unrest.”6 If India’s policy was to avoid excessive growth, it was working like a charm. The country became stuck in what became known derisively as the Hindu rate of growth. In the forty years following independence in 1947, annual GDP growth rose at around 3.5 percent. That doesn’t sound too bad until you realize that the population was expanding at about 2 percent. What matters is income per capita. In those terms, India was growing at barely above 1 percent, nowhere near enough to make a dent in its grinding poverty. There was no Miracle on the Ganges

In 2014 more than seventy smaller cities and counties jettisoned GDP as a performance metric for government officials, prioritizing environmental protection and poverty reduction instead. That summer President Xi had told party officials, “We need to look at obvious achievements as well as hidden achievements. We can no longer simply use GDP growth rates to decide who the [party] heroes are.”18 Internationally too, Beijing had gone from laggard to putative world leader. Even as Donald Trump was pulling America out of the Paris Climate Agreement, Beijing agreed with the European Union to accelerate what was called a historic shift away from fossil fuels.

pages: 113 words: 37,885

Why Wall Street Matters
by William D. Cohan
Published 27 Feb 2017

Larry Summers, the Harvard economist and former Treasury secretary, refers to this lamentable state of affairs as the “secular stagnation” of an economy “stuck in neutral” and unable to generate annual GDP growth of more than 2 percent. “The reality is that if American growth continues to have a 2 per cent ceiling, it is doubtful that we will achieve any of our major national objectives,” Summers wrote in an August 2016 Washington Post column. His consistent prescription has been the somewhat vague idea of creating “more demand for the product of business.” (During the presidential campaign, Trump promised that his economic policies, including tax cuts, a $1 trillion infrastructure program, and less regulation, would result in annual GDP growth of 4 percent. Easier said than done.)

pages: 848 words: 227,015

On the Edge: The Art of Risking Everything
by Nate Silver
Published 12 Aug 2024

Damian Carrington, “Paul Ehrlich: ‘Collapse of Civilisation Is a Near Certainty Within Decades,’ ” The Guardian, March 22, 2018, sec. Cities, theguardian.com/cities/2018/mar/22/collapse-civilisation-near-certain-decades-population-bomb-paul-ehrlich. GO TO NOTE REFERENCE IN TEXT Global GDP growth: “GDP growth (annual %),” World Bank Open Data, data.worldbank.org/indicator/NY.GDP.MKTP.KD.ZG. GO TO NOTE REFERENCE IN TEXT considered more autocratic: Bastian Herre and Max Roser, “The World Has Recently Become Less Democratic,” Our World in Data, December 28, 2023, ourworldindata.org/less-democratic.

Instead Hyper-Commodified Casino Capitalism imagines us stuck in a TRS 8, a notably worse but still recognizable version of the present day. The world becomes more casino-like: gamified, commodified, quantified, monitored and manipulated, and more elaborately tiered between the haves and have-nots. People with a canny perception of risk might thrive, but most people won’t. GDP growth might be high, but the gains will be unevenly distributed. Agency will be more unequal still; a few large companies, aided by their AIs, will have more power than democratically elected governments. Most people won’t have fulfilling, meaningful jobs, and many will hand their decision-making over to AIs that purport to have their best interest in mind but instead trap them in a loop of button-clicking compulsions.

Claim 1 has been empirically correct so far—severe poverty has been greatly reduced over the past century as global GDP has risen—although AI-driven growth could be different if it’s an especially winner-take-all technology (or if our AI overlords behave more like Ayn Rand than Bernie Sanders). Claim 2 is harder to assess; in fact, one rationale for pursuing AI is that GDP growth is stagnating, meaning that the world needs AI just to keep up with its previous pace and shouldn’t expect to achieve some permanently higher growth rate. Claim 3 follows logically enough if both 1 and 2 are true, but they might not be. *4 Enrico Fermi even offered to take bets on the action

pages: 492 words: 118,882

The Blockchain Alternative: Rethinking Macroeconomic Policy and Economic Theory
by Kariappa Bheemaiah
Published 26 Feb 2017

As a result, in contrast to the early and mid-2000s phase, this new wave of FDI was primarily fed by the bond market and, as a result, the share of emerging-market bonds owned by foreign investors has doubled from $817 billion to $1.6 trillion between 2009 to 2013 (Dobbs et al., 2015) (Buttiglione et al., 2014). It would seem that the waltz of debt is the folk dance of GDP growth. How much debt is too much debt? The rising debt levels of countries forces us to revist the question we asked ourselves in the previous section, which is, how much debt do we need in order to grow and achieve a certain threshold of prosperity at a societal level? It would seem that debt and growth go hand in hand, as over the past few years, debt-type instruments have gained preference over equity-type instruments (in terms of stock market capitalization) (Buttiglione et al., 2014).

As a result, China is experiencing a growing credit expanion and slowing nominal GDP . While Figure 1-3 showcases this contradiction, the slowing down of China’s productivity is indicative that servicing and repaying debt will be difficult in the future. Figure 1-3.Chinese leverage and underlying nominal GDP growth Source: “Deleveraging, What Deleveraging?”, 16th Geneva Report on the World Economy As mentioned before, the ripple effects of debt are cyclic and excessive debt levels augment that effect. If households and businesses find themselves too constrained to pay off debts or take on more debt, then on the flipside, creditors become reluctant to extend new loans or renew standing commitments as they are uncertain if debtors are capable of servicing the debt.

But if consumers can convert their bank funds into cash, such a measure would turn out to be ineffective. This is known as the zero lower bound for interest rates and can cause a liquidity trap. Hence a consensus merged that inflation needs to be low, but positive – at around 2% which would be accompanied with a nominal GDP growth rate of 4-5% (Turner, 2015). For several decades prior to the crisis, this is what was seen: nominal GDP did grow at an average of 5% per year and inflation near 1–3%. But this growth was accompanied by private credit growing at 10–15% (Turner, 2015). If the central bank increased the interest rate, then credit growth slowed down and so did investment.

pages: 358 words: 119,272

Anatomy of the Bear: Lessons From Wall Street's Four Great Bottoms
by Russell Napier
Published 18 Jan 2016

Only governments and not central bankers can deliver such measures, and they will not be enacted without significant political friction, particularly in the USA. Such dramatic moves in the developed world would almost certainly generate higher nominal GDP growth that would be laden with inflation. Ultimately, the biggest inflationary force may come from China where a central bank controlled by the government and unfettered from its exchange rate target might produce very high levels of domestic nominal GDP growth. It is just too early to tell yet but, if equities are cheap, such forces of reflation, though attended by structural declines in the role of market forces, would signal a new bull market for equities.

ECONOMIC CHANGES IN THE US FROM 1920 TO END 1929 [VALUE OF NEW BUILDING PERMITS MILITARY PERSONNEL ON ACTIVE JOURNAL] Source: US Bureau of the Census Headline GDP figures provide significant insight into the important deflationary trend in the 1920s. Measured in real terms, GDP increased 43% over the period, while nominal GDP growth was 20%. The bulk of this deflation occurred in the commodity price collapse of 1921, but the GDP deflator was marginally lower in 1929 than it was even at the end of 1921. As Figure 53 shows, economic growth, perhaps with the exception of the farming sector, was particularly high during the decade.

At the end of May 1949, the total value of all NYSE-listed stocks was just $64 billion, or 23% of GDP. In the bull market to December 1968, NYSE market capitalisation increased to $693 billion, or 76% of GDP. Despite the bear market, which began in 1968, market capitalisation continued to rise and by the end of 1981 reached $1,143 billion or 36% of GDP. Growth in market capitalisation outstripped even the 11-fold increase in nominal GDP for 1949-81. The public’s ownership of equities, primarily through financial intermediaries, also soared - from 4% of the adult population in 1952 to 28% in 1985. Activity in the stock market had been rising since 1974, and in 1982 the highest percentage of listed shares traded since 1933.

pages: 145 words: 43,599

Hawai'I Becalmed: Economic Lessons of the 1990s
by Christopher Grandy
Published 30 Sep 2002

This worked for a while. Once the fear of the Gulf War began to pass, eastbound visitor arrivals regained their relatively strong growth even as westbound arrivals lagged. By September 1991 eastbound visitor arrival growth had returned to the 20% level regularly seen in the late 1980s. Japanese GDP growth remained relatively high during the Gulf War (5.6%). But Japanese growth rates soon followed the U.S. pattern downward. One year later, in the first quarter of 1992, Japanese economic growth was only 2.2%. By 1993 growth had become negative (Figure 13). This was hardly surprising since the United States was Japan’s largest export customer—and Japan had an export-driven economy.

Japan responded by circling the wagons and protecting its own. This did not address the problems, it merely put them off. Paul Krugman, writing in Foreign Affairs, offers an explanation for troubles like Japan’s.18 Krugman argues that the miracle of the Asian economies Three Pinpricks  31 Figure 13 Japanese Real GDP Growth, 1985–1994 Percent Change from Year-Earlier Quarter Source: Japan Economic Planning Agency was largely a myth. When proper economic accounting was used, the vaunted productivity disappeared. Instead, the rapid rates of growth were more readily attributable to increases in the amounts of labor and capital.

Battling Eight Giants: Basic Income Now
by Guy Standing
Published 19 Mar 2020

Another study by an international group of social scientists also concluded that a carbon levy would be popular if combined with payment of dividends.77 We are facing an ecological disaster of catastrophic proportions unless we drastically alter the way we live and our reliance on economic Battling Eight Giants 36 growth to raise living standards. And since a disproportionate share of economic growth is now going to a minority at the top of the income spectrum, a higher rate of GDP growth is needed to reduce poverty. But more growth means more resource depletion, more greenhouse gas emissions and more pollution of all kinds. Greens advocate ‘degrowth’. There is considerable merit in that position, but it would be a hard sell politically, since it would risk misinterpretation as telling voters they should expect a decline in living standards.

Some commentators propose funding basic income through monetary policy, a form of ‘quantitative easing for people’ instead of the Bank of England’s ‘quantitative easing’ policy of releasing money to the financial markets. This could be a means of redressing a structural failing of the British economy, the increasing lag of aggregate wage income behind GDP growth, which is resulting in rising debt as households try to maintain living standards by borrowing to pay for goods and services.15 Stewart Lansley and Howard Reed, in a report for Compass, have proposed a three-step approach for phasing in a full basic income. Their first step would be to convert the existing personal tax allowance into a payment to everybody of £25 a week in the first year (which with the raising of the allowance would now be higher).

A United Ireland: Why Unification Is Inevitable and How It Will Come About
by Kevin Meagher
Published 15 Nov 2016

In May 2016, the IMD World Competitiveness Center (IMDWCC), a think tank measuring nations’ relative economic competitiveness, reported Ireland moving from sixteenth position out of sixty-one advanced nations in 2015, to seventh position in 2016 (Britain was eighteenth). In its assessment of sub-categories, the IMDWCC found Ireland was actually first for ‘Real GDP Growth’, ‘Flexibility and adaptability of people’, ‘Real GDP Growth per capita’, ‘Investment Incentives’, ‘National Culture’ and ‘Finance Skills’. As clean bills of health go, it was pretty emphatic and evidence that Ireland is keen to get back down to business. (Indeed, the World Bank calculates the Irish economy has been growing by around 2.5 per cent a year since 2012.)

pages: 276 words: 82,603

Birth of the Euro
by Otmar Issing
Published 20 Oct 2008

Long-term inflation expectations in the euro area vii 14 15 16 53 64 106 113 127 139 141 144 viii • Figures 12. Nominal exchange rate US dollar/euro 1999–2006 13. Euro real effective exchange rate 1999–2006 (1999 Q1=100) 14. Average of eight-year rolling correlations of output gap across euro area countries (in unweighted terms) 15. Dispersion of real GDP growth across the euro area countries 16. Per capita GDP in purchasing power standard 17. Dispersion of annual inflation in the euro area, fourteen US metropolitan statistical areas (MSAs) and the four US census regions 18. Current account balances (percentages of GDP) 19. Current account balances and cumulated ULC (percentage points; percentages of GDP; percentages) 172 173 209 210 211 212 215 216 Tables 1.

There were also marked divergences in living standards between individual euro area member countries: as can be seen from table 3, Luxembourg, top of the league with per capita 44 • Historical background table 2: Key characteristics of the euro area Reporting Unit period Population 1998 mn GDP (share of world GDP)a 1997 % Euro area 292 United States 270 Japan 127 15.0 20.2 7.7 % of GDP 2.4 1.7 2.1 % of GDP 30.9 26.0 39.2 % of GDP 66.7 72.3 58.7 1998 1998 % of GDP % of GDP 46.7 17.0 35.9 9.4 33.0 11.1 1998 1998 % of GDP % of GDP 49.1 20.2 34.5 13.7 38.6 15.7 Exports of goodsb 1997 % of GDP 13.6 8.5 10.0 b Imports of goods 1997 % of GDP 12.0 11.1 8.1 Exports (% of world exports)b 1997 % 15.7 12.6 7.7 Bank depositsc,d End 1997 End 1997 ECU bn % of GDP 4,657.9 3,953.4 3,663.4 83.9 55.3 98.8 Domestic creditd,e End 1997 End 1997 End 1997 ECU bn % of GDP ECU bn 7,128.5 5,881.5 4,710.8 128.5 82.2 127.1 5,125.9 4,931.1 4,033.6 ECU bn 2,002.6 ECU bn 5,002.4 11,364.0 4,015.2 % of GDP ECU bn 90.2 164.7 108.5 1,897.9 4,729.3 1,192.4 ECU bn 3,104.4 6,634.7 2,822.9 Oct. 1998 ECU bn 3,190.9 9,679.7 3,300.9 Sectors of production Agriculture, fishing, 1993 forestry Industry (including 1993 construction) Services 1993 General government Receipts Social security contributions Expenditure Current transfers to households Claims on the private sector Claims on the End 1997 general government Domestic debt securities End 1997 End 1997 Issued by the private End 1997 sector Issued by the public End 1997 sector Stock market capitalisationf 950.4 677.1 The euro area • 45 table 2 (continued) Reporting Unit period Real GDP growth United States Japan % 3.0 3.3 –2.5 CPI inflation Nov. 1998 % 0.9 1.5 0.8 Unemployment rate (% of labour force) Nov. 1998 % 10.8 4.4 4.4 g 1998 Euro area Broad money growthh Q3 1998 % 4.4 7.4 3.3 Three-month interest End 1998 rate % 3.25 5.00 0.18 Ten-year government End 1998 bond yield % 3.94 4.70 2.02 General government Surplus (+) or deficit (–) Gross debt 1998 % of GDP –2.3 1.4 –5.5 1998 % of GDP 73.8 59.3 115.6 Current account balancei 1997 % of GDP 1.1 ⫺1.7 2.3 a b c d e f g h i At constant prices and purchasing power standards in 1997; euro area: 1990 prices.

Note: Data for Germany refer to West Germany up to 1991. The euro area excludes Slovenia. There is a statistical break in the US regional data in 1998. For the US states and regions, data refer to gross state product. The eight regions are defined by the BEA and cover the whole country. 1 SD = standard deviation. Figure 15 Dispersion of real GDP growth across the euro area countries euro area countries reveals remarkable changes in this respect. Greece and Spain have made considerable progress (see figure 16), but remain below the average in terms of per capita income. Ireland has been remarkably successful: starting from a very low level, its per capita income is meanwhile well above the euro area average.13 Growth differentials may, however, also be related to divergent price developments.

pages: 338 words: 85,566

Restarting the Future: How to Fix the Intangible Economy
by Jonathan Haskel and Stian Westlake
Published 4 Apr 2022

Figure 1.1 shows what output per capita would have been if growth had continued at its trend from the start of the century to the financial crisis: advanced economies would have been 20 to 30 percent richer. The disappointment is all the more acute if we look over a longer period. For most of the second half of the twentieth century, developed countries could rely on average real GDP growth of over 2 percent a year. The turn of the century saw a drastic 50 percent reduction in economic growth. Between 2000 and 2016, growth in real GDP per capita in the United States was around 1 percent per year (see table 1.1 later in the chapter). If we focus on the period of the global financial crisis and afterwards, the figures are even worse, with growth from 2006 to 2016 at a feeble 0.6 percent per year.

David Byrne, Carol Corrado, and Dan Sichel document that firms providing cloud computing services have been making massive investments in hardware but that official data may have missed these investments because many of these purchases are conducted internally, whereas official investment surveys mostly ask respondents to report on external purchases.32 Such omitted cloud computing investment results are sufficient to add 0.1 percentage points to GDP growth between 2007 and 2015. That said, measurement problems existed before the financial crisis as well as after, leading Byrne and Sichel to argue that adjusting for IT prices raises productivity in the IT-intensive sector but slows it even more in the IT-extensive sector.33 In addition, the retooling hypothesis requires a very substantial level of unmeasured intangible investment to explain the orders of magnitude of the decreases in TFP growth.

Claudia Goldin and Lawrence Katz’s landmark work The Race between Education and Technology begins by describing how the United States in the nineteenth and early twentieth centuries invested heavily in school-age education compared with European countries and reaped big productivity benefits as a result, even as European observers wondered what the point was of teaching future farmhands and labourers to read and write.7 In both cases, there is evidence that the “quantity” approach may be causing problems today. A growing body of literature suggests that the productivity of scientific and technological research is slowing down. We are not talking here about complex causal links such as the relationship between R&D and GDP growth, but rather about the more straightforward relationship between investment in R&D and discoveries.8 Alongside this quantitative evidence of a slowdown are widespread anecdotal reports of how public funding systems make it harder to do breakthrough research.9 We see similar evidence regarding postsecondary education.

pages: 348 words: 83,490

More Than You Know: Finding Financial Wisdom in Unconventional Places (Updated and Expanded)
by Michael J. Mauboussin
Published 1 Jan 2006

For companies that largely rely on physical resources, the costs associated with scarcity lead to diseconomies of scale and hence limit size and growth. Companies that primarily create knowledge don’t face the same barriers (although they may face other challenges). We can see how this theme of size begetting growth plays out on a national level. The per capita GDP growth of the United States (which we measure in roughly forty-year increments) has actually been accelerating over the past two hundred years in spite of the economy’s increasing size (see exhibit 18.3). In a world of ideas, size per se may not be a governor of growth. In fact, the opposite may be true.

fruit flies (Drosophila melanogaster) fundamental analysis Galton, Francis gambling Gates, Bill Gazzaniga, Michael General Electric General Theory of Employment, The (Keynes) Gensler, Gary Gibrat’s law Gigerenzer, Gerd global economy Go (game) Gordon, Deborah Gorilla Game, The (Moore) Gould, Stephen Jay Greenspan, Alan Gross, Bill gross domestic product (GDP) growth ratescompany size and; returns and; species distribution; stall point; variance of growth-stock investing “Growth Stocks and the Petersburg Paradox” (Durand) growth-stock valuation guppies handicapping Hanson, Robin D. Hargadon, Andrew Harmon, Butch Hayek, Freidrich hedge funds Henry, David herding Hewlett-Packard hieroglyphics hindsight bias hitting streaks Holland, John H.

network theory neuroscience Newton, Isaac New York Times niches Nicklaus, Jack Niederhoffer, Victor nonlinearity nonstationarity opportunities, limited options outperforming stocks percentage of probability of outsourcing overproduction and pruning ox weight problem Pandolfini, Bruce pari-mutuel betting pattern seeking payoff Pearson, Puggy per capita GDP growth Peters, Ellen pharmaceutical industry Philosophical Essay on Probabilities, A (Laplace) Pollock, Jackson Number Poor Charlie’s Almanack (Kaufman) poor-thinking problem portfolios: concentration construction fat tails and performance frequency of evaluation large cap leveraged performance vs. percentage of outperforming stocks portfolio turnover costs loss aversion stress and positive feedback power laws company-size distribution and fractals and investor understanding of Zipf’s law predictability, loss of prediction price changes, press reports and price-earnings ratios (P/Es) bounded parameters growth and returns nonstationarity of reversion to mean tangible vs. intangible capital tax rates and prices: expected value and S-curve phenomenon prioritizing priority rules probabilistic fields See also gambling; handicapping; investment philosophy probability expected value and extreme-return days frequency-based loss aversion and outperforming stocks propensity-based two-by-two matrix uncertainty and risk weighing probability dominance problem solving, collective mechanisms for process clockspeed Procter & Gamble product clockspeed propensities proportionality prospect theory psychology of investing compliance with requests deductive and inductive processes hindsight bias individual and collective decisions market, effect on stress tendencies of human behavior Tupperware parties See also investment philosophy Purcell, Ed “Pyramid of Numbers,” rationality Raup, David Raynor, Michael E.

pages: 409 words: 125,611

The Great Divide: Unequal Societies and What We Can Do About Them
by Joseph E. Stiglitz
Published 15 Mar 2015

One very senior government official of a northern European country did not even put down his fork when interrupted by an earnest dinner companion who pointed out that many Spaniards now eat out of garbage cans. They should have reformed earlier, he replied, as he continued to eat his steak. IMF growth forecasts released during the Davos meeting highlight the extent to which the world has become decoupled: GDP growth in the advanced industrial countries is expected to be 1.4 percent this year, while developing countries continue to grow at a robust 5.5 percent annual rate. While Western leaders talked about a new emphasis on growth and employment, they offered no concrete policies backing these aspirations.

Any serious student of economic performance needs to look not at overall growth, but at growth related to the size of the working-age population. Japan’s working-age population (ages 15 to 64) shrank 5.5 percent from 2001 to 2010, while the number of Americans of that age increased by 9.2 percent—so we should expect to see slower GDP growth. But even before Abenomics, Japan’s real economic output, per member of the labor force, grew at a faster rate over the first decade of the century than that of the United States, Germany, Britain, or Australia. Still, Japan’s growth is far lower than it was before its crisis, in 1989. From our own recent experience in America, we know the devastating effects of even a short (albeit much deeper) recession: in America, we’ve had soaring inequality (with the top 1 percent securing all of the gains of the “recovery,” and even more income), increased joblessness, and a middle that has been falling farther and farther behind.

But Australia’s Gini coefficient, a standard measure of inequality, is one-third higher than that of Norway, a resource-rich country that has done a particularly good job of managing its wealth for the benefit of all citizens. One wonders whether Abbott and his government really understand what has happened in the U.S. Does he realize that since the era of deregulation and liberalization began in the late 1970s, GDP growth has slowed markedly, and that what growth has occurred has primarily benefited those at the top? Does he know that prior to these “reforms,” the U.S. had not had a financial crisis—now a regular occurrence around the world—for a half-century, and that deregulation led to a bloated financial sector that attracted many talented young people who otherwise might have devoted their careers to more productive activities?

pages: 585 words: 165,304

Trust: The Social Virtue and the Creation of Prosperity
by Francis Fukuyama
Published 1 Jan 1995

And like other forms of dependence, foreign direct investment often creates resentments and jealousies that may spill over into the political arena. Cultural factors like spontaneous sociability are simply one of several factors contributing to aggregate GDP growth, and not always the most important. The kinds of issues studied by mainstream economists—macroeconomic policies, both fiscal and monetary; institutions; international conditions; barriers to trade; and the like—remain the principal determinants of long-term GDP growth. The primary impact of spontaneous sociability would appear to be on industrial structure—that is, the number and importance of large versus small corporations in a national economy, the ways in which they interact with one another, the presence of networks, and so forth.

The regional differences in industrial structure in Italy cannot be explained by level of development, since the North, with relatively larger firms, was less urbanized than was the South when industrialization took off in the 1870s. These cases suggest that to the extent that there is a correlation between firm size and either per capita or absolute GDP the causal relationship may work in the opposite direction. That is, the culturally based ability to create large firms leads to larger markets and faster per capita GDP growth, rather than vice versa. A third alternative explanation for the distinctive features of the Japanese and German economies is what social scientists have labeled “late development.”13 In contrast to the preceding argument, which asserts that all countries follow an essentially similar development path, this one holds that countries industrializing later can take advantage of lessons learned by the early developers and therefore follow a very different evolutionary path.

A society hosting giant corporations will gravitate toward automobiles, semiconductors, aerospace, and the like, while those inclined toward small businesses will tend to concentrate in apparel, design, machine tools, and furniture. It is important to note that until now, there has been no obvious correlation between average scale and aggregate GDP growth. Societies have been able to become quite wealthy via either the large—or small-company route. Taiwan is no poorer than Korea for having companies of a smaller average size, and Italy grew faster than Germany in the 1980s. What small companies give up in terms of financial clout, technological resources, and staying power, they gain in flexibility, speed of decision-making, lack of bureaucracy, and innovativeness.

pages: 484 words: 136,735

Capitalism 4.0: The Birth of a New Economy in the Aftermath of Crisis
by Anatole Kaletsky
Published 22 Jun 2010

While they imported industrial volatility from America and Europe, developing countries reduced the overall instability of their economies by becoming less dependent on primitive farming—the most unreliable business. Gone are the days when the probable strength of the monsoon was the most important issue economists had to ponder when they tried to forecast India’s GDP growth. That the stabilizing effect of Platcos is not just a hypothetical speculation is suggested by the calculations on volatility quoted by Bernanke in his speech. The clear decline in industrial volatility from the mid-1980s was a near-universal phenomenon among industrial countries, with just one exception.

The speaker was one of the world’s top academic economists, one Ben Bernanke: “For reasons of financial innovation and institutional change, the rate of money growth does not seem to be an adequate measure of the stance of monetary policy, and hence a stable monetary background for the economy cannot necessarily be identified with stable money growth. Nor are there other instruments of monetary policy whose behavior can be used unambiguously to judge this issue . . . Ultimately, it appears, one can check to see if an economy has a stable monetary background only by looking at macroeconomic indicators such as nominal GDP growth and inflation. On this criterion, it appears that modern central bankers have taken Milton Friedman’s advice to heart.”16 An alternative version of the same self-justifying methodology in precrisis economics was to redefine inflation: Inflation, many economists began to assert, was whatever happens when an economy experiences rapid monetary growth.

Tens of billions of dollars were then spent on treating the victims of asbestosis and compensating their grieving dependents, and this health spending created even more employment and economic growth. Does this mean that banning asbestos resulted in a major sacrifice for society? The answer is clearly no. But the banning of asbestos did, in fact, reduce GDP growth, at least until new materials were introduced to take its place. On conventional measures of economic performance, therefore, creating an asbestos-free economy did impose big economic losses—and mining companies that were put out of business argued that these losses represented a substantial sacrifice for society as a whole.

The White Man's Burden: Why the West's Efforts to Aid the Rest Have Done So Much Ill and So Little Good
by William Easterly
Published 1 Mar 2006

All these monetary uncertainties mean that the IMF staff set program targets for central bank credit, foreign exchange reserves, and money supply based on shaky numbers. The money supply number is very important because it determines how much credit expansion is safe without losing dollar reserves or increasing inflation. GDP growth plays a big role in projecting how much money demand or other important variables will grow. In March 2003, IMF staff put Mali’s GDP growth in 2001 at 1.5 percent. By August 2003, it had raised the 2001 number to 3.5 percent. Just five months later, in January 2004, IMF staff now put Malian growth in 2001 as 13.3 percent! This is not to say the IMF is incompetent at statistics; it is just that any statistics are very shaky in very poor countries.

As of March 2005, debt-reduction packages have been approved for twenty-seven nations, providing fifty-four billion dollars’ worth of debt relief—a reduction by about two thirds of their outstanding debt.18 HIPC debt forgiveness was supposed to be a once-and-for-all solution that would solve the debt problem. The IMF and the World Bank often had optimistic forecasts for GDP growth in the HIPCs. This hoped-for growth would have allowed the HIPCs to keep the ratio of debt to GDP from surging again. But the debt relief did not spur growth. Bolivia is an example. The country had been an IMF ward ever since the first HIPC relief in 1998. The IMF and the World Bank projected rapid growth in Bolivia in per capita income over 1999–2003; instead living standards declined (see figure 26).

We have already seen that Africa, a favorite destination of repeated IMF and World Bank lending, also failed to have the growth that would have enabled it to service its debt. This is a general pattern: the growth in program countries fell short of the IMF’s own targets. On average for IMF programs in the 1990s, the target GDP growth was 4 percent, but actual growth was only 2 percent.19 Since population growth was also about 2 percent, this meant that the actual growth of income per person was close to zero. Fig. 26. Bolivia: Index of Per Capita Income Projected by IMF and Actuals The supposed once-and-for-all debt relief in 1996 was superseded by Enhanced HIPC in 1999, which gave deeper debt relief to more nations.

pages: 515 words: 132,295

Makers and Takers: The Rise of Finance and the Fall of American Business
by Rana Foroohar
Published 16 May 2016

By 2011, they were just a third,27 a trend that numerous academics and even many investors and businesspeople have linked to the financial industry’s change in focus from lending to speculation.28 The wane in entrepreneurship means less economic vibrancy, given that new businesses are the nation’s foremost source of job creation and GDP growth. As Warren Buffett once summed it up to me in his folksy way, “You’ve now got a body of people who’ve decided they’d rather go to the casino than the restaurant” of capitalism. In lobbying for short-term share-boosting management, finance is also largely responsible for the drastic cutback in research and development outlays in corporate America, investments that are the seed corn for the future.

Research proves that more inequality leads to poorer health outcomes, lower levels of trust, more violent crime, and less social mobility—all of the things that can make a society unstable.57 As Piketty told me during an interview in 2014, there’s “no algorithm” to predict when revolutions happen, but if current trends continue, the consequences for society in terms of social unrest and economic upheaval could be “terrifying.”58 There are plenty of conservative academics, policy makers, and businesspeople (along with liberals who’ve bought into the trickle-down approach) who will dispute the details of such analysis. True, one can argue that precise and irrefutable causalities between finance and per capita GDP growth are difficult to isolate because of the tremendous number of variables at play. But the depth and breadth of correlations between the rise of finance and the growth of inequality, the fall in new businesses, wage stagnation, and political dysfunction strongly suggest that finance is not just pulling ahead, but is also actively depressing the real economy.

Like the decade leading up to the financial crisis of 2008, the Roaring Twenties were marked by not only financial boom and technological wonder, but also massive income inequality. Worker wages stagnated and those of the upper classes grew, bolstered in large part by stock prices. Another similarity was a rise in debt, both public and private, which was used to mask the declining spending power of the lower and middle classes and its dampening effect on GDP growth. Then, as now, when people couldn’t afford to buy, they borrowed—Americans in the 1920s bought more than three-quarters of major household items on credit. Moreover, lured by aggressive advertising campaigns by banks and the proliferation of war bonds, which had been pushed by a government eager to raise funds, the American public began investing for the first time en masse in the securities markets.

pages: 309 words: 91,581

The Great Divergence: America's Growing Inequality Crisis and What We Can Do About It
by Timothy Noah
Published 23 Apr 2012

Since 1979, China’s gross domestic product has increased by about 10 percent per year—nearly three times the average annual increase the United States enjoyed during the postwar golden years, 1950–73. Remember the 2007–9 recession? In the United States, the GDP shrank. In China, the recession merely meant that GDP growth dropped from 13 percent in 2007 to 9 percent in 2009. By 2010, China’s GDP growth was back up to 10 percent. China displaced the United States as the world’s second-biggest exporter in 2007, then displaced Germany as the world’s biggest exporter in 2010. With a GDP of $10 trillion in 2010, China is today the world’s second-largest economy, after the United States.1 You might be forgiven for concluding from all these impressive statistics that China is a rich country.

That incomes were stagnating for middle-class Americans wasn’t immediately recognized as an inequality problem because incomes were also stagnating for more affluent Americans. From 1971 to 1979 the college premium dropped by about one third for recent college graduates.25 (I’ll explain why in chapter 5.) Corporate profits had been in decline since the mid-1960s, and per capita GDP growth had dropped from about 3 percent in the late 1960s and early 1970s to below 1 percent during the late 1970s.26 The share of national income going to the richest 1 percent had slipped from about 11 percent in 1965 to about 9 percent in 1975, and it stayed there for three more years. Even if you could get a raise, it had to be pretty big to keep up with inflation, which averaged more than 9 percent during the second half of the 1970s.

pages: 344 words: 93,858

The Post-American World: Release 2.0
by Fareed Zakaria
Published 1 Jan 2008

While many of the world’s wealthy, industrialized economies continued to struggle with slow growth, high unemployment, and overwhelming indebtedness through 2010 and beyond, the countries that constitute “the rest” rebounded quickly. India’s annual growth rate slowed to 5.7 percent in 2009, but hummed along at a 9.7 percent rate in 2010. China’s GDP growth never fell below 9 percent. This economic success was once most visible in Asia but is no longer confined to it. That is why to call this shift “the rise of Asia” does not describe it accurately. In 2010, 85 countries grew at a rate of 4 percent or more. In 2006 and 2007, that number was 125. That includes more than 30 countries in Africa, two-thirds of the continent.

Third, as workers age, they go from being net savers to being net spenders, with dire ramifications for national saving and investment rates. For advanced industrial countries—which are already comfortable, satisfied, and less prone to work hard—bad demographics are a killer disease. The native-born, white American population has the same low fertility rates as Europe’s. Without immigration, U.S. GDP growth over the last quarter century would have been the same as Europe’s. America’s edge in innovation is overwhelmingly a product of immigration. Foreign students and immigrants account for 50 percent of the science researchers in the country and, in 2006, received 40 percent of the doctorates in science and engineering and 65 percent of the doctorates in computer science.

Consider an episode involving Bill Clinton and India. In May 1998, India detonated five underground nuclear devices. The Clinton administration roundly condemned New Delhi, levied sanctions, and indefinitely postponed a planned presidential visit. The sanctions proved painful, by some estimates costing India one percent of GDP growth over the next year. Eventually Clinton relented and went to India in March 2000. He spent five days in the country, visited famous sights, put on traditional clothes, and took part in dances and ceremonies. He communicated the message that he enjoyed and admired India as a country and civilization.

pages: 358 words: 93,969

Climate Change
by Joseph Romm
Published 3 Dec 2015

To put this figure in perspective, if one were to view this spending as a form of insurance against potential damage due to climate change, it might be relevant to compare it to global spending on insurance, which was 3.3 percent of GDP in 2005. Borrowing could potentially finance many of the costs, thereby effectively limiting the impact on near-term GDP growth. In fact, depending on how new low-carbon infrastructure is financed, the transition to a low-carbon economy may increase annual GDP growth in many countries. As for the cost of delay, back in 2009, the IEA warned that “the world will have to spend an extra $500 billion to cut carbon emissions for each year it delays implementing a major assault on global warming.”

It specifically found that the co-benefits from energy efficiency upgrades alone equal, and often exceed, the energy savings. The conclusion that avoiding dangerous warming has a very low net cost is not a new finding. In its previous Fourth Assessment in 2007, the IPCC found that the cost of stabilizing at the equivalent of 445 ppm carbon dioxide corresponded to “slowing average annual global GDP growth by less than 0.12 percentage points.” These conclusions have remained consistent through time because they are based on a review of the literature, and every major independent study has found a remarkably low net cost for climate action and a high cost for delay. For instance, in the private sector, the McKinsey Global Institute has done some of the most comprehensive and detailed cost analyses of how energy efficiency, renewable, and other low-carbon technologies could be used to cut GHG emissions.

pages: 288 words: 90,349

The Challenge for Africa
by Wangari Maathai
Published 6 Apr 2009

ECONOMIC DECLINE It was in the 1970s, however, that the continent's economic fortunes began to decline. In an analysis published in 2003, the National Bureau of Economic Research, a U.S. nongovernmental organization (NGO), indicated that while the world economy grew by an average of almost 2 percent a year between 1960 and 2002, in Africa GDP growth was negative from 1974 to the mid-1990s.2 By 2003, average sub-Saharan GDP was 11 percent lower than thirty years previously. Whereas in the early 1960s only 10 percent of the world's poor were African, by the year 2000 50 percent were. In the forty-year period between 1960 and 2001, according to the World Bank, the Republic of Korea's average per capita annual growth rate was 5.8 percent a year, while China's and Singapore's was 5.6 percent.

When such largely unregulated liberalization failed to make much of a dent in poverty or spur high rates of growth, however, the IMF, World Bank, and the U.S. Treasury Department prescribed new measures. In what became known as the Washington Consensus, poor countries were encouraged—in some cases mandated—to further liberalize their policies on trade and the free flow of capital. In order to accelerate GDP growth, nations were urged to continue privatization programs, curtail government functions, and deregulate their industries. In the 1990s and the early years of the twenty-first century, some African economies did begin to grow. But by 2001, the number of people in Africa living in extreme poverty had nearly doubled to 316 million, from 164 million twenty years before.5 And along with international campaigners advocating fair trade and working against debt and poverty, a growing number of economists, among them the Nobel laureate Joseph Stiglitz, began to view the prescriptions of the Washington Consensus as neither concerned enough with equity—who benefited from these policies—nor focused sufficiently on the economic sustainability of global GDP growth and its political, social, and environmental ramifications.

But by 2001, the number of people in Africa living in extreme poverty had nearly doubled to 316 million, from 164 million twenty years before.5 And along with international campaigners advocating fair trade and working against debt and poverty, a growing number of economists, among them the Nobel laureate Joseph Stiglitz, began to view the prescriptions of the Washington Consensus as neither concerned enough with equity—who benefited from these policies—nor focused sufficiently on the economic sustainability of global GDP growth and its political, social, and environmental ramifications. As the twenty-first century began, many African nations had relatively new heads of state. These rulers, a number of whom came to power through coups or civil wars or both, may not have been as oppressive to their peoples as those they succeeded, but they did not usher in the needed revolution in leadership.

pages: 288 words: 89,781

The Classical School
by Callum Williams
Published 19 May 2020

Tony Wrigley puzzles over why he did not show “any inkling of the onset of a period of revolutionary progress in society’s ability to generate wealth and hence to benefit the living standards of the mass of the population”. This is a point worth emphasising. A man held up to be one of the greatest economists of all time, writing during the world’s first-ever period of rapid GDP growth, was arguing that precisely this was impossible. There are a few possible solutions to this puzzle. Wrigley suggests that the classical economists did not recognise how important inanimate sources of power (such as coal) would be to the industrial revolution. It is true that Ricardo barely discusses energy economics.

It is true that Ricardo barely discusses energy economics. His pessimism, in other words, “should be understood to be closely linked to [his] implicit belief that the only major sources of energy in the production process were all animate”, namely, people and horses. But Wrigley’s is not the only possible explanation. Despite rapid GDP growth in Ricardo’s time, the standard of living of the average Briton was barely improving. Average real-wage growth per year during Ricardo’s adulthood was some 0.4%. As Robert Allen has shown, the early part of the industrial revolution was marked by growing profits for capitalists, but stagnant wages for ordinary people (a not dissimilar situation to the one in which rich countries currently find themselves).

Wrigley, Edward Anthony. 1987. People, Cities and Wealth: The Transformation of Traditional Society. Oxford: Basil Blackwell. NOTES Introduction 1. The Bank of England’s “Millennium of macroeconomic data” dataset is an invaluable resource, containing information on everything from wages, to prices, to GDP growth, to trade-union membership and agricultural production. The products of the Maddison Historical Statistics Project at the University of Groningen are also extremely useful. 2. Sewall cites someone else in this quotation; I have removed the speech marks. 3. True, around Aquinas’s time so-called “fairs” sprouted across western Europe, where merchants would exchange wares sourced from across the world.

pages: 335 words: 89,924

A History of the World in Seven Cheap Things: A Guide to Capitalism, Nature, and the Future of the Planet
by Raj Patel and Jason W. Moore
Published 16 Oct 2017

The relations between bankers and governments lead in the short term to reinvestment, in the medium term to the concentration of wealth and returns in the financial sector, and in the long term to the rise and fall of commercial power centered on a city, state, or international regime.82 In that arc, some people benefit a great deal, while others merely get by—or worse. Thomas Piketty’s ideas on how investment return has outstripped GDP growth in the Global North have generated much interest recently, but they belong to an older class of insights about how finance relates to the rest of capitalism’s ecology under successive state regimes.83 Capitalism is not just the sum of “economic” transactions that turn money into commodities and back again; it’s inseparable from the modern state and from governments’ dominions and transformations of natures, human and otherwise.

Marx 1976, 638. 71. Chiluwa 2015; Doherty et al. 2003. 72. Andrews 2008. 73. Zinn 2003. 74. Watts 2004. 75. Mitchell 2009. 76. Painter 2014. 77. Huber 2013. 78. Kander, Malanima, and Warde, 2013, 260–64; Painter 2014. 79. World oil output increased 7.79 percent between 1950 and 1973, against 4.9 percent GDP growth (calculated from Maddison 2007, 380; EPI 2010, 2). 80. Prashad 2012 tells the story compellingly. 81. Mitchell 2011, 184. 82. Shah of Iran, quoted in D. Smith 1973, in Prashad 2012, 57. 83. K. Phillips 2009, 15. 84. Panitch and Gindin 2012. 85. N. Klein 2007. 86. Baffes et al. 2008, 60; IMF 2008, 95; Bina 1990; FTI Consulting 2016; Chapman 2014. 87.

See also Genoese banking Genoese banking: American silver and, 79; Centurione family, 35, 65–66, 79, 221n2; Charles V (Carlos I) King of Spain and, 79–80; cheap money and, 74–77; currency shortage, 71; global silver trade and, 82; merchant class and, 65, 75, 76; Pinelo, Francisco, 65–66, 79; Reconquista and, 65–66; relationships to, 26; war financing and, 79–81 German Peasants’ War of 1525, 73, 74, 82, 163, 175 Germany: banking in, 15–16; fiscal hegemony of, 89; Fugger family, 72; German Peasants’ War of 1525, 73, 74, 82, 163, 175; technologies of, 148 Glass-Steagall Act, 40 Glenn, Evelyn Nakano, 136 Global North: animal food industry, 174; care professionals, 134; defined, 25; GDP growth in, 28; investment returns in, 28 Global South: care professionals, 134; defined, 25; Green Revolution, 155; nationalism in, 197–98; nutritionism in, 157; petroloans, 177; in sexual politics, 131 gold standard, 146, 176 governments: alternative nationalisms, 199–200; and bankers, 28, 66, 85–88; commercial power and, 28; and norms, 39.

pages: 696 words: 184,001

The Brussels Effect: How the European Union Rules the World
by Anu Bradford
Published 14 Sep 2020

Chapter 9 1.See Dominic Wilson & Roopa Purushothaman, Dreaming with BRICs: The Path to 2050 (Goldman Sachs, Global Econ., Paper No. 99, 2003), https://www.goldmansachs.com/insights/archive/archive-pdfs/brics-dream.pdf [https://perma.cc/YKL5-T2CC]. 2.GDP Growth (Annual %), The World Bank, https://data.worldbank.org/indicator/NY.GDP.MKTP.KD.ZG?end=2017&locations=EU-US-CA&start=2010&view=chart [https://perma.cc/G2Z6-BFZ6]. 3.GDP Growth (Annual %), The World Bank https://data.worldbank.org/indicator/NY.GDP.MKTP.KD.ZG?end=2017&locations=EU-CN-IN-ID&start=2010&view=chart [https://perma.cc/PV62-T5L9]. 4.Jean Fouré, Agnès Bénassy-Quéré & Lionel Fontagné, The World Economy in 2050: A Tentative Picture, (CEPII, Working Paper No. 27, 2010), 48 http://www.cepii.fr/PDF_PUB/wp/2010/wp2010-27.pdf [https://perma.cc/M4P4-L9VH]. 5.Report for Selected Country Groups and Subjects, IMF, https://www.imf.org/external/pubs/ft/weo/2016/02/weodata/weorept.aspx?

However, there are also instances where a jurisdiction might want to impose regulation in a certain policy area but where it simply lacks the technical expertise or the financial resources to build the requisite regulatory capacity—hence the preference for stringent regulation should be considered an independent condition needed for the Brussels Effect to occur.30 The degree of regulatory capacity sets important limits on a country’s ability to exert global regulatory authority. For instance, many Asian economies are growing at a staggering rate, but it will take time for their GDP growth to translate into regulatory experience and the institutional capacity necessary to enforce norms, in particular against foreign parties.31 This is evident in the case of China, where the country’s impact on global financial regulation has been limited, despite its vast capital reserves and extensive holdings of US treasuries.

As the EU’s economic might is gradually waning, economic power is increasingly shifting to fast-growing Asia. The most significant economic growth will occur in highly populated developing nations, such as China and India, which have the ability to leverage their supply of lower-cost human capital. In the aftermath of the financial crises, the EU’s GDP growth has been slow. In the period from 2010–2018, the EU’s growth substantially trailed behind that of the United States.2 When compared to large developing countries such as China, the difference in growth rates becomes even more apparent.3 For example, while in 2017 the EU’s economy grew by 2.4%, China’s economy grew by 6.9%.

pages: 197 words: 49,296

The Future We Choose: Surviving the Climate Crisis
by Christiana Figueres and Tom Rivett-Carnac
Published 25 Feb 2020

Politicians will do anything in their power to keep the numbers moving in the upward direction, and most regard this as their principal responsibility. Economic growth is currently measured by GDP, or gross domestic product, the market value of goods and services produced in a year. The idea that endless GDP growth is the aim of responsible countries is highly embedded into our cultures and becomes self-perpetuating, as the media, politicians, business leaders, and others constantly refer to it as second nature.64 But GDP is a poor marker of what human beings need in order to thrive, as it is all about extracting, using, and discarding resources.

To illustrate the point, if you drink coffee from a disposable cup every day, GDP will go up, but the forests will disappear and emissions will go up too. If you drink coffee from a reusable ceramic mug, GDP will go down. If you throw away your ceramic mug every day and buy a new one, GDP will go through the roof. In the current transition, strictly linear GDP growth can no longer be the priority. More stuff does not mean a better life, and indeed it is contributing to our existential crisis. Moving away from quantity of products that can be purchased, we must reorient our underlying sense of value toward quality of life, including within all of Earth’s ecosystems.

pages: 892 words: 91,000

Valuation: Measuring and Managing the Value of Companies
by Tim Koller , McKinsey , Company Inc. , Marc Goedhart , David Wessels , Barbara Schwimmer and Franziska Manoury
Published 16 Aug 2015

For ConsuCo, it would therefore be best to perform the DCF valuation in Brazilian reais and—if needed—translate the result at both the actual and the PPP exchange rates to obtain a value range in foreign currency. Exhibit 31.2 shows other key economic and monetary assumptions that were used for ConsuCo’s valuation, focusing on real GDP growth and inflation. Due to the global economic crisis that began in 2008, real GDP growth was expected to slow down in the short term before settling at an annual rate of between 3 and 4 percent after 2010. In line with growth forecasts, near-term inflation was expected to ease somewhat and return to about 4.5 percent in 2014, beyond which we assumed it to be constant.

-based nonfinancial companies.5 ROIC in Exhibit 6.3 excludes goodwill and acquired intangibles, which allows us to focus on the underlying economics of companies, without the distortion of premiums paid for acquisitions (which we will discuss later in the chapter). Until the early 2000s, the average median ROIC without goodwill was about 10 percent. Furthermore, annual medians oscillated in a tight range, though with higher returns in high-GDP-growth years and lower returns in low-growth years. Since the early 2000s, however, median ROIC without goodwill has increased to about 16 percent in 2013. Notice also that the spread 5 The numbers in this section are based on U.S. companies because longer-term data for non-U.S. compa- nies are not readily available.

Exhibit 7.6 presents median (real) revenue growth rates between 1965 and 2013. The average median revenue growth rate for that period equals 5.3 percent per year and oscillates between roughly 0 percent and 9 percent. Median revenue growth demonstrates no trend over time. Real revenue growth of 5.3 percent is quite high when compared with real GDP growth in the United States (2.9 percent). Why the difference? Possible explanations abound. The first is self-selection: companies with good growth opportunities need capital to grow. Since public markets are large and liquid, high-growth companies are more likely to be publicly traded than privately held ones.

pages: 436 words: 98,538

The Upside of Inequality
by Edward Conard
Published 1 Sep 2016

The Boskin Commission and decades of follow-up work by Northwestern University’s Robert Gordon, for example, also find understatement of productivity growth. This understatement largely stems from the U.S. Consumer Price Index’s failure to fully account for the value of replacing old goods with more valuable innovations—for example, by replacing landline-based telephones with smartphones. Properly accounting for these productivity gains boosts GDP growth upwards of 1 percent per year, which is substantial since GDP grows only 2 to 3 percent a year.27 Goldman Sachs economists Jan Hatzius and Kris Dawsey reach the following conclusion about slowing versus unmeasured productivity growth: Measured productivity growth has slowed sharply in recent years. . . .

Profit margins have risen to record levels, inflation has mostly surprised on the downside, overall equity prices have surged, and technology stocks have performed even better than the broader market. None of this feels like a major IT-led productivity slowdown. One potential explanation that reconciles these observations is that structural changes in the U.S. economy may have resulted in a statistical understatement of real GDP growth. There are several possible areas of concern, but the rapid growth of software and digital content—where quality-adjusted prices and real output are much harder to measure than in most other sectors—seems particularly important.28 Despite the recent slowdown in productivity growth, it’s not hard to imagine vast improvements in Internet-search capabilities, computing capabilities converging on consciousness, and genetic engineering that transform the human race in the long run.

.”*43 A recent International Monetary Fund (IMF) study, often cited by advocates of redistribution*—whose headlines insisted that redistribution does not slow growth—admits that “when redistribution is already high (above the 75th percentile*), there is evidence that further redistribution is indeed harmful to growth, as the Okun ‘big trade-off’ hypothesis* would suggest.”44 Guess which country lies at the seventy-fifth percentile? America. A study by Harvard’s Christopher Jencks finds that “after 1960 . . . a one percentage point rise in the top decile’s income share is associated with a statistically significant 0.12 point rise in GDP growth during the following year.”45 Using these findings, Jencks calculates that by 2001, “the growth promoting effects of [the higher level of inequality in the United States] . . . had pushed the mean income of the bottom nine deciles above what it would have been if their share of total income had not fallen from 68 to 58 percent over the previous thirty years.”46 A 2013 study of billionaires by University of Michigan economist Sutirtha Bagchi and Columbia University economist Jan Svejnar finds that the causes of rising inequality have a significant impact on the resulting growth of the economy.

pages: 343 words: 101,563

The Uninhabitable Earth: Life After Warming
by David Wallace-Wells
Published 19 Feb 2019

The more recent Great Recession lowered it by about 2 percent, in a onetime shock; Hsiang and his colleagues estimate a one-in-eight chance of an ongoing and irreversible effect by 2100 that is twenty-five times worse. In 2018, a team led by Thomas Stoerk suggested that these estimates could be dramatic underestimates. The scale of that economic devastation is hard to comprehend. Even within the postindustrial nations of the wealthy West, where economic indicators such as the unemployment rate and GDP growth circulate as though they contain the whole meaning of life in them, figures like these are a little bit hard to fathom; we’ve become so used to economic stability and reliable growth that the entire spectrum of conceivability stretches from contractions of about 15 percent, effects we study still in histories of the Depression, to growth about half as fast—about 7 percent, which the world as a whole last achieved during the global boom of the early 1960s.

Warren et al., “Risks Associated with Global Warming of 1.5 or 2C,” Tyndall Centre for Climate Change Research, May 2018, www.tyndall.ac.uk/sites/default/files/publications/briefing_note_risks_warren_r1-1.pdf. total worldwide wealth is today: According to Credit Suisse’s Global Wealth Report 2017, total global wealth that year was $280 trillion. has not topped 5 percent globally: According to the World Bank, the last time was 1976, when global growth was at 5.355 percent. World Bank, “GDP Growth (Annual %),” https://data.worldbank.org/indicator/NY.GDP.MKTP.KD.ZG. “steady-state economics”: The term was popularized by Herbert Daly, whose anthology Toward a Steady-State Economy (San Francisco: W.H. Freeman, 1973) established a contrarian perspective on the history of economic growth that is especially incisive in an age of climate change.

a team led by Thomas Stoerk: Thomas Stoerk et al., “Recommendations for Improving the Treatment of Risk and Uncertainty in Economic Estimates of Climate Impacts in the Sixth Intergovernmental Panel on Climate Change Assessment Report,” Review of Environmental Economics and Policy 12, no. 2 (August 2018): pp. 371–76, https://doi.org/10.1093/reep/rey005. global boom of the early 1960s: World Bank, “GDP Growth (Annual %),” https://data.worldbank.org/indicator/NY.GDP.MKTP.KD.ZG. There are places that benefit: Burke, “Economic Impact of Climate Change,” http://web.stanford.edu/~mburke/climate/map.php. India alone, one study proposed: Katharine Ricke et al., “Country-Level Social Cost of Carbon,” Nature Climate Change 8 (September 2018): pp. 895–900, http://doi.org/10.1038/s41558-018-0282-y. 800 million: World Bank, “South Asia’s Hotspots: Impacts of Temperature and Precipitation Changes on Living Standards” (Washington, D.C., 2018), p. xi.

pages: 348 words: 102,438

Green and Prosperous Land: A Blueprint for Rescuing the British Countryside
by Dieter Helm
Published 7 Mar 2019

Whatever the benefits of all that extra consumption to the Chinese people, from a global environmental perspective, the spectacular GDP growth of China since 1980 has been a disaster for climate change, water resources, the state of the seas and for biodiversity. And it is one that continues to gather pace. There are two dimensions to this extra consumption that impact on the natural environment: how much is spent; and what it is spent on. How much is spent should not be based on the 2 to 3 per cent GDP growth number, and there is a lot to be put right before economic growth can be accommodated, including the impacts of all the fiscal deficits, trade deficits and quantitative easing that pumped consumption up artificially high since the financial crisis of 2007/08.

What these considerations illustrate is that housing left to market forces will be an environmental disaster and will replicate some of those disasters now being witnessed in a number of rapidly developing countries. Market forces drive up demand for houses in line with income. If the next decades witness 2 to 3 per cent GDP growth per annum, it is not hard to see that much of the Green Belt, and lots more green fields, will be concreted over by 2050. If each development does not have to pay for the environmental and social costs it imposes on the rest of the population, it will impose them. Imagine how quickly the Green Belt would fill up if the landowners could sell to the highest bidders without worrying about planning permission and paying for the environmental detriments caused.

pages: 209 words: 53,236

The Scandal of Money
by George Gilder
Published 23 Feb 2016

Under Obama, a record-breaking stock market and a thriving dollar confirmed other indications of able economic management. Republicans respond to such claims with baffled incredulity. Yet the Democratic claims are mostly true. To the extent that the economic debate revolves around the usual indices of GDP growth and financial market revival compared with other countries and markets, the Democrats can hold their own. They argue that a more balanced economy fueled by redistributive tax and spending policy can close the growing gap between rich and poor. It can redress simmering middle-class anxieties and lower-class stagnation.

Yet China, Hong Kong, Singapore, and Taiwan—the spearhead of global trade expansion in recent decades—have all largely opted out of the floating-currency system. Against agonized protests from the West, they fix their currencies on the dollar as much as possible, and some of them impose controls on capital movements. Outside of the Asian emerging sector, world trade has inched up only slowly. Likewise world GDP growth. As Wriston was the first to point out, this system provides a global “information standard” for currencies. If it takes between 35 and 40 percent of the profits of the economy to supply the information and to build the knowledge behind our twenty-first-century wealth, perhaps that is the price of progress in the information age.

pages: 173 words: 53,564

Fair Shot: Rethinking Inequality and How We Earn
by Chris Hughes
Published 20 Feb 2018

“What is new is that we now have the techniques and the resources to get rid of poverty. The real question is whether we have the will.” Unlike conservative economists who envisioned “cashing in” existing poverty programs for a guaranteed income, King believed that a guaranteed income pegged to median wages and GDP growth would work best alongside an expanded set of social services. The combination of the two could abolish poverty in America for good. He foresaw a black-white coalition of laborers who would come together to overcome inevitable opposition from the wealthy and powerful, and in the year before he was felled by an assassin’s bullet, he laid the groundwork for the fight.

A recent study by the Roosevelt Institute, a prestigious economic think tank, shows that if we provided Americans with a guaranteed income of $500 a month, financed through a combination of taxes on the wealthy and moderate deficit spending, the American economy would grow by an additional 7 percent over the next eight years. That would mean an additional point of GDP growth each year, a significant boost to an economy that has grown at about 2 percent annually over the last several years. Some people understandably wonder if more money in the economy would just create more inflation, diminishing the effectiveness of the policy. Economists for the most part are not so concerned that a guaranteed income would increase inflation rates, given how stubbornly low they have been for years.

pages: 209 words: 53,175

The Psychology of Money: Timeless Lessons on Wealth, Greed, and Happiness
by Morgan Housel
Published 7 Sep 2020

This afternoon 6,500 young men and women will be married, and with inflation at less than half of what it was just four years ago, they can look forward with confidence to the future. That wasn’t hyperbole. GDP growth was the highest it had been since the 1950s. By 1989 there were six million fewer unemployed Americans than there were seven years before. The S&P 500 rose almost fourfold between 1982 and 1990. Total real GDP growth in the 1990s was roughly equal to that of the 1950s—40% vs. 42%. President Clinton boasted in his 2000 State of the Union speech: We begin the new century with over 20 million new jobs; the fastest economic growth in more than 30 years; the lowest unemployment rates in 30 years; the lowest poverty rates in 20 years; the lowest African-American and Hispanic unemployment rates on record; the first back-to-back surpluses in 42 years; and next month, America will achieve the longest period of economic growth in our entire history.

pages: 194 words: 56,074

Angrynomics
by Eric Lonergan and Mark Blyth
Published 15 Jun 2020

Whether it was done through outright confrontations with organized labour epitomized by Thatcher’s bitter battle with the British National Union of Miners in the 1980s, or through the migration of business to “right to work” (union-free) states in the US in the 1970s, or through EU-level policies for greater “flexibility” in the 1990s, union membership everywhere plummeted, and along with it so did labour’s ability to capture the gains from productivity increases. This in turn shows up in how much income labour takes home from GDP growth. It has fallen dramatically. Given this, the ability of wages to rise ahead of productivity falls drastically. But what really accelerates these trends are two other hardware reconfigurations: the opening-up of financial markets and the globalization of production. A key hardware modification of v.2.0 was the insulation of the economy from financial flows.

Instead of mechanically targeting a stable debt to GDP ratio as is common practice across much of the world – or worse still target an absolute amount as some parts of the US political establishment want to do – governments should operate with a much simpler objective: to expand their borrowing whenever their cost of borrowing falls below nominal GDP growth. Conversely, they should raise taxes when interest rates are higher. On this basis, the world has potentially huge fiscal resources. It is highly likely that the current negative real interest rate on government bonds is enduring, given its cause is demography, higher GDP per capita, risk aversion, a very long-run decline in real rates over several centuries, and very low inflation.

pages: 524 words: 143,993

The Shifts and the Shocks: What We've Learned--And Have Still to Learn--From the Financial Crisis
by Martin Wolf
Published 24 Nov 2015

Martin Wolf THE SHIFTS AND THE SHOCKS What we’ve learned – and have still to learn – from the financial crisis Contents List of Figures Preface: Why I Wrote this Book Introduction: ‘We’re not in Kansas any more’ PART ONE The Shocks Prologue 1 From Crisis to Austerity 2 The Crisis in the Eurozone 3 Brave New World PART TWO The Shifts Prologue 4 How Finance Became Fragile 5 How the World Economy Shifted PART THREE The Solutions Prologue 6 Orthodoxy Overthrown 7 Fixing Finance 8 Long Journey Ahead 9 Mending a Bad Marriage Conclusion: Fire Next Time Notes References Acknowledgements Follow Penguin For Jonathan, Benjamin and Rachel, without whom my life would have been empty List of Figures Libor–OIS Swap General Government Borrowing Requirement Real GDP Since the Crisis Employment US Cumulative Private Sector Debt over GDP Spreads over German Bund Yields Spreads over Bund Yields Current Account Balances in the Eurozone 2007 (US$bn) Current Account Balances in the Eurozone 2007 (per cent of GDP) Unit Labour Costs in Industry Relative to Germany Current Account Balances Average General Government Fiscal Balance 2000–2007 Ratio of Gross Public Debt to GDP (Ireland/Spain) Ratio of Gross Public Debt to GDP (2007/2013) Ratio of Gross Public Debt to GDP Spread Between UK and Spanish 10-year Bond Yields Real GDP of Crisis-hit Eurozone Countries Unemployment Rates Growth in the Great Recession Increase in GDP 2007–2012 Average Current Account Balances 2000–2017 Average Current Account Balance 2000–2007 GDP Growth in Central and Eastern Europe in 2009 Foreign Currency Reserve Capital Flows to Emerging Economies Demand Contributions to Chinese GDP Growth Real Commodity Prices Tradeable Synthetic Indices of US Asset-backed Sub-prime Securities Central Bank Short-term Policy Rates Yields on Index-linked Ten-year Bonds Real House Prices and Real Index-linked Yields Global Imbalances US Financial Balances since 2000 Eurozone Imbalances on Current Account Sectoral Financial Balances in Germany Spread on Government 10-year Bond Yields over Bunds Backing for US M2 Real Profits of US Financial Sector US GDP UK GDP US ‘Money Multiplier’ Structure Fiscal Balances UK Sectoral Net Lending Whole Economy Unit Labour Costs Relative to Germany Eurozone GDP Core Annual Consumer Price Inflation Optimal Currency Area Criteria Gross Public Debt over GDP US GDP per Head UK GDP per Head Preface: Why I Wrote this Book Can ‘It’ – a Great Depression – happen again?

So the money took flight, whereupon these countries were forced to retrench suddenly and brutally. The result was deep recessions, with few exceptions. (Poland did well during the recession year of 2009. But its current-account deficit was also relatively small in the period before the crisis.) Figure 23. GDP Growth in Central and Eastern Europe in 2009 (per cent) Source: IMF World Economic Outlook Database We can confidently assert that most Central and Eastern European countries did not show strong resilience in 2009. (See also Figure 20, for post-crisis economic growth.) On the contrary, the recessions in this region were very deep.

As the Chinese growth rate slows, as everybody (including the government) expects – now that the country no longer enjoys the benefits of huge amounts of surplus labour and has become a middle-income country – the need for investment is likely to fall sharply. But that is also going to take away a crucial prop to demand. Figure 26. Demand Contributions to Chinese GDP Growth (per cent and percentage points) Source: Haver Analytics The financial stresses discussed above are likely to accelerate the slowdown in China. The rapid growth of credit in the economy in recent years was driven by expectations of profits from continued ultra-fast growth. If growth disappoints and asset prices fall, much of this credit may prove unserviceable.

pages: 444 words: 151,136

Endless Money: The Moral Hazards of Socialism
by William Baker and Addison Wiggin
Published 2 Nov 2009

But it wouldn’t necessarily restrain economic output. With credit held in check, the increase in money tends to flow to productive areas of the economy. There is no question that some speculative excess spills over into the equity and real estate markets in 77 Flat-Earth Economics 6 1870–1890 Real GDP Growth (%) 5 1940–1970 4 1890–1913 1913–1929 3 f(x)  5.58E2*^3  1.08E0*^2  6.12E0*  5.88E0 R^2  8.77E1 corr(^3,y)  1.31E1, corr(^2,y)  9.79E3, corr(^1,y)  2.09E1 1970–2008 2 1929–1940 1 0 0 Figure 4.1 1 2 3 4 5 6 7 Money Supply Growth (%) 8 9 Money Supply & Real Economic Growth Sources: Historical Statistics of the United States; Federal Reserve System Data.

Sweden, Denmark, and Norway then succeeded in obtaining markets for their timber and paper products as well as butter and bacon in exchange for agreeing to take nearly all of their imports of coke and coal from the United Kingdom. This was particularly beneficial to Finland, which had Flat-Earth Economics 99 barely been industrialized before this period. It went on to enjoy 7 percent GDP growth throughout the Great Depression, ending the period as a modern industrial state. Further aiding Finland and the entire Nordic region was secular growth for paper and timber necessary to fuel a revival in housing that swept through Britain beginning in the 1930s.26 According to Arthur Lewis: “There is a housing boom in Britain about once every 20 or 30 years, and it seems to occur whether prices and interest rates are rising or falling, or whatever is happening to the terms of trade.

Right under its nose, the broad money supply (M3) doubled in the last eight years, from $7 trillion to $14 trillion, but it is trying to fool the market into thinking this statistic is irrelevant because it was vigilant and never allowed inflation to surface. Can one really double the money supply, produce a few percentage points of inflation and GDP growth, and not have this prodigious sum of cash not produce some tremendous effect? If the answer is truly “no,” then why not double it again? In reality, this ballooning quantity of reserve currency dollars was a base upon which other countries could pyramid loans, repeating the pattern seen when the classical gold standard was liberalized under the tutelage of Kemmerer and Conant, morphing into the gold exchange standard.

pages: 524 words: 155,947

More: The 10,000-Year Rise of the World Economy
by Philip Coggan
Published 6 Feb 2020

In 1950, a quarter of the Japanese population was aged over 40, and 5% was aged over 65; by 2010, more than half the population was aged over 40 and nearly a quarter was more than 65 years old. Between 2000 and 2018 the Japanese population of working people fell by 13%. It is very hard to grow an economy with fewer workers. A Federal Reserve paper estimated that, between 2011 and 2015, Japanese GDP growth was dragged down by 2 percentage points by this demographic decline.42 Overall, Japan’s annual growth rate averaged just 1.3% between 1988 and 2018, a far cry from the post-war miracle. Japan is still a prosperous and long-lived society, but its era of high growth looks gone for good. Across the OECD as a whole, demography started to be a drag on growth after 2010 and will continue to be so until 2040.

Sometimes this means that a recession (defined as two quarters of declining output) has been declared inaccurately. The subsequent statistical adjustments get much less publicity than the initial bad news. This happened in Britain in 2012.3 A study by the OECD of the period 1994 to 2013 found that, on average, annual GDP growth across 18 countries had been revised 0.2% higher after three years.4 As a measure, GDP, and its close relative gross national product (GNP),5 has had many critics. In a speech, Senator Bobby Kennedy pointed out that the calculation included the value of guns and napalm and jails, but that the gross national product does not allow for the health of our children, the quality of their education or the joy of their play.

A smartphone has more computing capacity than NASA did when it sent Apollo 11 to the moon.8 A modern TV is lighter, less prone to failure, and carries many more channels than did its counterpart in the 1970s. Economists try to make adjustments for these “hedonic” improvements but may not get it right. All these objections also apply to the GDP deflator. So as well as overestimating or underestimating inflation, economists may be overstating or understating real GDP growth. Unemployment Another much-cited measure of economic performance is unemployment. Again, this was hard to measure until the existence of the modern state and the introduction of unemployment insurance. Precision here is difficult. Clearly, schoolchildren should not be included; the same goes for the very elderly and infirm, or parents looking after small children.

pages: 482 words: 149,351

The Finance Curse: How Global Finance Is Making Us All Poorer
by Nicholas Shaxson
Published 10 Oct 2018

The main problem is that corporate tax cuts normally only represent a tiny share of economic activity, usually much less than 1 per cent of GDP, so it would be astonishing if this factor stood out clearly among all the myriad other ingredients of growth. And in any case, GDP growth is a narrow prism through which to judge success. A fast-growing country in which most of the benefits of growth flow to a few oligarchs isn’t necessarily one you or I would want to live in. Nor is one where growth comes with poisoned rivers and choking pollution. Economists’ myopia about GDP growth, explains Harvard economist Dani Rodrik, is a key reason why they have misunderstood trade globalisation so badly, failing to take seriously the question of how economic benefits are distributed across societies.

Headlines appeared in local and national papers: SAM BROWNBACK GUTTED KANSAS: HOW AMERICA’S WORST GOVERNOR AND AN ULTRA-CONSERVATIVE IDEOLOGY WRECKED AN ENTIRE STATE.7 In 2014 more than a hundred prominent Republicans publicly endorsed Brownback’s Democrat rival for governor. Things got so bad that the Kansas supreme court ruled that educational spending was unconstitutionally low, and in June 2017 the Republican-controlled state legislature reversed many of the cuts. Brownback then quietly discontinued quarterly reporting on state GDP growth rates while publicly urging newly elected president Donald Trump to replicate his tax cuts nationwide – which Trump did. There’s a long and dishonourable history to the Laffer curve: suffice to say that the theory falls apart in practice, and Kansas is just the latest piece of evidence in an immense file that has proved it useless as a general guide to policy.

For growth rates, see for instance ‘The Rise and Fall of the Golden Age: An Historical Analysis of Post-war Capitalism in the Developed Market Economies’, with Glyn, A., Hughes, A., Singh, A., seminar Money, Finance and Trade Reform of WIDER/UNU, Helsinki, published in Marglin, S. and Schor, J. (eds), The Golden Age of Capitalism, Clarendon-Oxford UP, Oxford, 1990, cited in S. Marglin and J. Schor (eds), The Golden Age of Capitalism, Clarendon-Oxford University Press, 1990. Table 2.1 shows annual average GDP growth per capita for sixteen major advanced countries of 1 per cent 1920–70, 1.4 per cent 1870–1913, 1.2 per cent 1913–50, 3.8 per cent 1950–73 and 2 per cent 1973–9. For developing countries, the growth rate was an unprecedented 3 per cent in 1950–1975. Golden Age growth was, moreover, much more equitable than in other eras, benefiting the poor and middle classes disproportionately.

pages: 775 words: 208,604

The Great Leveler: Violence and the History of Inequality From the Stone Age to the Twenty-First Century
by Walter Scheidel
Published 17 Jan 2017

Argentina: Weisbrot, Ray, Montecino, and Kozameh 2011; Lustig, Lopez-Calva, and Ortiz-Juarez 2012: 3–6; Roxana 2014. Other recoveries: Gasparini, Cruces, and Tornarolli 2011: 167–170. One Gini point: 170. Abatement: Alvaredo and Gasparini 2015: 749. Effect of GDP growth: Tsounta and Osueke 2014: 4, 17–18 (maybe an eighth of the overall inequality decline). GDP growth rates: IMF data in https://www.imf.org/external/pubs/ft/reo/2013/whd/eng/pdf/wreo1013.pdf; http://www.imf.org/external/pubs/ft/survey/so/2015/CAR042915A.htm. Cornia 2014b: 44 identifies several structural obstacles to further leveling. 27 Brazil: Gasparini and Lustig 2011: 705-706; Lustig, Lopez-Calva, and Ortiz-Juarez 2012: 7–8.

Leandro Prados de la Escosura has offered hypotheses regarding the competing effects of declining returns to capital (which depressed top income shares), wage compression from reruralization under Franco (with reduced overall wage inequality), and rising returns to property, especially land, under autarky (which offset these effects to produce the overall Gini coefficient of income inequality). All this took place in the context of zero net real per capita GDP growth from 1930 to 1952, with the proportion of the population living in poverty more than doubling during roughly the same period. Despite superficial similarities in terms of the fall of top income shares and the compression of wages, inequality developed rather differently in Spain than in other European countries of the time.

More generally, the abatement of unfavorable short-term consequences of liberalization in the 1990s exerted a mitigating influence. Strong economic growth, averaging 4 percent per year in real terms or twice the rate of the previous decades, boosted employment but has been estimated to account for only a small fraction of the observed change in inequality. Moreover, these favorable conditions no longer apply, as annual GDP growth in the region declined for five consecutive years after 2010, from 6 percent in 2010 to a projected 0.9 percent in 2015. At the time of writing, Brazil, by far the largest economy in the region, was said to be enduring its worst recession since the Great Depression. All this casts doubt on the prospects of further leveling.26 Finally, expanded government transfers have attracted considerable publicity as a means of combating disposable income inequality.

Four Battlegrounds
by Paul Scharre
Published 18 Jan 2023

National Interest 16 (Summer 1989), https://www.jstor.org/stable/24027184. 68wouldn’t “dance on the [Berlin] wall” to celebrate: Richard Fontaine, “American Foreign Policy Could Use More Prudence,” The Atlantic, December 3, 2018, https://www.theatlantic.com/ideas/archive/2018/12/the-prudence-of-george-h-w-bushs-foreign-policy/577192/. 69“As people have commercial incentives”: Orville Schell, “The Death of Engagement,” The Wire China, June 7, 2020, https://www.thewirechina.com/2020/06/07/the-birth-life-and-death-of-engagement/. 69China’s annual GDP growth: “GDP Growth (Annual %)—China,” World Bank, 2020, https://data.worldbank.org/indicator/NY.GDP.MKTP.KD.ZG?locations=CN. Thanks to CNAS research associate Ainikki Riikonen for background research. 69“growing interdependence would have a liberalizing effect”: Bill Clinton, remarks to Voice of America, Washington, DC, October 24, 1997, https://clintonwhitehouse4.archives.gov/WH/New/html/19971024-3863.html. 69“responsible stakeholder”: Robert B.

Bush argued, “As people have commercial incentives, whether it’s in China or other totalitarian systems, the move to democracy becomes inexorable.” Washington adopted a new strategy: shaping China’s inevitable rise. China was emerging as a global power, a reality that U.S. policymakers had to confront. By 1992, China’s annual GDP growth rate was 14 percent, and it never dipped below 7 percent in the 1990s. Under the Clinton administration, “engagement” became the new lodestar of U.S. foreign policy to China, with the aim of influencing China’s behavior. Far from a pollyannish view of Chinese leaders, engagement was a calculated policy stemming from the belief that “growing interdependence would have a liberalizing effect in China,” and that enmeshing China in international institutions would lead China to be a “responsible stakeholder” in the international system.

Following Mao’s death, Deng Xiaoping took the reins as China’s leader in 1978, launching the nation on a path to the greatest economic miracle in human history. Deng’s policies of “reform and opening,” characterized by careful and measured economic reforms and international engagement, sparked unprecedented growth. Over the next forty years, the country experienced an average annual GDP growth rate of nearly 10 percent in what the World Bank termed “the fastest sustained expansion by a major economy in history.” The result has been a monumental change in the economic quality of life for Chinese citizens. Eight hundred million people were lifted out of poverty, and per capita income increased twenty-five-fold.

pages: 1,104 words: 302,176

The Rise and Fall of American Growth: The U.S. Standard of Living Since the Civil War (The Princeton Economic History of the Western World)
by Robert J. Gordon
Published 12 Jan 2016

Some would place even more value on the arrival of clean running water that eliminated the previous drudgery of carrying water into and out of the home; the transition from the outhouse to the indoor toilet and bathroom; the transition from child labor to high school education as the typical experience of teenage males; and, perhaps above all, the value of the reduction of infant mortality from 22 percent in 1890 to 1 percent in 1950. These changes, which provided immense value to all households, rich and poor alike, had arrived in urban America by 1940 and in farms and small towns by 1970. How did the understatement of real GDP growth compare in the 1940–2015 era covered by part II of the book? First on many lists of improvements excluded from real GDP growth would come the changes in comfort, productivity, and geographical location made possible by the spread of air conditioning. Price indexes utterly failed to capture the value of the quantum leap in the quality of TV sets and the variety of entertainment available on them.

Just as the thousands of elevators installed in the building boom of the 1920s facilitated vertical travel and urban density, so the growing number of automobiles and trucks speeded horizontal movement on the farm and in the city. WHY DID GROWTH PEAK IN THE MIDDLE OF THE TWENTIETH CENTURY? Though the central task of this book is to extend our understanding of economic growth beyond the scope of GDP, one aspect of the record of U.S. real GDP growth nevertheless cries for explanation. Why, as shown in figure 1–2, was TFP growth so much more rapid during 1920–70 than before or since? An explanation is provided in chapter 16, which considers alternative explanations for the puzzle of the “Great Leap Forward.” As shown in figure 16–5, the superior growth record of 1920–70 comes to an even more prominent peak at the middle of the twentieth century when TFP growth over 1890–2014 is split up into twelve separate decades.

In their interpretation, a significant part of the decline in mortality in the early twentieth century resulted from improved knowledge about health at the level of the individual household.3 There is no dispute that however the improvements in life expectancy are achieved, they are of great value. The studies we examine agree that the values are stunning even if the experts may differ on whether health advances at any given time would raise estimates of per-capita GDP growth by 50 percent or 100 percent. The value of reducing infant mortality is greater than of improving the life expectancy of a 65-year-old, and this implies that improvements in health contributed a larger addition to household welfare before 1940 than after. Improvements in the standard of living are measured not just by changes in life expectancy, but also by QALYs, or quality-adjusted life years, which attempt to convert into a quantitative measure the results of medical interventions.4 The central task of this chapter is not just to explain the rapid increase in life expectancy from 1870 to 1940, but also to identify aspects of change that improved the quality of life beyond the reduction in mortality.

pages: 297 words: 108,353

Boom and Bust: A Global History of Financial Bubbles
by William Quinn and John D. Turner
Published 5 Aug 2020

Restrictions on the size and term of deposits that could earn market-determined interest rates were gradually removed.10 The difference after the Plaza Accord, however, was that financial deregulation was now accompanied by extremely loose monetary policy. The Bank of Japan’s discount rate was reduced from 5 per cent when the Plaza Accord was signed to 3.5 per cent in May 1986 and 2.5 per cent in 137 BOOM AND BUST February 1987, despite GDP growth having been above 3 per cent in every year since 1981. This, combined with the unprecedented freedom of banks to decide how much to lend, dramatically increased the amount of leverage in the financial system. Japanese household debt rose from 52 per cent of GDP in 1985 to 70 per cent of GDP in 1990, as government policy eroded cultural norms against borrowing money.11 This in turn caused a substantial monetary expansion, which was compounded by the fact that the Plaza Accord implicitly encouraged the movement of funds into Japan to take advantage of the expected appreciation of the yen.

In September 1990, when Japanese television finally decided to broadcast a panel of bearish financial pundits, the pundits insisted on having their faces blurred out.50 CONSEQUENCES Although the end of the two bubbles was signalled by the stock market crash during the first half of 1990, the economy did not immediately enter a recession.51 GDP growth was 4.9 per cent in 1990, 3.4 per cent in 1991 and 0.8 per cent in 1992. When growth turned negative in 1993, the Japanese government loosened monetary policy and increased government spending. By 1995, the discount rate was 0.5 per cent, while the deficit was 4.4 per cent of GDP. When GDP grew by 2.7 per cent in 1995 and a further 3.1 per cent in 1996, it appeared that the crisis was over.52 The government, believing that the 147 BOOM AND BUST storm had passed, implemented austerity measures in an effort to prevent a persistent large deficit.

The UK experienced continued growth until the global financial crisis of 2007–8. The French economy stagnated in 2002–3, but did not experience a recession, while the Japanese economy experienced a contraction that was mild in the context of its ongoing economic problems. The only moderate recession was in Germany, where GDP growth was negative in both 2002 and 2003.66 The main reason for this appears to have been the relatively high exposure of German banks to stock market losses. Although there were no high-profile banking failures, both profits and capital-to-loans ratios declined. In response, banks reduced lending, which had a chilling effect on economic activity.67 Given the modest levels of economic damage associated with the bursting of the Dot-Com Bubble, it may provide an example of a bubble where the benefits outweighed the costs.

pages: 219 words: 61,720

American Made: Why Making Things Will Return Us to Greatness
by Dan Dimicco
Published 3 Mar 2015

Annual growth of gross domestic product is hardly the last word on the health of America’s economy—especially given the decline in wages middle-income Americans have experienced even during robust periods of expansion. But GDP is useful in thinking about what’s been lost and what could be gained. The difference between settling for a meager 2 percent GDP growth over the next ten years and striving for 4 percent growth is $3 trillion. Would you leave that kind of money sitting on the table? Of course you wouldn’t. Think about that! Think about the squandered opportunity and lost productivity. Not to mention the lost tax revenue. Our leaders in the White House and in Congress haven’t taken any meaningful steps to spur the kind of economic revival we need or to ensure we have a strong and thriving middle class again in this country.

And we shouldn’t. The old business saying also happens to be true of government: it takes money to make money. It’s important to get the revenue going so we can spend without bankrupting ourselves. The only way to overcome our fiscal woes is to grow out of the problem. Simply settling for 2 percent GDP growth and 150,000 new jobs a month isn’t going to cut it. Don’t buy into the “new normal” rhetoric. This isn’t at all controversial, or at least it shouldn’t be. There was a time, not so very long ago, when every Republican and every Democrat agreed with that idea. It’s just common sense. If we met our infrastructure needs, that would generate growth and create millions of jobs.

pages: 225 words: 61,388

Dead Aid: Why Aid Is Not Working and How There Is a Better Way for Africa
by Dambisa Moyo
Published 17 Mar 2009

Whereas grants are viewed as free resources and could therefore perfectly substitute for a government’s domestic revenues. This distinction has led many donors to push for a policy of grants instead of loans to poor countries. The logic is that much of the investment that poor countries need to make has a long gestation period before it starts to produce the kinds of changes in GDP growth that will yield the tax revenues needed to service loans. Indeed, many scholars have argued that it was precisely because many African countries have, over time, received (floating rate) loans, and not grants, to finance public investments that they became so heavily indebted, and that aid has not helped them reach their development objectives.

Trade is not the panacea of Africa’s woes – but with the prospect of US$100 billion in trade income each year from China alone, it is bound to put a dent in them. Trade need not just be international. Take a country like Pakistan, for example. With little trade to show (Pakistan’s trade share of GDP in 2006 was only 37 per cent – less than half the low-income group mean trade openness ratio), it has registered solid growth rates – in 2006, Pakistan’s GDP growth was around 7 per cent. How has it done this? The simple answer is, by generating domestic demand for goods and services locally produced (that is, its non-tradeable sector). African countries must also focus on their non-tradeable sector by encouraging their entrepreneurs (of course, FDI can boost the non-tradeable sector also).

pages: 252 words: 60,959

Numbers Don't Lie: 71 Stories to Help Us Understand the Modern World
by Vaclav Smil
Published 4 May 2021

According to the International Monetary Fund (IMF), in 2019 China’s PPP-adjusted GDP was about 32 percent ahead of the US total. If you rely instead on the yuan-to-US-dollar exchange rate, the United States is well ahead: about 50 percent higher in 2019 ($21.4 trillion versus $14.1 trillion). But even with the recent slowdown in Chinese GDP growth—from double digits to an official rate of between 6 and 7 percent a year, and, in reality, less than that—it is still considerably higher than growth in the United States. It is thus only a matter of time before China becomes No. 1, even in nominal terms. The path to No. 1 status began in 1978, when the country embraced economic modernization, leaving behind three decades of gross mismanagement.

Higher alcohol sales, more driving under the influence, more accidents, more emergency-room admissions, more injuries, more people in jail—GDP goes up. More illegal logging in the tropics, more deforestation and biodiversity loss, higher timber sales—again, GDP goes up. We know better, but we still worship high annual GDP growth rate, regardless of where it comes from. Human minds have many irrational preferences: we love to speculate about wild and crazy innovations but cannot be bothered to fix common challenges by relying on practical innovation waiting to be implemented. Why do we not improve the boarding of planes rather than delude ourselves with visions of hyperloop trains and eternal life?

pages: 586 words: 160,321

The Euro and the Battle of Ideas
by Markus K. Brunnermeier , Harold James and Jean-Pierre Landau
Published 3 Aug 2016

Buildup of Imbalances and the Naked Swimmer In the first decade of the new millennium, several countries in the periphery of the euro area enjoyed strong growth—significantly above the euro-area average. The preferred explanation for this above-average growth was the convergence theory. Peripheral countries with a lower GDP per capita were catching up with the core countries in which the GDP per capita was higher. An alternative explanation is that GDP growth was simply driven by cheap credit, and the growth path was unsustainable. For example, excessively high public expenditures in Greece before the crisis artificially boosted Greek GDP numbers. In 2010, Greece’s annual public deficit reached a level of 15.7 percent of GDP, adding to a stock of public debt of 129.7 percent of GDP.

In particular, this chapter will address the following questions: •How does government spending work to stimulate an economy, and what is the Keynesian multiplier? In particular, when is government spending particularly effective, and, conversely, when is austerity particularly harmful? •Should contractions always be interpreted as harmful deviations from the economy’s potential? Or can GDP growth be excessive and unsustainable and recessions be seen as a correction? •Has the public debate on creditor conditions in bailouts unfairly lumped austerity measures and structural reforms together? •What general lessons about the optimal conduct of fiscal policy in times of crisis can we draw?

In these cases subsequent recessions are simply corrections of earlier excesses.18 In Greece, government expenditures artificially boosted the economy. Before 2007, capital flows within Europe led to an appearance of a convergence in GDP, but fundamental misallocation of resources and production capacity in fact exacerbated the gap. Imbalances and bubbles built up, whose bursting culminated in the euro crisis. The GDP growth rates were artificially inflated and did not reflect underlying economic strength. For example, Greece’s GDP grew by 69.1 percent from 2000 to 2008, considerably larger than the 35.6 percent growth for the other twenty-seven EU countries.19 In 2010, its annual deficit level ultimately turned out to be 15.7 percent of an inflated level of GDP.

Manias, Panics and Crashes: A History of Financial Crises, Sixth Edition
by Kindleberger, Charles P. and Robert Z., Aliber
Published 9 Aug 2011

In contrast economists search for the patterns in the data, and the systematic relationships between an event and its antecedents. History is particular; economics is general. The business cycle is a standard feature of market economies; increases in investment spending lead to increases in household income and in GDP growth. Macroeconomics focuses on the explanations for the cyclical variations in the growth of GDP relative to its long-run trend. An economic model of a general financial crisis is presented in this chapter, while the various phases of the speculative manias that lead to crises are illustrated in the following chapters.

Four waves of bubbles in 30 years suggest that the reversal in the direction of cross-border money flows that follows the implosion of one bubble may contribute to the next wave. Most credit bubbles led to asset price bubbles; every real estate bubble has resulted from the rapid increase in the supply of credit. The credit bubble of the 1970s financed the deficits of the governments and of government-owned firms in Mexico and other developing countries when their GDP growth rates accelerated because of the sharp increase in commodity prices. The bubble in stocks and property in Japan in the second half of the 1980s resulted from the rapid increase in the supply of credit for real estate purchases. Similarly the bubbles in real estate and stock prices in Thailand, Malaysia, and the other Asian countries as well as in Mexico and other Latin American countries in the first half of the 1990s were responses to money inflows and domestic credit expansion.

The surge in demand associated with rapid growth in money supplies led to sharp increases in the prices of primary products. There were were two massive oil-price shocks and the payments surpluses of some of the oil-exporting countries surged, and their demand for US dollar securities increased rapidly. The increases in the GDP growth rates in the commodity-producing countries meant that their governments were more attractive borrowers. British, Canadian, Japanese, and other foreign banks sourced the money for dollar-denominated loans to Mexico and other developing countries from the banks in these offshore centers. Previously these borrowers had relied on US banks and on institutions like the World Bank for most of their external financing; the number of lenders willing and able to increase their loans to these borrowers increased dramatically.

pages: 396 words: 117,897

Making the Modern World: Materials and Dematerialization
by Vaclav Smil
Published 16 Dec 2013

Moreover, a major share of that excess capacity has been in energy-intensive and highly polluting enterprises; their output of roughly 20 Mt, or nearly two-thirds of the total production, was low-quality float glass (Pilkington, 2010). Expansion of China's steelmaking has matched almost exactly the pace of GDP growth: raw steel output rose 17.2 times between 1980 and 2010, from 37.1 Mt in 1980 to 637.4 Mt in 2010, when it accounted for nearly 45% of the global output (WSA, 2013). But as the extraction of iron ores increased about 14 times (from 75 000 t to 1.07 Gt) an increasing share of this output has come from imported materials.

At the same time, widespread possession of a widening range of consumer goods and the deliberately engineered rapid obsolescence of many products are two notable factors that militate against dematerialization even in the most affluent societies already suffused with goods, and the net outcome can be determined only by taking a longer look at aggregate demand in modern economies. How closely does it follow the described pattern of vigorous rise followed by saturation and relative decline? Or, to rephrase this question in macroeconomic terms, what has been the extent of decoupling between GDP growth and overall consumption of materials? Has it been a weak decoupling when material consumption grows at a slower rate than GDP, or a strong one when material consumption declines in absolute terms even as inflation-adjusted GDP keeps on growing? Data limitations do not make it easy to answer this question.

The average annual population growth rate of more developed regions was already down to just 0.4% between 2005 and 20101, and by 2050–55 it is forecast to be zero; aging is already much in evidence in Japan and in the EU, and by 2030 nearly 30% of people in more developed countries will be older than 60, compared to 20% in the year 2000 (UNDESA, 2013). As a result, future economic growth in affluent societies may not require substantial additional material inputs as any new requirements resulting from moderate GDP growth (1–2%/year) sufficient for already largely saturated markets with a slowly growing (and in many countries declining) and aging population could be largely or completely met by a combination of continued lowering of average energy intensities, of relative dematerialization of products and services, and by intensified recycling and reuse.

pages: 479 words: 113,510

Fed Up: An Insider's Take on Why the Federal Reserve Is Bad for America
by Danielle Dimartino Booth
Published 14 Feb 2017

“Let me first say that I think we ought to at least modestly congratulate ourselves that we have made some progress,” Bernanke said. Yellen, not a voting member, offered her opinion that though the economy had slowed, she did not anticipate a long recession. To Yellen, Bear Stearns was an isolated event. She expected GDP growth of 1.5 percent during the second half of the year and opined “the likelihood of a severe financial panic has diminished.” Yellen added that the Bush administration had recently announced a fiscal stimulus package, and tax rebates would likely “provide a bigger bang for the buck” than similar measures in 2001.

The two warned that a steady hand of government was required to carefully manage animal spirits. But it’s really tricky to manage animal spirits once they’re released. Stocks kept rising despite bad news: the persisting oversupply in the home ownership and rental markets would keep a lid on GDP growth, and wage declines had settled in, inhibiting consumers’ capacity to consume. And yet stocks rose. “Money on the sidelines is still waiting to be put to work” summed up the conventional wisdom. That echoed the mind-set and steadfast resolve of investors during the Roaring Twenties, when the top 1 percent of U.S. families accounted for 24 percent of all personal income—as was the case in 2007.

Plosser and Fisher dissented: Associated Press, “Recession Worries Drove Rate Cut, Minutes Show,” New York Times, April 8, 2008. Unintentionally, the March 2008 meeting: FR: FOMC Meeting, transcript, March 18, 2008, 109–11. “Let me first say”: FR: FOMC Meeting, transcript, April 29–30, 2008, 136, www.federalreserve.gov/monetarypolicy/files/FOMC20080430meeting.pdf. She expected GDP growth: Ibid., 47. Yellen added that the: Ibid., 48. Fisher and Plosser again dissented: FR: FOMC Statement, April 30, 2008, www.federalreserve.gov/newsevents/press/monetary/20080430a.htm. “Although downside risks”: FR: FOMC Statement, June 25, 2008, www.federalreserve.gov/newsevents/press/monetary/20080625a.htm.

pages: 573 words: 115,489

Prosperity Without Growth: Foundations for the Economy of Tomorrow
by Tim Jackson
Published 8 Dec 2016

But Tim Jackson compellingly urges those politicians to give up their comfort blanket, to re-think our continuing dependence on economic growth, and to start preparing – urgently – for a world where such growth is no longer viable as its environmental cost massively exceeds its benefits. Prosperity without Growth remains the single most important book addressing this most critical of contemporary challenges.’ Jonathon Porritt, Founder Director of Forum for the Future ‘Tim Jackson spearheads the obvious truth that GDP growth is not necessary in order to achieve higher well-being in the rich world. Government intervention can produce the desired result, namely full employment, less inequity and reduced greenhouse gas emissions.’ Jørgen Randers, author of 2052: A Global Forecast for the Next Forty Years ‘Tim Jackson has brought his groundbreaking book bang up to date and substantially deepened its arguments.

This doesn’t mean that we will see absolute scarcity in supply immediately. But it does suggest that more and more of our wealth will have to be directed towards lower and lower grade resources. Peak wealth will arrive around 2017–2022, according to this second study, and from that point on, ‘we will no longer be able to take natural-resource fuelled global GDP growth for granted’.36 Whether these predictions are right or wrong, two central aspects of the Limits to Growth report are hard to dispute. The first is that at some point, the profligate extraction and use of material resources has to stop. The second is more subtle. At the point at which absolute scarcities begin to bite, it is almost certainly going to be too late to make the kinds of changes that will be needed to transform both the resource dependency of the system and its institutional basis.

The swiftly diminishing returns on growth beyond a certain income; the huge advantages of income growth below that point; and the remarkable performance of some poorer countries who are able to enjoy levels of human wellbeing on a par with the richest nations on earth on a fraction of the income: all of these lessons are vital in our ability to understand the complex relationship between GDP growth and prosperity. None of them so far rules out the possibility that good health outcomes, good education outcomes and high levels of human wellbeing could be achieved without relentless growth having to continue indefinitely even in the richest economies. On the contrary, the story is much more about the desperate need for decent incomes in the poorest countries, and the creativity of some development paths in delivering prosperity at surprisingly low income levels.

pages: 391 words: 71,600

Hit Refresh: The Quest to Rediscover Microsoft's Soul and Imagine a Better Future for Everyone
by Satya Nadella , Greg Shaw and Jill Tracie Nichols
Published 25 Sep 2017

Nobel Prize–winning economist Robert Solow once quipped, “You can see the computer age everywhere but in the productivity statistics.” However, from the mid-1990s to 2004, the PC Revolution did help to reignite once-stagnant productivity growth. But other than this too brief window, worldwide per capita GDP growth—a proxy for economic productivity—has been disappointing, just a little over 1 percent per year. Of course, GDP growth can be a crude measure of actual improvement in the well-being of humanity. In a panel discussion with me in Davos, Switzerland, MIT management school professor Andrew McAfee pointed out that productivity data fail to measure many of the ways technology has enhanced human life, from improvements in health care to the way tools like Wikipedia have made information available to millions of people anytime, anywhere.

pages: 237 words: 64,411

Humans Need Not Apply: A Guide to Wealth and Work in the Age of Artificial Intelligence
by Jerry Kaplan
Published 3 Aug 2015

While the latest economic downturn certainly had an impact, the general consensus among industry analysts is that consumer demand for luxury brands is recession-proof.12 According to a report from the Carlyle Group, global sales for luxury apparel, accessories, and goods have experienced double-digit annual growth every year since 2009 and are expected to be four times the projected European GDP growth for the next three years. Bain & Company reports that the highest 2013 luxury segment growth was in the Americas, surpassing China, the previous leader.13 When the growth rate of luxury goods consistently exceeds the growth rate for all retail sales, it doesn’t take long for it to account for a large proportion of total spending.

(Contrary to popular perception, China owns only about 8 percent of the national debt.)36 Adding the $25 trillion of value stored in homes and subtracting mortgage debt of $13 trillion, that works out to $51 trillion, or about $450,000 per household.37 But that doesn’t include the value of all privately held companies, or loans to companies and individuals, which probably accounts for a portion of the difference between this estimate and the $625,000 above. That’s now, but let’s talk about the future. Data for the last thirty years shows a GDP growth rate per person, after inflation, of approximately 1.6 percent.38 Assuming this trend is to continue, the total increase in real wealth per person in forty years would be 90 percent. That is to say, the average person in the United States will be almost twice as wealthy in forty years as today, based on current trends.

pages: 234 words: 63,149

Every Nation for Itself: Winners and Losers in a G-Zero World
by Ian Bremmer
Published 30 Apr 2012

That’s the power of the pivot.14 Given that Asia will be the biggest contributor to global economic growth over the next many years, it’s not surprising that the region is home to several pivot states. Indonesia, with the world’s fourth largest population, has enjoyed a stable political environment in recent years with solid GDP growth. Its natural resources and relative openness to foreign investment attract customers from around the world, but Indonesia’s is also a well-diversified economy that benefits from a highly skilled workforce, a fast-growing middle class, a strong educational system, an expanding manufacturing base, and a surge in tourism revenue.

Vietnam, too, can pivot because it receives most of its development aid from Japan, its arms from Russia, its machinery (and tourists) from China, and its biggest export market from the United States. Vietnam began its economic reform process several years later than China, but by 1986, the Doi Moi (renovation) process was well under way. Real GDP growth has averaged about 7.5 percent over the past twenty years, and the poverty rate fell from 58 percent in 1993 to just 14.5 percent in 2008.15 China could eventually dominate its much smaller neighbor, but for now, Vietnam profits from a diverse set of partners. A country’s small size doesn’t always limit its government’s geopolitical options, as tiny Singapore demonstrates.

pages: 257 words: 64,285

The End of Traffic and the Future of Transport: Second Edition
by David Levinson and Kevin Krizek
Published 17 Aug 2015

Transportation, 25(3), 287-306. 68 US Census Bureau (2014) QUARTERLY RETAIL E-commerce SALES 3RD QUARTER 2014 http://www.census.gov/retail/mrts/www/data/pdf/ec_current.pdf 69 eMarketer (2013) Total US Retail Sales Top $4.5 Trillion in 2013, Outpace GDP Growth - http://www.emarketer.com/Article/Total-US-Retail-Sales-Top-3645-Trillion-2013-Outpace-GDP-Growth/1010756 70 Center for Retail Research (2015) Online Retailing: Britain, Europe, US and Canada 2015 http://www.retailresearch.org/onlineretailing.php 71 USDOC (2015). "Quarterly Retail E-commerce Sales: 4th Quarter 2014." US Census Bureau News.

Bulletproof Problem Solving
by Charles Conn and Robert McLean
Published 6 Mar 2019

Exhibit 1.3 shows one way of defining airport supply capacity (number of runways, capacity of each runway, and utilization) and demand (Sydney's share of regional demand). In the short term, the number of runways is fixed, and so is runway capacity (defined mostly by aircraft type). EXHIBIT 1.3 Candidates would typically explain their approach to modeling demand growth by making different assumptions about gross domestic product (GDP) growth, fuel costs, and relative location attractiveness of Sydney relative to other destinations (see Exhibit 1.4). EXHIBIT 1.4 But the most productive approach to this problem is to go deeper into runway utilization, as it is one of the few variables that can be actively managed by transportation planners.

This involves spelling out all of the assumptions implicit in the perspective, and all the implications. One example of “What would you have to believe?” involved looking at a growth company's share price during the dot‐com era. To justify the share price earnings had to grow at 40% compound for the next five years, then at double the US GDP growth rate in perpetuity! That is an unbelievably high growth expectation … and was not achieved, leading to a stock price crash for the company. Team distributed votingThere is often disagreement when pruning branches on a logic tree, or when assigning priorities in the analysis work planning. If you aren't careful, the most articulate or senior team member can inappropriately sway the conversation.

pages: 232 words: 70,835

A Wealth of Common Sense: Why Simplicity Trumps Complexity in Any Investment Plan
by Ben Carlson
Published 14 May 2015

Recessions since 1929 Recession GDP Contraction August 1929–March 1933 –26.7% May 1937–June 1938 –18.2% February–October 1945 –12.7% November 1948–October 1949 –1.7% July 1953–May 1954 –2.6% August 1957–April 1958 –3.7% April 1960–February 1961 –1.6% December 1969–November 1970 –0.6% November 1973–March 1975 –3.2% January1980–July 1980 –2.2% July 1981–November 1982 –2.7% July 1990–March 1991 –1.4% March 2001–November 2001 –0.3% December 2007–June 2009 –4.3% Source: National Bureau of Economic Research. The stock market is cyclical just like the economy, so most would assume that large losses in the stock market should coincide with a contraction in GDP growth. If only it were that easy. According to Professor Jeremy Siegel, since World War II, there have been 13 instances where the Dow Jones Industrial Average fell at least 10 percent without the economy experiencing a recession (see Table 4.5). That means the market has fallen an average of 20 percent every five years or so without the economy going into a recession.4 Table 4.5 Stocks Fall 10 Percent or More with No Recession 1946–1947 –23.2% 1961–1962 –27.1% 1966 –22.3% 1967–1968 –12.5% 1971 –16.1% 1978 –12.8% 1983–1984 –15.6% 1987 –35.1% 1997 –13.3% 1998 –19.3% 2002 –31.5% 2010 –13.6% 2011 –16.8% Source: Stocks for the Long Run.

That means the market has fallen an average of 20 percent every five years or so without the economy going into a recession.4 Table 4.5 Stocks Fall 10 Percent or More with No Recession 1946–1947 –23.2% 1961–1962 –27.1% 1966 –22.3% 1967–1968 –12.5% 1971 –16.1% 1978 –12.8% 1983–1984 –15.6% 1987 –35.1% 1997 –13.3% 1998 –19.3% 2002 –31.5% 2010 –13.6% 2011 –16.8% Source: Stocks for the Long Run. The stock market and the economy are rarely in sync with one another. Economic growth tells us very little about where the stock market is going next. Over a one-year period the relationship between GDP growth and stock market returns is next to nothing (a correlation of 0.01 where 0 implies no relationship between the data and 1.0 implies a perfect relationship between movements in the data). Even looking out over a 10-year period there's not a close relationship between the two (a correlation of just 0.05).5 Repeat the following mantra to yourself on a consistent basis: The stock market is not the economy, the stock market is not the economy. . . .

pages: 476 words: 125,219

Digital Disconnect: How Capitalism Is Turning the Internet Against Democracy
by Robert W. McChesney
Published 5 Mar 2013

Notes Index LIST OF ILLUSTRATIONS Chart 1.Number of work stoppages involving 1,000 or more workers Chart 2.Income share of the bottom 99.5 percent Chart 3.Income share of the top 1 percent Chart 4.Labor productivity and labor compensation Chart 5.Number and percentage of concentrated U.S. manufacturing industries Chart 6.Revenue of the top 200 U.S. corporations as a percent of total business revenue Chart 7.Real U.S. GDP growth Chart 8.Voter turnout by income in presidential elections Chart 9.Voter turnout by income in interim elections Table 1.Journalism funding and democracy Chart 10.Investment in information processing equipment and software equipment as a percent of total nonresidential private fixed investment PREFACE When I was young, in the late 1960s and early 1970s, I was attracted to the political left, like many of my generation.

This hope was the basis for the commotion over the New Economy in the 1990s. On the one hand, the commanding heights of corporate capitalism today are digital. Investment has flooded the Internet and information technology. On the other hand, the evidence that this is translating into any sort of economic growth surge to date is underwhelming. Chart 7. Real U.S. GDP growth Source: Bureau of Economic Analysis, “Percent Change from Preceding Period in Real Gross Domestic Product,” Table 1.1.1, bea.gov. Stagnation is here, and that is bad news for most people. The evidence also suggests that the greater the degree of inequality in the economy, the greater the likelihood of slower economic growth and stagnation.

See foundation grants Great Britain, 26, 27, 201, 281n169 Great Depression, 229–30 The Great Divergence (Noah), 35 Greece, ancient. See ancient Greece greed, 28–29, 217 Greenwald, Glenn, 89–90, 163–64, 174, 195 Greider, William, 43 Griffin, Jodie, 260n26 Griswold, Erwin, 169 Gross Domestic Product (GDP), growth rate decline of, 48 Gruening, Ernest, 89 The Guardian, 201 Habermas, Jürgen, 66 Hacker, Joseph, 30 hackers and hacker culture, 102, 105 Hanke, John, 100 happiness and unhappiness, 45, 241n72, 280n158. See also loneliness harassment and arrest of journalists, 209 Hartford Courant, 277 Hastings, Michael, 89, 90, 170 Hayek, Friedrich, 39 Hayes, Chris, 230, 232 Hayes, Rutherford B., 55–56 health care, 116, 117, 118 hedge funds, 185, 200, 275n65 Hegyi, Gyula, 245n5 High-Tech Heretic (Stoll), 10 Hindman, Matthew, 190–91, 196 “hindsight journalism,” 181 Homeland Security Department.

pages: 782 words: 187,875

Big Debt Crises
by Ray Dalio
Published 9 Sep 2018

Between March and July nondurable manufacturing production increased 35 percent while durable manufacturing increased 83 percent. Unemployment fell and over the next three months, wholesale prices jumped by 45 percent.186 These were all rebounding from very depressed levels and fed on themselves to make a beautiful deleveraging. Note how the level of GDP growth was above the level of interest rates. 1935: The Goldilocks Period The economy and the markets continued to recover through 1934 and into 1935, when the Federal Reserve began contemplating tightening once again. By 1935 the economy had recovered, deflation had disappeared, and stock prices had soared as a result of the Fed’s earlier policies.

Compared to other countries, the US financial system experienced: A relatively fast speed at which the financial system was recapitalized (and that TARP capital was repaid) A relatively fast speed at which they unwound emergency credit programs Good overall financial returns on the rescue across the various programs. We will end this case study here, because in the second quarter of 2011 real GDP returned to its pre-crisis levels. This wasn’t the end of the recovery by any means. There was still plenty of slack in the economy and a self-reinforcing upward cycle. The charts below show the unemployment rate, GDP growth, the GDP gap (showing the estimated amount of slack in the economy’s capacity to produce), and the S&P 500 stock market index from 2006 until the writing of this on the tenth anniversary of the 2008 Lehman debt crisis. The shaded bars show where they were in 2Q 2011. The second set of charts show existing and projected debt-to-GDP ratios from 1920 until 10 years from now.

For each gauge, the difference from zero conveys the extent of the bubble while the crossing above/below zero represents the shifting into or out of the bubble. The Reflation Phase In this case, the resolution of the debt problems was very slow, as monetary policy was not sufficiently easy to push nominal GDP growth above nominal interest rates for quite some time. Eventually, however, policy makers were able to provide enough stimulation to turn the deleveraging into a beautiful one and create a period of reflation, which began in 2013. In terms of monetary policy, M0 increased by 58% of GDP, interest rates were ultimately pushed down to 0%, and real FX averaged -10% during the stimulative phase.

pages: 619 words: 177,548

Power and Progress: Our Thousand-Year Struggle Over Technology and Prosperity
by Daron Acemoglu and Simon Johnson
Published 15 May 2023

In addition to GDP per capita, total factor productivity (TFP) growth is an informative measure of economic growth, in part because it takes out the contribution of increases in the capital stock (machinery and buildings). The TFP growth rate is therefore a better measure of technological progress, for it picks up how much GDP growth comes from technological changes and efficiency improvements. US TFP growth (in the nonagricultural, nongovernment sector) between 1891 and 1939 averaged less than 1 percent per year. Between 1940 and 1973, it rose to an average of almost 2.2 percent per year. This was not driven just by the boom during and in the immediate aftermath of the war.

Focusing on the same measure of productivity we discussed in Chapter 7, total factor productivity (TFP), US average growth since 1980 has been less than 0.7 percent, compared to TFP growth of approximately 2.2 percent between the 1940s and 1970s. This is a remarkable difference: it means that if TFP growth had remained as high as it had been in the 1950s and 1960s, every year since 1980 the US economy would have had a 1.5 percent higher GDP growth rate. The productivity slowdown is not just a problem of the era following the global financial crisis of 2008. US productivity growth between the booming years of 2000 and 2007 was less than 1 percent. This evidence notwithstanding, technology leaders maintain that we are lucky to be alive in this age of technology and innovation.

The chief economist of Goldman Sachs, Jan Hatzius, agrees: “We think it is more likely that the statisticians are having a harder and harder time accurately measuring productivity growth, especially in the technology sector.” He reckons that the true productivity growth of the US economy since 2000 could be several times greater than statistical agencies’ estimates. In principle, consumer and productivity benefits from new technologies should be in the TFP numbers we reported, which are based on GDP growth adjusted for changes in prices, quality, and product variety. Thus, products that significantly increase consumer welfare should translate into much higher TFP growth. In practice, of course, such adjustments are imperfect, and mismeasurement can arise. Nevertheless, these problems are unlikely to explain away the productivity slowdown.

pages: 192

Kicking Awaythe Ladder
by Ha-Joon Chang
Published 4 Sep 2000

According to the estimate by Maddison 1989, the average per capita GDP growth rate for the nine largest Asian developing countries (Bangladesh, China, India, Indonesia, Pakistan, the Philippines, South Korea, Taiwan, and Thailand) during 1900-50 was 0 per cent p.a.. During this period, Taiwan and the Philippines grew at 0.4 per cent p.a., Korea and Thailand at 0.1 per cent p.a.. China grew at -0.3 per cent p.a., the South Asian countries and Indonesia at -0.1 per cent. These countries were, however, able to generate much faster growth after the end of colonial rule. The average per capita GDP growth rate for the 1950-87 period for these countries was 3.1 per cent p.a..

Where Does Money Come From?: A Guide to the UK Monetary & Banking System
by Josh Ryan-Collins , Tony Greenham , Richard Werner and Andrew Jackson
Published 14 Apr 2012

First implemented by the German Reichsbank in 1912, credit controls were copied by the Federal Reserve in the 1920s (and had the greatest impact in economic history when adopted by the Japanese, Korean and Taiwanese central banks in the early 1940s during WWII) and then continued for many decades in the post-war era.60 Called ‘window guidance’ in these countries, the central bank determined desired nominal GDP growth, then calculated the necessary amount of credit creation to achieve this and then allocated this credit creation both across the various types of banks and across industrial sectors.61 Unproductive credit creation was suppressed because financial credit creation, such as today’s large-scale bank lending to hedge funds, simply produces asset inflation and subsequent banking crises.

The QE policies of the Bank of England, the Federal Reserve, the ECB and the Bank of Japan show that, in times of crisis, there is nothing to stop central banks creating vast quantities of credit to support the existing financial system. However, the type of QE policies adopted do not appear to have been effective in boosting GDP growth and employment, as the additional purchasing power remains within the financial sector when bank and investor confidence is low (see section 4.7.3 on QE). Historically, however, there are a number of examples of central banks creating new credit to be spent directly by the Government of the time in to the national economy.

pages: 352 words: 80,030

The New Silk Roads: The Present and Future of the World
by Peter Frankopan
Published 14 Jun 2018

, World Inequality Database Working Paper Series No. 2017/11. 41Boston Consulting Group, The New Indian: The Many Facets of a Changing Customer (March, 2017). 42Bain & Co., Luxury Goods Worldwide Market Study, Fall–Winter 2017, 22 December 2017; Yiling Pan, ‘Luxury Spending to Double in China Over Next 10 Years, Says McKinsey’, Jing Daily, 15 June 2017. 43CPP Luxury, ‘Prada Group opens seven stores in Xi’an China’, 25 May 2018. 44Astrid Wendlandt, ‘Chanel snaps up four companies to secure high-end silk supplies’, Reuters, 22 July 2016; Yiling Pan, ‘China Wants Fewer Burberry and BV Handbags, More Chanel and Hermès’, Jing Daily, 23 April 2018. 45Angelica LaVito, ‘Starbucks is opening a store in China every 15 hours’, South China Morning Post, 6 December 2017. 46Cleofe Maceda, ‘UAE’s residents’ luxury goods spending to reach more than $8 billion in 2017’, Gulf News, 20 November 2017. 47Associated Press, ‘China’s new baby policy lifts stocks, sinks condom maker’, 30 October 2015. 48Credit Suisse, Spotlighting China’s new two child policy, 30 October 2015. 49CLSA, Chinese Outbound Tourism – New 2017 Report (2017). 50World Bank, GDP Growth (annual percentage) at https://data.worldbank.org/indicator/NY.GDP.MKTP.KD.ZG 51Wouter Baan, Lan Luan, Felix Poh, Daniel Zipser, ‘Double-clicking on the Chinese consumer. 2017 China Consumer Report’, McKinsey & Company, 2017. 52Bangalore Water Supply and Sewerage Board, Bengaluru Water Supply and Sewerage Project (Phase 3) in the State of Karnataka, India.

Asian Development Bank Special Report: Coming up Fast (April 2018). 32‘China to establish court for OBOR disputes’, Asia Times, 25 January 2018. 33Saptarshi Ray, ‘China to tunnel beneath Himalayas for Nepal railway link’, The Times, 23 June 2018. 34Anil Giri, ‘China looks at Nepal as potential gateway to South Asia, expands footprints in market’, Hindustan Times, 19 October 2017. 35Turloch Mooney, ‘New Asia–Europe rail services added amid weak ocean rates’, Journal of Commerce, 31 May 2016. 36An additional ten containers were unloaded at Duisberg, Railway Gazette, ‘First China to UK rail freight service arrives in London’, 18 January 2017. 37Dirk Visser, ‘Snapshot: The World’s Ultra-Large Container Ship Fleet’, The Maritime Executive, 2 June 2018. 38Quoted in the Economist, ‘Western firms are coining it along China’s One Belt, One Road’, 3 August 2017. 39Goldman Sachs, ‘The Rise of China’s New Consumer Class’ at http://www.goldmansachs.com/our-thinking/macroeconomic-insights/growth-of-china/chinese-consumer/ 40Zhidong Li, Kokichi Ito and Ryoichi Komiyama, Energy Demand and Supply Outlook in China for 2030 and A Northeast Asian Energy Community – The automobile strategy and nuclear power strategy of China (2018). 41Robin Mills, ‘China’s Big Play for Middle East Oil’, Bloomberg, 10 May 2017; Elena Mazneva, Stephen Bierman and Javier Blas, ‘China Deepens Oil Ties With Russia in $9 Billion Rosneft Deal’, Bloomberg, 8 September 2017; Anthony Dipaola and Aibing Guo, ‘China’s CNPC pays $1.18 billion for concessions in Abu Dhabi’, World Oil, 21 March 2018. 42US Energy Information Administration, ‘China surpassed the United States as the world’s largest crude oil importer in 2017’, 5 February 2017. 43Reuters, ‘Kazakhstan to produce nuclear fuel for China’, 26 May 2017. 44Fred Gale, James Hansen and Michael Jewison, China’s Growing Demand for Agricultural Imports, US Department of Agriculture, (2014), pp. 11–12. 45China Water Risk, ‘North China Plain Groundwater’, statement, 26 February 2013. 46South China Morning Post, ‘Air quality worsening in China’s Yangtze River Delta in 2018, figures show’, 23 May 2018. 47Li Gao, ‘Greening Chinese Patent Law to Incentivize Green Technology Innovation in China’, in Yahong Li, The Role of Patents in China’s Industrial Innovation (Cambridge, 2017), pp. 79–105. 48See, for example, Xinhua, ‘President vows vast battle with pollution’, 19 May 2018. 49International Monetary Fund, Press release 18/200, ‘IMF Staff Completes 2018 Article IV Mission to China’, 29 May 2018. 50Yan Chunlin, ‘Visible and invisible hand in creating and reducing overcapacity’, in Scott Kennedy (ed.), State and Market in Contemporary China: Toward the 13th Five-Year Plan (Lanham, 2016), pp. 30–32; Peter Ferdinand, ‘Westward ho – The China dream and “one belt, one road”: Chinese foreign policy under Xi Jinping’, International Affairs 92.4 (2016), pp. 941–57. 51Andrei Kirillov, ‘В Казахстане регулярно говорят о некачественном ремонте дорог’, Kapital, 26 June 2014. 52Asian Development Bank, Meeting Asia’s Infrastructure Needs (2017). 53ICE, PeopleResearch on India’s Consumer Economy, 360° survey 2016. 54Tom Hancock, ‘US fast food chains chase growth in small-town China’, Financial Times, 18 October 2017; Salvatore Babones, ‘China’s middle class is pulling up the ladder behind slowly’, Foreign Policy, 1 February 2018. 55Tom Hancock and Wang Xueqiao, ‘China’s smaller cities compete to increase population’, Financial Times, 20 July 2018. 56Zhao Lei, ‘Xinjiang’s GDP growth beats the national average’, China Daily, 20 October 2017; Frank Tang, ‘Xinjiang halts all government projects as crackdown on debt gets serious’, South China Morning Post, 4 April 2018. 57Joseph Hope, ‘Returning Uighur Fighter and China’s National Security Dilemma’, China Brief 18(13), 25 July 2018. 58Emily Feng, ‘Crackdown in Xinjiang: Where have all the people gone?’

pages: 245 words: 75,397

Fed Up!: Success, Excess and Crisis Through the Eyes of a Hedge Fund Macro Trader
by Colin Lancaster
Published 3 May 2021

Because the money came from the Fed and not the Treasury, there was no congressional oversight of how the funds were doled out. 8 “Growth in a Time of Debt,” also known by its authors’ names as Reinhart–Rogoff, is an economics paper by American economists Carmen Reinhart and Kenneth Rogoff. The paper argues that when “gross external debt reaches 60% of GDP,” a country’s annual growth declines by 2%, and “for levels of external debt in excess of 90%,” GDP growth is “roughly cut in half.” Appearing in the aftermath of the financial crisis of 2007–2008, the evidence for the 90% debt threshold hypothesis provided support for pro-austerity policies. 9 Thank you Hunter Thompson. Chapter 2 Viva Las Vegas November 2019 11/1/19—Christine Lagarde officially becomes president of the European Central Bank. 11/1/19—Payrolls +128K, beating estimates; priors revised higher; unemployment to 3.6%. 11/13/19—US federal budget deficit tops $1T for the first time since 2013. 11/17/19—Protests in Hong Kong escalating.

He loves having the spotlight. He even dressed up for this. He turns to his summary slide. It tells us that the global economy is flat-lining. The Big D’s trade war with China, while now resolved, still has the global supply chain heaving. Data has stabilized in the USA, but globally, it’s fragile; global GDP growth is the lowest since the GFC. Only 10% of the world is in expansion and world trade actually declined last year. That rarely happens. In the USA, industrial production is down, the third straight year-over-year decline. “Overall, this is not good,” he says. “And it’s all compounded by the debt that we’ve piled on.

China's Superbank
by Henry Sanderson and Michael Forsythe
Published 26 Sep 2012

“Whoever gives them the better rating gets the business,” Dagong’s fiery chairman, Guan Jianzhong told us. “This is very dangerous.” While there is no way of telling what quality of assets CDB was left with, the experience of cities like Chongqing, where GDP growth was 16.4 percent in 2011, showed that for all its problems, there is sheer genius behind the model. Chen Yuan of CDB had realized in 1998, before other banks, the force of urbanization and its role in economic growth. China long ago decided that the key to GDP growth is boosting productivity, and few economic events boost the productivity of a populace than moving them from life on a farm to life in the city. And that’s exactly what happened in Dawu village to Li Liguang.

pages: 454 words: 134,482

Money Free and Unfree
by George A. Selgin
Published 14 Jun 2017

Unemployment Rate, 1869–2009 Figure 8.7: Dynamic Responses of Output and Money to Aggregate Demand Shocks, Pre-Fed and Post–World War II Figure 8.8: Annual Federal and State and Local Spending Relative to GDP, 1902–2009 Figure 8.9: U.S. Bank Failures as Percentage of All Banks, 1896–1955 Figure 8.10: Federal Reserve Credit and Components, Monetary Base, and Excess Reserves, 2007–10 Figure 8.11: Nominal GDP Growth and Inflation, 2000–10 Figure 8.12: Real Price of Gold, 1861–2009 Table 4.1: Formation of National Banks, 1863–66 Table 4.2: New York Bank-Note Discounts, October 1863 Table 4.3: Chicago Bank-Note Discounts, October 1863 Table 6.1: Deposits of the Eight Largest New York City Banks, October 21, 1913 Table 6.2: Bankers’ Balances in Six Largest New York National Banks, 1913 and 1926 Table 8.1: Characteristics of Quarterly Inflation Table 8.2: Output Volatility, Alternative GNP Estimates Table 8.3: Contribution of Aggregate Supply Shocks to Output Forecast Error Variance INTRODUCTION IF ONE INSTITUTION CAN BE SAID TO exercise a greater influence than any other on the economic well-being of the world’s citizens, that institution must surely be the Federal Reserve System.

Consequently, that episode seems especially likely to reflect a genuine if belated improvement in the conduct of monetary policy. We next turn to research concerning this possibility. THE “GREAT MODERATION” The beginning of PaulVolcker’s second term as Fed chairman coincided with a dramatic decline in the volatility of real output that lasted through the Alan Greenspan era. Annual real GDP growth, for example, was less than half as volatile from 1984 to 2007 as it was from 1959 to 1983. The inflation rate, having been reduced to lower single digits, also became considerably less volatile. Many, including Alan Blinder (1998), Romer (1999), Thomas Sargent (1999), and Bernanke (2004), have regarded this “Great Moderation” of inflation and real output as evidence of a substantial improvement in the Fed’s conduct of monetary policy—a turn to what Blinder (1998: 49) terms “enlightened discretion.”18 Bernanke (2004), conceding that the high inflation in the 1970s and early 1980s was largely due to excessive monetary expansion aimed at trying to maintain a below-natural rate of unemployment, argues similarly that Fed authorities learned over the course of that episode that they could not exploit a stable Phillips curve; Romer (1999: 43) claims that, after the early 1980s, the Fed “had a steadier hand on the macroeconomic tiller.”19 The “enlightened discretion” view has, however, been challenged by statistical studies pointing to moderating forces other than improved monetary policy.

At the same time, however, it began paying interest on excess reserves, thereby increasing the demand for such reserves, while also arranging to have the Treasury sell supplemental bills and deposit the proceeds in a special account. Thanks in part to these special measures, bank lending, nominal GDP, and the Consumer Price Index (CPI), instead of responding positively to the doubling of the monetary base, plummeted (see Figure 8.11).33 Figure 8.11: Nominal GDP Growth and Inflation, 2000–10 NOTES: Quarterly data, year-to-year growth rates. Finally, rather than pursue a consistent policy—a less emphasized but not less important component of Bagehot’s advice—the Fed unsettled markets by protecting the creditors of some insolvent firms (Bear Stearns) while allowing others (Lehman Brothers) to suffer default.

Super Continent: The Logic of Eurasian Integration
by Kent E. Calder
Published 28 Apr 2019

The package fortuitously emerged just before the December 2008 inaugural G-20 summit and was previewed by Hu Jintao and George W. Bush only a day before its formal announcement. The package played a key Eurasia in the Making 65 role in allowing China to become a key stabilizer for the world economy in a period of extraordinary post–Lehman Shock turbulence. China, after all, maintained a GDP growth rate of nearly 10 percent during 2008 –2009, as the world’s third largest economy, while the rest of the globe was desperately struggling. China’s massive stimulus of 2008 –2009 centered on huge road and railway infrastructure projects linking far-flung areas of China domestically while also strengthening transport links to the broader Eurasian continent, powerfully leveraging China’s rise as a major power within both Eurasia and global affairs more generally.

Neil Robinson, “The Global Economy, Reform and Crisis in Russia,” Review of International Political Economy 6, no. 4 (Winter 1999): 531– 64. 21. Jacopo M. Pepe, Continental Drift — Germany and China’s Inroads in the “GermanCentral European Manufacturing Core”: Geopolitical Chances and Risks (Washington, DC: Reischauer Center for East Asian Studies, 2017), 12 –13. 22. World Bank, “GDP Growth (Annual %),” World Development Indicators (2017), accessed October 18, 2018. The only one of the ten fastest growing members of the EU that joined before 2004 was Ireland. 23. See Graz. yna Szymańska-Matusiewicz, “The Vietnamese Communities in Central and Eastern Europe as Part of the Global Vietnamese Diaspora,” Central and Eastern European Migration Review 4, no. 1 ( June 2015): 5. 24.

See Ma Si, “Made in China 2025 Roadmap Updated,” China Daily, January 27, 2018, http://​www​.chinadaily​.com​.cn/​a /​201801/​27/​WS5a6bb8b9a3106e7dcc137168​.html. 10. See Mark J. Greeven and Wei Wei, Business Ecosystems in China: Alibaba and Competing Baidu, Tencent, Xiaomi and LeEco (New York: Routledge, 2018), 13 –14. 11. World Bank, “GDP, PPP (Constant 2011 International $),” World Development Indicators, accessed October 23, 2018. 12. World Bank, “GDP Growth (Annual %),” World Development Indicators, accessed October 23, 2018. 13. Central Intelligence Agency, “Country Comparison: Public Debt,” The World Factbook, accessed October 23, 2018. 14. See Zongyuan Liu, “Sovereign Leveraged Funds: Comparative Analysis of Using Foreign-Exchange Reserves as a Source of State-Led Finance and Investment in China and Japan.”

pages: 611 words: 130,419

Narrative Economics: How Stories Go Viral and Drive Major Economic Events
by Robert J. Shiller
Published 14 Oct 2019

Traditionally, economists who study data have excelled in creating abstract theoretical models and in analyzing short-run economic data. They can accurately forecast macroeconomic changes a couple quarters into the future, but for the past half century, their one-year forecasts have been on the whole worthless. When assessing the probability that quarterly US GDP growth will be negative one year in the future, their predictions have had no relation to actual subsequent negative growth rates.5 There have been, according to a Fathom Consulting study, 469 recessions (defined as a decline in a country’s GDP over a year) in 194 countries forecasted since 1988 by the International Monetary Fund in its biannual World Economic Outlook.

See also causality between narratives and events; depressions; economic behavior affected by narratives; recessions economic fluctuations: driven by attention-getting narratives, 86; leading indicators approach to, 125; seen as repetitive and forecastable, 124–25; self-fulfilling prophecies and, 73–74 economic forecasting: analogy to weather forecasting, 123–25; ARIMA models in, 295; business cycle and, 124–25; causes of events and, 71; economists’ poor record of, xiii–xv, 301nn5–6; epidemic models and, xi, 295; leading indicators approach to, 125, 309n10; many different narratives required for, 267; moral imperative of, xv–xvii; promise of narrative economics for, xi, xiv–xv, 13, 277; self-fulfilling prophecy in, 123–24, 198 economic growth: inflation and, 319n10; supply-side economics and, 48. See also GDP growth in US economic institutions, importance of narratives and, 3, 14 economic man, as rational optimizer, 120 economic models, contagion of, 24–28, 27f economic narratives: analytical value of looking at, 238; anniversaries of past events and, 76; confluence of, 29–30; creative and innovative, 75; defined, 3; distorting professional narratives, xiii; geographic pattern of spread, 296, 299; history of, going back to ancient Rome, 58–60; human significance of stories and, 79–80; immense complexity of landscape of, 266–67; international, 110; judging which are important, 89–91; key features of, 87; medical model of epidemics and, 21–23; names attached to, 94–95; narratives that become economic, 74; originating with one or a few people, 71–72; oversimplified variants of, 26; predictable workings of, 77; recurrence of, 107–8, 109–10, 238; self-censorship of, encouraging panic, 115; seven key propositions with respect to, 103.

See Silverites Friedman, Irving S., 262, 263 Friedman, Milton, 73, 132–33, 307n3 “From each according to his ability, to each according to his needs,” 102 frugality narratives: American Dream narrative in contradiction to, 155; in Great Depression, 136–37, 142–43, 252; in Japan after 1990, 150 Galbraith, John Kenneth, 233 Gallup, George, 118–19 Gallup Data Collection, 284 gambling culture, and booming stock market, 29 Garber, Peter, 5 Garrett, Geoffrey, 299 GDP data, limited value of, 74–75 GDP growth in US: not successfully forecast, xiv, 301n5. See also economic growth The General Theory of Employment, Interest, and Money (Keynes), 27 geographic pattern of spread, of economic narratives, 296, 299 George, Henry, 111, 178–79, 188, 209, 310n1 Germany: hyperinflation after World War I, 247, 266; reparations from World War I and, xvii–xviii Glass, Carter, 191 Gödel, Escher, Bach (Hofstadter), 47 Goetzmann, William, 67 “going viral”: appearing in newspapers around 2009, x; mathematical model of epidemic and, 293.

pages: 76 words: 20,238

The Great Stagnation
by Tyler Cowen
Published 24 Jan 2011

Yet we are still valuing government expenditures at cost rather than being able to measure prices set in a competitive market. To better measure how well we are doing as a nation, remember this about productivity:1. The larger the role of government in the economy, the more the published figures for GDP growth are overstating improvements in our living standard. This is true whether you love or hate activist government. When calculating a rate of economic growth, we want to know, among other things, how much better government is today than yesterday. It’s about the change in useful outputs, not about the absolute level of how good government is.

pages: 285 words: 81,743

Start-Up Nation: The Story of Israel's Economic Miracle
by Dan Senor and Saul Singer
Published 3 Nov 2009

Yet Israel’s share of the global venture capital market did not drop—it doubled, from 15 percent to 31 percent. And the Tel Aviv stock exchange was higher on the last day of the Lebanon war than on the first, as it was after the three-week military operation in the Gaza Strip in 2009. Figure I.4. Sources: “Miracles and Mirages,” Economist, April 13, 2008; “GDP Growth Rates by Country and Region, 1970–2007,” Swivel, http://www.swivel.com/data_columns/spreadsheet/2085677. The Israeli economic story becomes even more curious when one considers the nation’s dire state just a little over a half century ago. Shai Agassi’s family immigrated to Israel from Iraq in 1950, two years after Israel’s founding.

Although Singapore’s military is modeled after the IDF—the testing ground for many of Israel’s entrepreneurs—the “Asian Tiger” has failed to incubate start-ups. Why? It’s not that Singapore’s growth hasn’t been impressive. Real per capita GDP, at over U.S. $35,000, is one of the highest in the world, and real GDP growth has averaged 8 percent annually since the nation’s founding. But its growth story notwithstanding, Singapore’s leaders have failed to keep up in a world that puts a high premium on a trio of attributes historically alien to Singapore’s culture: initiative, risk-taking, and agility. A growing awareness of the risk-taking gap prompted Singapore’s finance minister, Tharman Shanmugaratnam, to drop in on Nava Swersky Sofer, an Israeli venture capitalist who went on to run Hebrew University’s technology transfer company.

pages: 275 words: 84,980

Before Babylon, Beyond Bitcoin: From Money That We Understand to Money That Understands Us (Perspectives)
by David Birch
Published 14 Jun 2017

The Chief Cashier essentially said that their latest figures show that only about a quarter of the cash that they put into circulation is for transactional purposes (i.e. used): the rest of it is either shipped overseas (i.e. exported), which we will put to one side for the moment; kept outside of the banking system (i.e. hoarded); or used to support the shadow economy (i.e. stashed). In other words, it is not in circulation at all but stuffed under mattresses. If you look at the trend growth of that cash ‘in circulation’ over the last few years, it has accelerated well ahead of trend GDP growth as well as past trend ATM withdrawal growth (figure 18). And we also know that the use of cash in retailing has continued to fall steadily, so the ‘cash gap’ between the small amount of cash that is used to support the needs of commerce and the large amounts of cash that are used for other purposes has been growing.

If it were likely to destabilize our democratic system, the FBI would simply set up their own assassination market and put a few quid on Kuwabatake Sanjuro. (Come to that, how do we know that Kuwabatake Sanjuro isn’t the FBI anyway?) Transaction reporting If non-fiat electronic money did become the primary means of payment, then it would be nearly impossible to effect national economic management. How would the government know whether GDP growth was good or bad if it had no way of knowing what GDP was? In this category, e-cash is really a symptom of fundamental change: as the developed economies have become information economies, the problem of trying to measure, assess and control those economies has sharpened. Economists already wonder about existing measures.

pages: 287 words: 82,576

The Complacent Class: The Self-Defeating Quest for the American Dream
by Tyler Cowen
Published 27 Feb 2017

In total, only 4 percent of African American families are moving along the lines of that trend, so this is nothing like the great migrations of times past.7 As late as the 1980s, when I was living in Germany, I recall bragging to my German friends that about a fifth of American households picked up and moved in a given year. At that time, America was living through an economic boom that saw high GDP growth and rapid job creation, while much of Europe was mired in persistent double-digit unemployment. Although my German friends already had the sense of America as a highly mobile country, they nonetheless found that statistic almost impossible to believe. For so many of them, their aspiration was to buy a house, or inherit one, in the city or region where they grew up and where their parents were still living.

Millennials as a generation just don’t seem that interested in grand projects, unless of course you count wired interconnectivity, at which they excel. ARE THE PESSIMISTS UNDERVALUING TECH INNOVATIONS? To close this chapter, I’d like to look a bit more closely at the link between our failure to innovate and our standard of living. It’s commonly asserted that real GDP growth and real productivity growth are much higher than what turns up in the published numbers. Many of today’s economic optimists cite a bunch of supposedly “free” goods that are making us much, much better off, though we do not pay for them. The most common examples of these goods are Google, Facebook, and Wikipedia.

pages: 305 words: 79,303

The Four: How Amazon, Apple, Facebook, and Google Divided and Conquered the World
by Scott Galloway
Published 2 Oct 2017

You need builders, people who can program software, and who have a sense for the intersection of tech and something that adds value to the enterprise and/or the consumer. The best engineers and managers for that task come from, in greater proportions, the best universities. In addition, two-thirds of the world’s GDP growth over the next fifty years will occur in cities. Cities will not only attract the best talent, but manufacture the best talent. The competition and opportunities are similar to rallying with Chris Evert—your game just gets better. In many countries, like the UK and France, one city is responsible for 50 percent of the nation’s GDP.

Also, we are hunter-gatherers and are happiest and most productive when in the company of others and in motion.3 More than 80 percent of the world’s GDP is generated in cities, and 72 percent of cities outperform their own countries in growth. Every year, a greater percentage of GDP moves to cities, and it will continue to do so. Thirty-six of the hundred largest economies in the world are U.S. metropolitan areas, and in 2012, 92 percent of jobs created and 89 percent of GDP growth came from those same cities. And not all cities are equal—the global economic capitals are becoming supercities. New York and London consistently rank as some of, if not the, most powerful cities in the world. Developers are also keen to invest in wealthier cities, where they can expand accordingly (think of Manhattan businesses that are expanding to Brooklyn locations).

pages: 207 words: 86,639

The New Economics: A Bigger Picture
by David Boyle and Andrew Simms
Published 14 Jun 2009

The economy is supposed to serve the needs of people and planet, but the reverse is increasingly true. The privileges given to the private and financial sectors are justified by the way their success is supposed to serve the interests of society. People’s worth is increasingly judged by the value they create in the economy contributing to GDP growth, a process that seems to have been internalized so that people often see material possessions as the main source of self-worth. Yet beyond a relatively low level of satisfying needs, we are no happier. Thanks to the deregulation of capital controls, the state itself is also increasingly subordinate to the needs of business and finance, and openly so.

(John Kenneth) 41, 51 gambling 14–15, 152 Gandhi, Mohandas (Mahatma) 18, 19, 21, 110, 112 Gates, Bill 141 Gates, Jeff 141–2 GDP (gross domestic product) 10, 32, 36–40, 42, 43, 54, 79 alternatives to 40–2, 43 bad measure of success 10, 37, 55, 78 INDEX global 141 UK 4 see also growth genetically modified crops see GM crops Germany 33, 50, 58 Gladwell, Malcolm 68 Global Barter Clubs 57, 58 global commons 113, 148 global currencies 56, 61, 120, 147–8 global greenback 61 global warming 3, 3–4, 115, 155 see also climate change globalization 8, 28, 143, 153 see also interdependence GM (genetically modified) crops 91, 117, 119, 140–1 Goetz, Stephan 124 gold standard 8, 143 Good Life, The (BBC sitcom) 69 goods, local 19, 109, 110 Goodwin, Fred 142 government borrowing 37–8, 49–50, 58, 62, 141 governments 2, 28, 116, 129, 158 creating money 58–9, 62, 90 propping up banking system 6, 7 Graham, Benjamin 120 Grameen Bank 26, 143–4, 153 Great Barrington (Massachusetts) 57, 151–2, 153 Great Depression 3, 36, 57 green bonds 157 green collar jobs 106, 157 Green Consumer Guide, The (Elkington and Hailes, 1988) 26, 69, 72 green economics 23, 100, 117 green energy 26, 97, 102–3, 114, 156, 157 Green New Deal 156–8 green taxation 153 greenhouse gas emissions 3–4, 115, 148 gross domestic product see GDP Gross National Happiness 43 growth 2, 11, 12–13, 23, 36–7, 38–40, 42, 43 185 bad measure of success 10, 158 maximizing 25 and poverty 4, 39–40, 81–2 and progress 39, 78 wealth defined in terms of 32 and well-being 4–5 see also GDP guilds 80, 80–1 happiness 12, 18, 29, 41, 43, 45–6 Happy Planet Index 32–3, 34, 43 Hard Times (Dickens, 1854) 36 HBOS 7 health 46, 72, 78, 96, 115, 129 health costs 117 healthcare 13, 33, 44 hedge funds 5, 7, 97, 120 Helsinki (Finland) 102 HIV/AIDS 70, 111, 135, 148 Honduras 139, 141 house prices 36, 46, 79, 83, 91, 126–7, 151 London 53, 54, 91 see also mortgages Howard, Ebenezer 105, 158 HSBC 5 human interaction 67–8, 74 human needs 20, 24, 67, 86 human rights 110–11, 116, 147 ill-health 35, 38, 46 ‘illth’ 29, 35 IMF (International Monetary Fund) 27, 82, 91, 135–6, 139, 143, 147, 147–8 incomes 24, 37, 43, 44, 78, 79, 81 and happiness 45–6 inequalities 37, 81, 82, 142 of poorest 4, 81, 82, 112, 142 Index of Sustainable Economic Welfare see ISEW India 82, 91, 110, 119, 136, 139–40, 153 indigenous knowledge 82, 117 inequality 4, 81–2, 96, 112–13, 116 inflation 8, 22, 58, 90 information technology 58, 59, 115 186 THE NEW ECONOMICS intellectual property 82, 91, 110, 113, 116, 117 interdependence 111–20, 135–8 Keynes on 19, 109, 110, 115, 143 see also globalization interest 8, 11, 11–12, 58, 77, 157 interest rates 144, 144–5 interest-free money 43, 73, 84, 90 intergenerational equity 25, 117 international bankruptcy 147 International Monetary Fund see IMF investment 14, 45, 53, 60, 104, 118, 137–8 ethical 26, 69–70, 74, 154 involvement 71, 75, 128–30 Iraq 49, 60, 136 ISEW (Index of Sustainable Economic Welfare) 40–1, 43, 78 Islamic banking 58, 90, 146 islands, small 31–2, 33–4 Italy 33, 119–20, 138 Ithaca hours currency 57, 58 It’s a Wonderful Life (film, Capra, 1946) 38 Jacobs, Jane 56, 110, 126 Jaffe, Bernie 126 Japan 26, 50, 91, 113, 119, 128 Jefferson, Thomas 18, 20 Jersey 52, 53 Jones, Allan 103 Jubilee Debt campaign 137 junk bonds 1, 142–3 just-in-time 123–4, 155 Keynes, John Maynard 2, 13–14, 15, 17, 21, 37, 55 on interdependence 19, 109, 110, 115, 143 international currency 61, 120 on local production 19, 109, 110 on ‘practical men’ as ‘slaves of some defunct economist’ 10, 35, 67, 87, 159 Keynesian economics 8, 18, 22, 27, 28 Kinney, Jill 130 Knowsley (Merseyside) 104 Kropotkin, Peter 18 Krugman, Paul 52 land 19, 82, 96 land tax 43 landfill 97, 98, 100, 107 Layard, Richard 41 Lehigh Hospital (Pennsylvania) 129 Letchworth Garden City (Hertfordshire) 105 lets (local exchange and trading systems) 57 liberalism 18, 19, 27 Lietaer, Bernard 56, 61, 120 life 19, 29, 55, 69, 86, 91 need for meaning 42, 75 life expectancy 31, 32–3, 82 life poverty 82–3 life satisfaction 31, 33, 41, 42 Lima (Peru) 130–1 Linton, Michael 57, 58 Living Economy, The (Ekins, 1986) 24–5 LM3 (Local Money 3) 60, 104–5 loans see debt Local Alchemy programme 152–3 local circulation of money 103–5, 107, 124, 151–2 local currencies 26, 56, 57, 58, 59, 60, 151–2, 153 local economies 26, 81, 85, 86, 105–7, 118, 124, 133 local exchange and trading systems (lets) 57 local food 2, 118, 119–20, 151 local governments 6, 44, 60 local life 4, 81, 158 Local Money 3 see LM3 local production 109, 116, 118 local savings schemes 61 local shops 75, 82–3, 104, 124, 124–5, 126, 151 supermarkets and 80, 105, 125 local wealth 14, 53–4 localization 155–6, 159 London 52, 53, 61, 97, 102, 103 house prices 53, 54, 91 traffic speed 65–6 INDEX London Underground 147 Lutzenberger, Jose 26 Macmillan Cancer Care 88–9 McRobie, George 22, 24 mainstream 4–5, 26, 154, 159–60 see also economics Malawi 135–6, 137 Malaysia 51 Manchester United 155 manipulated debt 139–41 markets 10, 12, 51, 70, 158 financial 1–2, 52, 53, 55, 138, 154–5 free 22, 85, 112–13 new economics and 67, 72–5, 85 Marsh Farm estate (Luton) 104–5, 152–3 Maslow, Abraham 67 materialism 12, 46–7 Max-Neef, Manfred 24 Maxwell, Robert 143 MDGs (Millennium Development Goals) 39, 136 Mead, Margaret 129 meaning, need for 42, 75 measurement problem 36–40 measuring 12, 42, 55, 85 success 2, 8, 10, 43, 44, 55, 154, 156, 158 value 10, 15, 29, 53, 59, 115 wealth 32, 37–40, 53–4 well-being 4, 18, 32–3, 34, 43 mechanics, Cuban 95–6, 97 medieval economics 78–80, 80–1 mega-rich 120, 141, 142 mental health 4, 35, 36, 46, 68, 83 Merck 99 micro-credit 26, 143–4, 145, 146, 151, 153 Milkin, Michael 142 Millennium Development Goals see MDGs minimum wage 92 misery, of UK young people 35–6 Mishan, E.J. 40 Mogridge, Martin 65–6, 74 Mondragon (Spain), cooperatives 153 money 8, 11, 13, 18, 27, 29, 36, 95 187 as a bad measure 10, 15, 18, 53, 59, 90, 143, 154 creating 7, 56–7, 58–9, 84, 90, 120, 138, 147 designed for money markets 53 economics and 25, 127 externalities 35 and life 55, 86, 154, 159 local circulation 103–5, 107, 124, 151–2 means to an end 15 new economics view 15, 59–60, 89 new ways of organizing 56–60 re-using 103–5 replacing with well-being 42 slowing down 51–2, 60 too little 57 types of 14–15, 57, 59, 120 and value 10, 15, 53, 59 and wealth 15, 19, 32, 38, 78 and well-being 18, 21, 81 see also GDP; growth; price; trickle down money flows 26, 50–2, 60, 103–5, 107, 124, 136–8 money markets 1–2, 52, 53, 55, 138, 154–5 money poverty 81–2 money system 7–8, 50–6, 60 monopolies 8, 20, 83, 84–6, 89–90, 125–6, 133, 146 Monsanto 85, 140 moral philosophy 12, 19, 72–3 morality 8, 18, 28, 74, 115 economics and 12, 19, 22 Morris, William 18, 78, 151 mortgages 1, 4, 5–6, 6, 7, 46, 91 working to pay 46, 68, 73, 77–8, 79, 81, 83, 84, 89, 126–7, 140 see also house prices motivations 4–5, 11, 67–9, 70, 71, 72, 73, 75 multinationals 14, 61, 84–5, 90, 137–8, 139, 143 multiple currencies 58, 59–60, 60, 90 multiplier effect 103–5 Murdoch, Rupert 52 188 THE NEW ECONOMICS Myers, Norman 117 Nanumaea (Tuvalu) 34 national accounting 37–8, 38–9 national debt 49–50, 83, 84, 139, 141 national grid 102, 106 National Health Service see NHS natural capital 3, 99 natural resources 22, 40, 43, 84, 97–8 needs 20, 24, 25, 67, 75, 86 basic 25, 89, 91–2, 115 nef (the new economics foundation) 24, 26, 45, 71, 104, 131–2, 145 Local Alchemy programme 152–3 see also Happy Planet Index; LM3 ‘neo-liberal’ policies 8, 27–8 Nether Wallop (Hampshire) 80, 81 The Netherlands 58, 106, 138 New Century 5 New Deal for Communities 152 New Deal (US) 157 new economics 2–3, 9–10, 18–19, 28–9, 59, 153–4, 159–60 Cuba as object lesson 96–7 history of 9–10, 18–19, 21–7 and the mainstream 26 as new definition of wealth 15 principles 35, 157–8 new economics foundation see nef New York City 52, 128 News Corporation 52 NHS (National Health Service) 87, 114, 131 Northern Rock 6 Nottingham 35 Nu-Spaarpas experiment 106 Obama, Barack 154, 157 obsolescence, built-in 98, 100, 101 odious debt 146 offshore assets 136–7 offshore financial centres 52–3, 61 oil 3, 96, 115, 117, 155 Oil Legacy Fund 157 orchards 111, 112, 115, 124 organic food 26 Ostrom, Elinor 127 out-of-town retailing 75, 80, 123, 132 overconsumption 32, 40, 44, 113 Owen, Robert 57 ownership 11, 46, 60, 91, 118, 156 paid work 87–9, 92 palm oil 112 Partners in Health 130–1 peak oil 3, 96, 117, 155 Pearce, David 25–6, 98, 115 Peasants’ Revolt (1381) 18 pensions 7, 44, 61, 73, 155 people, as assets 15, 57–8, 128–9, 130, 131 permit trading 45, 117–18, 148 personal carbon allowances 45, 117–18 personal debt 7, 36, 83–4, 91, 140, 141 Petrini, Carlo 119–20 Pettifor, Ann 135, 137 philanthropy 130, 133 policy makers 28, 35, 73, 87, 90 assumptions of 67, 68, 73, 128 Keynes on 10, 35, 67, 87, 159 political agenda 42–7 politicians 11, 54, 159 politics, new 159 pollution 10, 35, 37, 40, 98, 112, 114 by GM genes 91, 117, 119 poor 29, 145–6 Porritt, Jonathon 23 post-autistic economics 9–10, 71–2 poverty 4, 23, 35, 79–80, 81–2, 127 economic system and 13–14, 18, 29, 81–2, 154 interdependence leading to 111–15 reduction 39–40, 51–2, 61, 116, 124–5 poverty gap 4, 52–3, 78, 82 power 10, 12, 25, 28, 53, 141–2 corporate 20, 28, 85 monopoly power 83, 89–90, 125–6, 146 power relationships 29, 114 price 10, 67, 72, 73, 115, 153 Price, Andrew 132 INDEX prices 80, 156, 158 Pritchard, Alison 23 product life cycle 97–8, 101 professionals 130, 132, 133, 159 profits 12, 13, 99 progress 36, 37–8, 39, 43, 44, 77–8, 81–2, 84 Proudhon, Pierre-Joseph 120 psychology, economics and 67–8, 71, 72–3 public goods 148 public sector commissioning 131–2, 133 public services 45, 74, 127–32, 158 public transport 66, 74 ‘purchasing power parity’ 81 Putnam, Robert 126–7, 127–8 189 retirement 46, 73 see also pensions rewarded work 88 rewards 7, 8, 11, 25, 92, 141, 142 roads 66, 115 Robertson, James 17, 22, 23, 55, 145 Rockefeller, John D. 28 Roman Catholic church 19, 21, 117 Roosevelt, Eleanor 96 Roosevelt, Franklin Delano 157 Rotterdam (The Netherlands) 106 rubbish 97–105 Rupasingha, Anil 124 Rushey Green surgery (London) 131 Ruskin, John 17–18, 18, 29, 35, 78, 81 Russia 110 qoin system 58 rainforests 4, 10, 111, 112 ‘rational man’ assumption 10, 71 RBS 142 re-use 97, 99, 100–5 Reagan, Ronald 22, 27 real money, generating 120 ‘real’ wealth 2, 32, 36–40 reciprocity 44, 128, 128–30, 133 see also co-production recycling 97, 98, 100–1, 105–6, 106–7 redistribution 19, 27, 52, 96 regeneration 27, 104, 105, 107, 116, 124, 128 regional currencies 58, 59, 60 regulation 129, 156 competition 85, 113, 125, 126, 133 financial sector 53, 85, 157 relationships 4, 69, 83, 128–30 remittances 137 Rendell, Matt 33 renewable energy 26, 97, 102, 102–3, 114, 156, 157 repair 97, 98, 101, 105, 107 resources 32, 43, 97–8, 99, 100–1, 114, 158 local 25, 115 natural 22, 40, 43, 84, 97–8 St Louis (Missouri) 131 Samoa 34 Sane (South African New Economics) 58 saving seeds 91, 117, 119, 141 savings 7, 46, 73, 90, 157 schools 131 Schor, Juliet 83 Schumacher, E.F.

pages: 324 words: 80,217

The Decadent Society: How We Became the Victims of Our Own Success
by Ross Douthat
Published 25 Feb 2020

But their arguments can be effectively combined into a list of five major structural forces that make a return to pre-1970s growth rates unlikely. First is the weight of demographics—the aging of rich societies and the collapse in Western and East Asian birthrates, which combine to make existing welfare programs more expensive, future GDP growth more limited, and the culture of the developed world more cautious, complacent, and risk averse. (The causes and consequences of this trend will be discussed in more detail in chapter 2.) Second is the overhang of debt, which will get much worse as the baby boomers age and their expected health care bills come due.

Perhaps this won’t be true of China; perhaps it’s already on a different railway line. But at the very least, there should be doubts around the edges of the Chinese story. Its growth statistics are remarkable but not entirely trustworthy. There is a particularly suspicious stability since 2015, when the GDP growth rate fell to 7 percent from its once-consistent high of more than 10 percent per annum, and some measures of activity suggest that, in fact, the real growth rate has been much lower than the official numbers for the last five years. And even the official numbers show a deceleration that is taking China off the trajectory achieved by Japan and South Korea—a consequence, the Wall Street Journal’s Greg Ip suggested in a recent analysis, of China’s rapid aging, its reliance on state-driven infrastructure spending, and its substantial overhang of debt.

pages: 263 words: 80,594

Stolen: How to Save the World From Financialisation
by Grace Blakeley
Published 9 Sep 2019

The end result was the dissemination of the view that economics could be reduced to a set of neutral economic facts, which could be innocently handed over to policymakers, who would then be able to implement the “optimal” set of policies to maximise growth. From this point on, the economic success of a particular government would be judged objectively based on technocratic measures such as GDP growth, inflation, and unemployment. These metrics came to dominate the discourse of economics — particularly the almighty metric of GDP. The combination of technocratic neoclassical economics discourse and the hegemony of GDP were the nails in the coffin of political contestation over the economy — from this point forward, economics would be a self-contained, academic subject best left to the “experts”.

Summers argued that these trends could be attributed to a long-term fall in the amount of output that advanced economies could hope to produce, driven by slowing technological change and demographic shifts. The pre-crisis boom had merely disguised an underlying trend towards stagnation that had set in decades earlier. And since the crisis, the problem has only grown worse. Whilst GDP growth, wages, and employment have all fallen, Summers’ biggest worry was productivity — the long-term driver of economic growth in capitalist economies. Summers’ remarks have divided economists. Some, like Kenneth Rogoff, argue that slow growth and productivity are to be expected in the wake of a massive financial crisis.20 Households and businesses will all be attempting to deleverage at the same time, creating a Keynesian “paradox of thrift” — the kind of reverse economic multiplier caused when governments, households, or businesses cut their spending.

pages: 309 words: 81,243

The Authoritarian Moment: How the Left Weaponized America's Institutions Against Dissent
by Ben Shapiro
Published 26 Jul 2021

Memo from New Deal Srategies, Justice Democrats, Sunrise Movement, Data for Progress re: What Went Wrong for Congressional Democrats in 2020, November 10, 2020, https://www.politico.com/f/?id=00000175-b4b4-dc7f-a3fd-bdf660490000. CHAPTER 2: HOW THE AUTHORITARIAN LEFT RENORMALIZED AMERICA 1. Josh Bivens, “Inadequate GDP growth continues in the third quarter,” Economic Policy Institute, October 26, 2012, https://www.epi.org/publication/gdp-growth-picture-october-2012/. 2. “President Exit Polls,” New York Times, https://www.nytimes.com/elections/2012/results/president/exit-polls.html. 3. Barack Obama, The Audacity of Hope (New York: Crown, 2006), 11. 4. Ronald J. Pestritto, ed., Woodrow Wilson: The Essential Political Writings (Lanham, MD: Rowman & Littlefield, 2005), 77–78. 5.

pages: 290 words: 84,375

China's Great Wall of Debt: Shadow Banks, Ghost Cities, Massive Loans, and the End of the Chinese Miracle
by Dinny McMahon
Published 13 Mar 2018

Yet a few paragraphs later, he wrote, “Admittedly, shadow banking has its advantages. It helps businesses that need credit but who are unable to access it from traditional bank loans. Meanwhile, shadow banking continues to provide funds that allow certain half-finished projects to remain in construction, which spur the GDP growth rate.” The following year, Xiao became chairman of the China Securities Regulatory Commission, the agency responsible for overseeing the stock market. Rather than act on his concerns, he allowed securities companies and fund-management companies to provide many of the same shadow-banking services that had hitherto been the sole domain of the trusts, thereby presiding over a massive expansion of shadow banking just as trust companies were having their wings clipped by the banking regulator.

about a thousand trusts: “Mainland China Trust Survey 2011: Extending the Reach of China’s Financial Services,” KPMG, July 2011, 3, https://kpmg.de/docs/20110826_China-Trust-Survey-201107-4.pdf. size of China’s GDP: “Moody’s: China’s Shadow Banking System Continues to Grow; Leverage Increases Further,” Moody’s Investors Service, July 27, 2016, https://www.moodys.com/research/Moodys-Chinas-shadow-banking-system-continues-to-grow-leverage-increases—PR_352727. “GDP growth rate”: Xiao Gang, “Regulating Shadow Banking,” China Daily, October 12, 2012, http://www.chinadaily.com.cn/opinion/2012-10/12/content_15812305.htm. in foreign media: Zheping Huang, “Ignored by Beijing, These Desperate Chinese Investors Are Looking to Hong Kong,” Quartz, May 23, 2016, https://qz.com/689951/chinas-government-is-ignoring-these-desperate-investors-so-they-left-the-mainland-to-get-help/.

pages: 288 words: 85,073

Factfulness: Ten Reasons We're Wrong About the World – and Why Things Are Better Than You Think
by Hans Rosling , Ola Rosling and Anna Rosling Rönnlund
Published 2 Apr 2018

Thanks to great satellite images, we can track the North Pole ice cap on a daily basis. This removes any doubt that it is shrinking from year to year at a worrying speed. So we have good indications of the symptoms of global warming. But when I looked for the data to track the cause of the problem—mainly CO2 emissions—I found surprisingly little. The per capita GDP growth of countries on Level 4 was being carefully tracked, with new official numbers released on a quarterly basis. But CO2 emissions data was being published only once every two years. So I started provoking the Swedish government to do better. In 2009, I started to lobby for quarterly publication of greenhouse gas data: If we cared about it, why weren’t we measuring it?

See Superforecasting, by Tetlock and Gardner (2015), for more on how difficult it is for us to maintain “maybe,” and therefore a reasonable range of options, in our heads. The melting ice cap. The website Greenland Today shows the melting at the North Pole every day; see https://nsidc.org/greenland-today. Fresh numbers for GDP and CO2. The OECD regularly publishes data for its 35 rich member countries. As of December 2017, the most recent number for GDP growth is from six weeks ago. The most recent number for CO2 emissions is from three years ago; see OECD[2]. For Sweden, CO2 emissions data that is not older than three months can be found at the website for Sweden’s System of Environmental and Economic Accounts; see SCB. Climate refugees. Many studies claim to show that the number of refugees will increase dramatically because of climate change.

pages: 336 words: 83,903

The Refusal of Work: The Theory and Practice of Resistance to Work
by David Frayne
Published 15 Nov 2015

It accounts for the total amount of earning and spending that took place in a given year, and it is tacitly accepted that a rising level of GDP indicates an overall improvement in national prosperity. Whilst economic growth is undoubtedly crucial for less developed countries, in which subsistence needs remain unmet, a range of commentators in more affluent societies have questioned the value of GDP growth as a social goal and an index of progress. A report commissioned in 2008 by the former French president Nicolas Sarkozy argues that ‘the time is ripe for our measurement system to shift emphasis from measuring economic production to measuring people’s well-being’ (Stiglitz et al., 2010). The report stresses, among other things, the important role for human flourishing of health, education, relationships and the environment, and represents just one entry in a growing base of evidence to suggest that happiness, security and human progress will no longer flow in an unproblematic fashion from a growth in GDP (see Jackson, 2009).

The hope is that an increasing amount of free-time will allow people to forge new relations of co-operation, communication and exchange, and thereby become participants in the construction of their own futures. The call for a politics of time represents an invitation to begin dismantling the work dogma according to a humane set of ideals, and a range of academics and activists are already leading the charge. We can consider the growing group of economists who are now questioning the validity of GDP growth as a measure of social prosperity (Jackson, 2009; Lane, 2000; Sen, 1999; Stiglitz et al., 2010), or those social researchers and philosophers who are questioning the relationship between human flourishing and capitalism’s fixation on material gain (Schor, 1998; Soper, 2008). On the specific issue of working hours, we can point to a range of agencies who are pulling apart the five-day, nine-to-five norm.

pages: 289 words: 86,165

Ten Lessons for a Post-Pandemic World
by Fareed Zakaria
Published 5 Oct 2020

These relationships are the same even when we take into account the education, experience, and industry of workers. They’re even the same if we take individual workers’ IQs into account.” Globally we see the same effect: the world’s 300 biggest metropolitan areas produce half of global GDP and two-thirds of GDP growth. Cities are an ideal way to organize human beings for modern life—allowing them to mingle, work, and play, all in the same place. They help build the economic and social capital upon which healthy societies rest. They are also the most adaptive geographical units, capable of constantly responding to the pressures placed on them by broader trends or by their inhabitants.

The United States hosts a majority of the world’s largest and most technologically advanced companies. The world’s reserve currency remains the US dollar, which has only expanded its reach in recent years, now accounting for almost 90% of all currency transactions. The economist and investor Ruchir Sharma observes that if China and the US “maintained their officially reported 2019 nominal GDP growth rates—around six percent and four percent, respectively—China would not catch up to the United States until around 2050.” And of course, Washington has the world’s most powerful military by far, spending more on defense than the next ten countries combined—half of which, as US treaty allies, are on its team.

pages: 295 words: 87,204

The Capitalist Manifesto
by Johan Norberg
Published 14 Jun 2023

NOAM CHOMSKY1 At an event in Newcastle during the Brexit campaign, a professor discussed the possible effects on Britain’s gross domestic product of different outcomes. One heckler instantly shouted back: ‘That’s your bloody GDP, not ours.’ Why did I just spend the first chapter of this book on statistics and GDP growth rates? Why am I so obsessed with growth? Whose GDP is it anyway? Would a country with a few percentage points more growth be better than another? No, of course that’s not a given. But think about it this way: in the late nineteenth century, Sweden’s journey of prosperity began, thanks to free enterprise and international trade.

Kristian Niemietz, Socialism: The Failed Idea that Never Dies, Institute for Economic Affairs, 2019, p.56ff. 38. See, e.g., Johan Fourie, Our Long Walk to Economic Freedom, Tafelberg, 2021. 39. Tom G. Palmer & Matt Warner, Development with Dignity: Self-determination, Localization, and the End of Poverty, Routledge, 2022, chap. 5. 40. Luis R. Martínez, ‘How much should we trust the dictator’s GDP growth estimates?’, Journal of Political Economy, vol.130, no.10, 2022. 41. Samuel Absher, Kevin Grier, Robin Grier, ‘The economic consequences of sustainable left-populist regimes in Latin America’, Journal of Economic Behavior & Organization, vol.177, September 2020, pp.787–817. 42. Manuel Funke, Moritz Schularick & Christoph Trebesch, ‘Populist leaders and the economy’, discussion paper 15405, Center for Economic Policy Research, October 2020. 43.

pages: 82 words: 24,150

The Corona Crash: How the Pandemic Will Change Capitalism
by Grace Blakeley
Published 14 Oct 2020

An economy highly reliant on the export of copper, Zambia was hit hard by the commodities price crash in the 1970s. Unable to borrow on international financial markets, Zambia was forced to go to the IMF for financial assistance, and was placed on a structural adjustment programme. It was accorded ‘middle income country’ status in 2011 but few of the population benefited from the GDP growth of this period. Debt levels and inequality have worsened. The country remains dependent upon copper exports and unable to generate the capital necessary to industrialise.20 Zambia has been forced to deal with even less scrupulous lenders. One of the vulture funds which buy up the debt of poor countries that look likely to default, in the hope of suing them for huge sums of money, bought up $3 million worth of Zambian debt and then, in 2007, successfully sued the country for $15 million.21 When copper prices tanked as the pandemic hit global demand for commodities, the Zambian currency (the kwacha) fell with them, increasing the cost of its debt servicing.22 Without much global demand for copper, and with remittances and FDI flows having halted almost entirely, the country cannot access enough foreign currency to repay creditors.

pages: 423 words: 149,033

The fortune at the bottom of the pyramid
by C. K. Prahalad
Published 15 Jan 2005

It is how laws are implemented at the ground level through a system of microregulations that matters. In a study jointly conducted with the Confederation of Indian Industries (CII), the McKinsey consultants found that the cost of microregulations in the areas of import–export, labor laws, and transactions involving land can be as high as 2 to 3 percent of GDP growth.6 Microregulations result from bureaucratic interpretation of the laws. The proliferation of regulations can make the system opaque to anyone but the very savvy. De Soto argued that his country, Peru, enacts more than 28,000 pieces of legislation per year at the rate of more than 100 per day. No one can keep pace with that rate of change.7 Interpretation of the regulations can compromise the timely execution of contracts and the clear establishment of ownership.

Private-sector development, in the Western sense, is very unlikely here. The only FDI that is likely is focused on the extraction of mineral wealth. 2. Countries where laws and institutions of a market economy exist. The private sector is vibrant. Still, the country does not reach its potential. India is a case in point. Alternatively, the GDP growth is great, but the underlying legal systems are not fully developed. China is an example. 3. Countries with well-developed laws, regulations, institutions, and enforcement systems. The United States is an example. We can look at the spectrum of TGC as shown in Figure 5.1. TGC captures the dilemma that the BOP consumers and the private sector face.

However, both China and India The Fortune at the Bottom of the Pyramid The capacity to interpret regulations, enforce commercial contracts and social norms 82 High USA China Russia South Korea Japan, Germany India Congo Low Under-developed Well-developed The system of laws and institutions of market economy Figure 5.1 TGC. are growing rapidly. They are the only two large countries showing more than 5 percent GDP growth over a decade. Both countries have significant corruption. Estimates of nonperforming assets on the books are as high as 50 percent of GDP for China and 20 percent for India. However, they have to travel different roads to become full-fledged market economies. As commercial transactions become large, complex, and multiyear, traditional approaches to bureaucratic interpretation and enforcement in China become problematic.

pages: 497 words: 150,205

European Spring: Why Our Economies and Politics Are in a Mess - and How to Put Them Right
by Philippe Legrain
Published 22 Apr 2014

Foreign exposures to Greece, Ireland, Portugal and Spain, by bank nationality, end-Q1 2010, converted from US dollars to euros at exchange rate on 30 September 2010 of €1 = $1.3468 and Bank for International Settlements, international bank claims consolidated – ultimate risk basis, end-Q1 2013, converted at exchange rate on 31 March 2013 of €1 =€1.281 135 By insolvent, I mean that it was highly implausible that the future path of Greek GDP growth and interest rates would permit the Greek government to raise enough tax revenues to repay its debts in full. 136 In February 2010, EU leaders stated that “Euro area Member states will take determined and coordinated action, if needed, to safeguard financial stability in the euro area as a whole.

But the face value of the bonds remains untouched, so the German government can claim that taxpayers are getting all their money back. 331 International Monetary Fund, Greece 2013 Article IV Consultation, IMF Country Report No. 13/154, page 7 http://www.imf.org/external/pubs/ft/scr/2013/cr13154.pdf 332 http://www.ft.com/cms/s/0/70b9d150-f9e4-11e2-b8ef-00144feabdc0.html 333 International Monetary Fund, Greece 2013 Article IV Consultation, IMF Country Report No. 13/154 http://www.imf.org/external/pubs/ft/scr/2013/cr13154.pdf 334 http://www.investing.com/rates-bonds/ireland-10-year-bond-yield-advanced-chart 335 http://www.bloomberg.com/quote/GSPT10YR:IND/chart 336 http://www.bloomberg.com/quote/GBTPGR10:IND/chart http://www.bloomberg.com/quote/GSPG10YR:IND/chart 337 The IMF’s assessment that Portugal’s debts are sustainable is predicated on optimistic assumptions about future growth and interest rates. If nominal GDP growth disappoints, or interest rates spike again, debts will continue rising. As of the first quarter of 2013, more than half of Portugal’s debt was owed to the private sector, nearly half of that to foreigners. Writing that down by three-quarters would lop some 45 per cent of GDP off Portugal’s public debt, to sustainable levels.

The government projected growth of 1.2 per cent in 2010, 2.3 per cent in 2011, 2.8 per cent in 2012, 2.9 per cent in 2013 and 2.7 per cent thereafter 397 Corporation tax was also cut, deregulation promised and minor measures to boost smaller companies access to finance announced. 398 George Osborne, Autumn Statement, 29 November 2010 http://www.publications.parliament.uk/pa/cm201011/cmhansrd/cm101129/debtext/1011290001.htm#1011298000002 399 Eurostat, real GDP growth rate volume, percentage change on previous year, Code: tec00115. The UK economy grew by 1.7 per cent in 2010, 1.1 per cent in 2011 and 0.2 per cent in 2012. 400 Personal calculations from Eurostat, GDP and main components – volumes, comparison of Q2 2010 and Q2 2013. Code: namq_gdp_k 401 HM Treasury, Budget 2013, Table 1.5 402 Net debt would rise to 85.6 per cent in 2016-17, instead of peaking at 70.3 per cent in 2013-14. 403 HM Treasury, Budget 2013, Table 1.2.

pages: 554 words: 158,687

Profiting Without Producing: How Finance Exploits Us All
by Costas Lapavitsas
Published 14 Aug 2013

The first is the decline in the rate of growth of GDP in mature countries, which has also been strongly cyclical. Capitalist accumulation has generally lacked dynamism and resulted in repeated crises during the period of financialization. The second is the weakness of productivity growth signifying persistent difficulties in opening fresh fields of capitalist investment that could have led to sustained GDP growth and rising incomes. The third is the retreat of labour in the face of capital, partly due to technological and regulatory change, and partly due to the pressure of higher unemployment. The retreat of labour has meant that the balance of income distribution has shifted in favour of capital in the course of financialization.

It would have been deeply misleading to include China in the empirical analysis of the trends of financialization during the last four decades. The importance of China to financialization is mostly associated with the role of the dollar as world money and the accumulation of reserves of world money by the Chinese state, discussed in Chapter 8. FIG. 2 Real GDP annual growth rates, 1971–2007; US, Japan, Germany, UK Lower GDP growth, repeated crises, higher unemployment, changing labour force Initial evidence on the path of accumulation during the period of financialization is given by annual growth rates of real GDP, shown in figure 2. The growth patterns of the four economies have been broadly synchronic, probably reflecting close links of trade and capital flows.

New methods of mass production, new raw materials and generalized electrification were instrumental to productivity gains in the course of the long boom after the Second World War. In contrast, the new technologies and changes in labour organization in the years of financialization have not resulted in sustained productivity growth in mature countries. The weakness of productivity growth underscores the relatively poor results of GDP growth during the period, shown in figure 2. Looking more closely at figure 6, from the middle of the 1970s to the middle of the 1990s, productivity growth was broadly flat or declining, including in the US, the leading country in introducing the new technologies of the era.14 Robert Solow observed that ‘You can see the computer age everywhere but in the productivity statistics’, and his quip became the ‘Solow Paradox’ characteristic of the new era.15 After 1995, however, significant technological improvements in the microprocessor industry and faster productivity growth in general seemed to materialize for the US economy.

pages: 823 words: 220,581

Debunking Economics - Revised, Expanded and Integrated Edition: The Naked Emperor Dethroned?
by Steve Keen
Published 21 Sep 2011

A catalogue record for this book is available from the British Library Library of Congress Cataloging in Publication Data available eISBN 9781780322209 CONTENTS Tables, figures and boxes Preface to the second edition Preface to the first edition 1 Predicting the ‘unpredictable’ 2 No more Mr Nice Guy Part 1 Foundations: the logical flaws in the key concepts of conventional economics 3 The calculus of hedonism 4 Size does matter 5 The price of everything and the value of nothing 6 To each according to his contribution Part 2 Complexities: issues omitted from standard courses that should be part of an education in economics 7 The holy war over capital 8 There is madness in their method 9 Let’s do the Time Warp again 10 Why they didn’t see it coming 11 The price is not right 12 Misunderstanding the Great Depression and the Great Recession Part 3 Alternatives: different ways to think about economics 13 Why I did see ‘It’ coming 14 A monetary model of capitalism 15 Why stock markets crash 16 Don’t shoot me, I’m only the piano 17 Nothing to lose but their minds 18 There are alternatives Bibliography Index TABLES, FIGURES AND BOXES Tables 2.1 Anticipations of the housing crisis and recession 3.1 ‘Utils’ and change in utils from consuming bananas 3.2 Utils arising from the consumption of two commodities 3.3 The commodities in Sippel’s ‘Revealed Preference’ experiment 4.1 Demand schedule for a hypothetical monopoly 4.2 Costs for a hypothetical monopoly 4.3 Sales and costs determine the level of output that maximizes profit 4.4 Cost and revenue for a ‘perfectly competitive’ industry identical in scale to hypothetical monopoly 5.1 Input and output data for a hypothetical firm 5.2 Cost drawings for the survey by Eiteman and Guthrie 5.3 Empirical research on the nature of cost curves 7.1 Sraffa’s hypothetical subsistence economy 7.2 Production with a surplus 7.3 Relationship between maximum and actual rate of profit and the wage share of surplus 7.4 The impact of the rate of profit on the measurement of capital 10.1 Anderson’s ranking of sciences 12.1 The alleged Money Multiplier process 13.1 A hypothetical example of the impact of decelerating debt on aggregate demand 13.2 The actual impact of decelerating debt on aggregate demand 14.1 A pure credit economy with paper money 14.2 The dynamics of a pure credit economy with no growth 14.3 Net incomes 14.4 A growing pure credit economy with electronic money 15.1 Von Neumann’s procedure for working out a numerical value for utility 15.2 The Allais ‘Paradox’ 15.3 The Allais ‘Paradox’ Part 2 16.1 The solvability of mathematical models 17.1 Marx’s unadjusted value creation table, with the rate of profit dependent upon the variable-to-constant ratio in each sector 17.2 Marx’s profit distribution table, with the rate of profit now uniform across sectors 17.3 Steedman’s hypothetical economy 17.4 Steedman’s physical table in Marx’s value terms 17.5 Steedman’s prices table in Marx’s terms 17.6 Profit rate and prices calculated directly from output/wage data 17.7 Marx’s example where the use-value of machinery exceeds its depreciation Figures 2.1 US inflation and unemployment from 1955 2.2 Bernanke doubles base money in five months 2.3 Private debt peaked at 1.7 times the 1930 level in 2009 3.1 Rising total utils and falling marginal utils from consuming one commodity 3.2 Total utils from the consumption of two commodities; 3.3 Total ‘utils’ represented as a ‘utility hill’ 3.4 The contours of the ‘utility hill’ 3.5 Indifference curves: the contours of the ‘utility hill’ shown in two dimensions 3.6 A rational consumer’s indifference map 3.7 Indifference curves, the budget constraint, and consumption 3.8 Deriving the demand curve 3.9 Upward-sloping demand curve 3.10 Separating out the substitution effect from the income effect 3.11 Engel curves show how spending patterns change with increases in income 3.12 A valid market demand curve 3.13 Straight-line Engel ‘curves’ 3.14 Economic theory cannot rule out the possibility that a market demand curve may have a shape like this, rather than a smooth, downward-sloping curve 4.1 Leijonhufvud’s ‘Totems’ of the Econ tribe 4.2 Stigler’s proof that the horizontal firm demand curve is a fallacy 4.3 Profit maximization for a monopolist: marginal cost equals marginal revenue, while price exceeds marginal cost 4.4 Profit maximization for a perfectly competitive firm: marginal cost equals marginal revenue, which also equals price 4.5 A supply curve can be derived for a competitive firm, but not for a monopoly 4.6 A competitive industry produces a higher output at a lower cost than a monopoly 4.7 The standard ‘supply and demand’ explanation for price determination is valid only in perfect competition 4.8 Double the size, double the costs, but four times the output 4.9 Predictions of the models and results at the market level 4.10 Output behavior of three randomly selected firms 4.11 Profit outcomes for three randomly selected firms 4.12 Output levels for between 1- and 100-firm industries 5.1 Product per additional worker falls as the number of workers hired rises 5.2 Swap the axes to graph labor input against quantity 5.3 Multiply labor input by the wage to convert Y-axis into monetary terms, and add the sales revenue 5.4 Maximum profit occurs where the gap between total cost and total revenue is at a maximum 5.5 Deriving marginal cost from total cost 5.6 The whole caboodle: average and marginal costs, and marginal revenue 5.7 The upward-sloping supply curve is derived by aggregating the marginal cost curves of numerous competitive firms 5.8 Economic theory doesn’t work if Sraffa is right 5.9 Multiple demand curves with a broad definition of an industry 5.10 A farmer who behaved as economists advise would forgo the output shown in the gap between the two curves 5.11 Capacity utilization over time in the USA 5.12 Capacity utilization and employment move together 5.13 Costs determine price and demand determines quantity 5.14 A graphical representation of Sraffa’s (1926) preferred model of the normal firm 5.15 The economic theory of income distribution argues that the wage equals the marginal product of labor 5.16 Economics has no explanation of wage determination or anything else with constant returns 5.17 Varian’s drawing of cost curves in his ‘advanced’ microeconomics textbook 6.1 The demand for labor curve is the marginal revenue product of labor 6.2 The individual’s income–leisure trade-off determines how many hours of labor he supplies 6.3 An upward-sloping individual labor supply curve 6.4 Supply and demand determine the equilibrium wage in the labor market 6.5 Minimum wage laws cause unemployment 6.6 Demand management policies can’t shift the supply of or demand for labor 6.7 Indifference curves that result in less work as the wage rises 6.8 Labor supply falls as the wage rises 6.9 An individual labor supply curve derived from extreme and midrange wage levels 6.10 An unstable labor market stabilized by minimum wage legislation 6.11 Interdependence of labor supply and demand via the income distributional effects of wage changes 7.1 The standard economic ‘circular flow’ diagram 7.2 The rate of profit equals the marginal product of capital 7.3 Supply and demand determine the rate of profit 7.4 The wage/profit frontier measured using the standard commodity 9.1 Standard neoclassical comparative statics 9.2 The time path of one variable in the Lorenz model 9.3 Structure behind the chaos 9.4 Sensitive dependence on initial conditions 9.5 Unstable equilibria 9.6 Cycles in employment and income shares 9.7 A closed loop in employment and wages share of output 9.8 Phillips’s functional flow block diagram model of the economy 9.9 The component of Phillips’s Figure 12 including the role of expectations in price setting 9.10 Phillips’s hand drawing of the output–price-change relationship 9.11 A modern flow-chart simulation program generating cycles, not equilibrium 9.12 Phillips’s empirically derived unemployment–money-wage-change relation 10.1 Hicks’s model of Keynes 10.2 Derivation of the downward-sloping IS curve 10.3 Derivation of the upward-sloping LM curve 10.4 ‘Reconciling’ Keynes with ‘the Classics’ 10.5 Unemployment–inflation data in the USA, 1960–70 10.6 Unemployment–inflation data in the USA, 1950–72 10.7 Unemployment–inflation data in the USA, 1960–80 10.8 The hog cycle 11.1 Supply and demand in the market for money 11.2 The capital market line 11.3 Investor preferences and the investment opportunity cloud 11.4 Multiple investors (with identical expectations) 11.5 Flattening the IOC 11.6 How the EMH imagines that investors behave 11.7 How speculators actually behave 12.1 Inflation and base money in the 1920s 12.2 Inflation and base money in the post-war period 12.3 Bernanke’s massive injection of base money in QE1 12.4 Change in M0 and unemployment, 1920–40 12.5 Change in M1 and unemployment, 1920–40 12.6 Change in M0 and M1, 1920–40 12.7 M0–M1 correlation during the Roaring Twenties 12.8 M0–M1 correlation during the Great Depression 12.9 Bernanke’s ‘quantitative easing’ in historical perspective 12.10 The volume of base money in Bernanke’s ‘quantitative easing’ in historical perspective 12.11 Change in M1 and inflation before and during the Great Recession 12.12 The money supply goes haywire 12.13 Lindsey, Orphanides, Rasche 2005, p. 213 12.14 The empirical ‘Money Multiplier’, 1920–40 12.15 The empirical ‘Money Multiplier’, 1960–2012 12.16 The disconnect between private and fiat money during the Great Recession 13.1 Goodwin’s growth cycle model 13.2 My 1995 Minsky model 13.3 The vortex of debt in my 1995 Minsky model 13.4 Cyclical stability with a counter-cyclical government sector 13.5 Australia’s private debt-to-GDP ratio, 1975–2005 13.6 US private debt to GDP, 1955–2005 13.7 Aggregate demand in the USA, 1965–2015 13.8 US private debt 13.9 The change in debt collapses as the Great Recession begins 13.10 The Dow Jones nosedives 13.11 The correlation of debt-financed demand and unemployment 13.12 The housing bubble bursts 13.13 The Credit Impulse and change in employment 13.14 Correlation of Credit Impulse and change in employment and GDP 13.15 Relatively constant growth in debt 13.16 The biggest collapse in the Credit Impulse ever recorded 13.17 Growing level of debt-financed demand as debt grew faster than GDP 13.18 The two great debt bubbles 13.19 Change in nominal GDP growth then and now 13.20 Real GDP growth then and now 13.21 Inflation then and now 13.22 Unemployment then and now 13.23 Nominal private debt then and now 13.24 Real debt then and now 13.25 Debt to GDP then and now 13.26 Real debt growth then and now 13.27 The collapse of debt-financed demand then and now 13.28 Debt by sector – business debt then, household debt now 13.29 The Credit Impulse then and now 13.30 Debt-financed demand and unemployment, 1920–40 13.31 Debt-financed demand and unemployment, 1990–2011 13.32 Credit Impulse and change in unemployment, 1920–40 13.33 Credit Impulse and change in unemployment, 1990–2010 13.34 The Credit Impulse leads change in unemployment 14.1 The neoclassical model of exchange as barter 14.2 The nature of exchange in the real world 14.3 A nineteenth-century private banknote 14.4 Bank accounts 14.5 A credit crunch causes a fall in deposits and a rise in reserves in the bank’s vault 14.6 A bank bailout’s impact on loans 14.7 A bank bailout’s impact on incomes 14.8 A bank bailout’s impact on bank income 14.9 Bank income grows if debt grows more rapidly 14.10 Unemployment is better with a debtor bailout 14.11 Loans grow more with a debtor bailout 14.12 Profits do better with a debtor bailout 14.13 Bank income does better with a bank bailout 14.14 Modeling the Great Moderation and the Great Recession – inflation, unemployment and debt 14.15 The Great Moderation and the Great Recession – actual inflation, unemployment and debt 14.16 Modeling the Great Moderation and the Great Recession – output 14.17 Income distribution – workers pay for the debt 14.18 Actual income distribution matches the model 14.19 Debt and GDP in the model 14.20 Debt and GDP during the Great Depression 15.1 Lemming population as a constant subject to exogenous shocks 15.2 Lemming population as a variable with unstable dynamics 17.1 A graphical representation of Marx’s dialectics Boxes 10.1 The Taylor Rule 13.1 Definitions of unemployment PREFACE TO THE SECOND EDITION Debunking Economics was far from the first book to argue that neoclassical economics was fundamentally unsound.

The average increase in nominal GDP over 1921–29 was 4.5 percent, but it fluctuated wildly from –2 to +13 percent, with a standard deviation of 4.4 percent. In contrast, the Noughty Nineties recorded a higher rate of nominal growth of 5.3 percent, and this was very stable, ranging between 2.6 and 6.6 percent with a standard deviation of only 1.4 percent. 13.19 Change in nominal GDP growth then and now However, as well as being a decade of stock market speculation, the 1920s also saw serious Schumpeterian investment and ‘creative destruction.’ It was the decade of the Charleston and The Great Gatsby, but it was the decade of the production line, technological innovation in manufacturing and transportation, and the continuing transformation of American employment from agriculture to industry.

It was the decade of the Charleston and The Great Gatsby, but it was the decade of the production line, technological innovation in manufacturing and transportation, and the continuing transformation of American employment from agriculture to industry. The average rate of real economic growth was therefore higher in the 1920s than in the period from 1999 to 2009 – though disentangling this from the gyrations in the price level is extremely difficult. 13.20 Real GDP growth then and now For example, the nominal rate of growth in 1922/23 was 13 percent, but the ‘real’ rate was an even higher 20 percent. This impossible level reflected the simultaneous recovery from deflation of over 10 percent to inflation of 3 percent, and unemployment falling – and hence output rising – from 12 percent to 2.5 percent as the economy recovered from the depression of January 1920 to June 1921. 13.21 Inflation then and now Overall, the rate of unemployment is the best means to compare the two periods, but here we run into the distortions caused by politically motivated redefinitions of the unemployment rate since the late 1970s (see Box 13.1).

pages: 310 words: 90,817

Paper Money Collapse: The Folly of Elastic Money and the Coming Monetary Breakdown
by Detlev S. Schlichter
Published 21 Sep 2011

It is evident that in this scenario the economy undergoes a period of adjustment, in which additional economic transactions are being undertaken. If the money producer again sets out to achieve the standard macroeconomic responses that are today associated with an expanding money supply, namely higher GDP growth and higher inflation, he will be happier than after the attempt in scenario one. By allocating money evenly but by simply decreasing transparency, the money producer has caused some economic agents to misinterpret the situation. Their errors generated additional activity and these additional transactions will have temporarily lifted GDP.

If the market economy is, rightly understood, a tool that can be used for the purpose of those who participate in it, it is clear that it fulfills its purpose as long as it provides a functioning framework for voluntary cooperation in pursuit of individual plans and ambitions. This is its only purpose. The market economy is not a superior organism that has its own goals. There is no overriding or unifying purpose. It is not the purpose of the market economy to generate positive GDP growth. It is just a tool, a framework, albeit the most important framework mankind has ever discovered, that allows everyone to better realize their own plans, and it is their own plans that matter. It is true that most people prefer more goods and services to fewer goods and services, and this is precisely the reason they use the tool “market economy” to cooperate with others.

pages: 257 words: 94,168

Oil Panic and the Global Crisis: Predictions and Myths
by Steven M. Gorelick
Published 9 Dec 2009

The curve of GDP losses resembles the curve for the first measure of economic impact – the history of oil import costs relative to GDP. The peak percent GDP loss occurred in 1982, near the end of the US recession. In 2007, the US lost an estimated 1.7 percent of its GDP as a consequence of importing oil. This loss reduced 2007 GDP growth by more than half. However, the effect of oil imports on GDP was more pronounced in 1982 because GDP growth during that recession was negative (minus 2 percent), and the estimated reduction in GDP was higher at 3 percent. So 2007 and 1982 were quite different. But the world economy has changed dramatically since 2007, and we might benefit by looking back once more to 1982.

pages: 340 words: 96,149

@War: The Rise of the Military-Internet Complex
by Shane Harris
Published 14 Sep 2014

The country has a pressing need to learn more about where US companies have found sources of energy, and how they plan to extract it. In part, that’s to support China’s ambitions in the energy sphere. But the country also needs to fuel a rapidly expanding economy, which, though it has slowed in recent years, still saw GDP growth of 7.8 percent from 2009 to 2013. China is seeking to replace its traditional sources of fossil fuels. The country depends mostly on coal for its energy, and the toxic air quality in many Chinese cities shows it. China is the world’s second-largest consumer of coal and accounts for nearly half of all coal consumption.

. [>] A few months after the intrusions: Brian Krebs, “Chinese Hackers Blamed for Intrusion at Energy industry Giant Telvent,” KrebsonSecurity, September 26, 2012, http://krebsonsecurity.com/2012/09/chinese-hackers-blamed-for-intrusion-at-energy-industry-giant-telvent/. [>] But the country also needs: World Bank, “GDP Growth,” http://data.worldbank.org/indicator/NY.GDP.MKTP.KD.ZG [>] China is the world’s second-largest: US Energy Information Administration, http://www.eia.gov/countries/country-data.cfm?fips=CH. [>] At least one US energy company: Michael Riley and Dune Lawrence, “Hackers Linked to China’s Army Seen from E.U. to D.C.,” Bloomberg.com, July 26, 2012, http://www.bloomberg.com/news/2012-07-26/china-hackers-hit-eu-point-man-and-d-c-with-byzantine-candor.html. [>] And the country has pursued legitimate paths: Ryan Dezember and James T.

pages: 332 words: 93,672

Life After Google: The Fall of Big Data and the Rise of the Blockchain Economy
by George Gilder
Published 16 Jul 2018

The New York Times blames most of the ailments of our economy—slow GDP growth, low productivity, even declining childbirth—on the diversion of resources into cryptocurrencies.3 But crypto-innovation addresses the entrepreneurial doldrums signified by declining business starts and IPOs and the immense diversion of resources represented by the $5.1 trillion a day of otiose currency trading. It addresses the security crisis with a new Internet architecture. By disintermediating transactions, cryptocurrencies also offer a remedy for the hypertrophy of finance—up near 40 percent of business profits—that has also coincided with the decline of GDP growth.4 Companies are abandoning hierarchy and pursuing heterarchy because, as the Tapscotts put it, “blockchain technology offers a credible and effective means not only of cutting out intermediaries, but also of radically lowering transaction costs, turning firms into networks, distributing economic power, and enabling both wealth creation and a more prosperous future.”5 Bitcoin aimed to burst the overstuffed $5.1 trillion daily piñata of modern currencies and unleash a crypto-copia.

pages: 91 words: 26,009

Capitalism: A Ghost Story
by Arundhati Roy
Published 5 May 2014

In India the land of millions of people is being acquired and handed over to private corporations for “public interest”—for Special Economic Zones (SEZs), infrastructure projects, dams, highways, car manufacture, chemical hubs, and Formula One racing.10 (The sanctity of private property never applies to the poor.) As always, local people are promised that their displacement from their land and the expropriation of everything they ever had is actually part of employment generation. But by now we know that the connection between GDP growth and jobs is a myth. After twenty years of “growth,” 60 percent of India’s workforce is self-employed, and 90 percent of India’s labor force works in the unorganized sector.11 Post-Independence, right up to the 1980s, people’s movements, ranging from the Naxalites to Jayaprakash Narayan’s Sampoorna Kranti, were fighting for land reforms, for the redistribution of land from feudal landlords to landless peasants.

pages: 289 words: 99,936

Digital Dead End: Fighting for Social Justice in the Information Age
by Virginia Eubanks
Published 1 Feb 2011

At the end of the day, you do things that you love, but you do them in such a way that they can also have a positive impact on other people. Based on a phone conversation that took place June 1, 2009. he wrote, the economy shrank by half a million jobs in the first four months of 2003, and most wages stagnated or declined. These contradictory indicators—modest but enduring GDP growth and continuing declines in employment—are not entirely remarkable, and are often written off by economists as statistical noise. But in the new sink-or-swim economy, Collingwood argued, these opposing trends were becoming permanent. “They call it ‘idiosyncratic volatility,’” he wrote, “and it is the signature of our economic age” (Collingwood 2003, 44).

B., 148 Dunlea, Mark, 125 Constantine, Jes, 39, 45, 130–131, 133 Consumerism, 36 Cousins, Roberta, 39, 45 Critical ambivalence, 10–11, 99 Critical literacy, 96 Critical technological citizenship, xx, 30, 99, 104, 114, 126–127, 129, 154 Critical technological education, 125–126 Cultural education, 114 Culture of poverty, 36 Cyborg, 27, 29 Earnings inequality, 58–62, 70 EBT cards, 90–91 Education critical technological, 125–126 cultural, 114 inequality, 67–68 popular, 105, 125, 171 and race/gender, 57–58 Eglash, Ron, 100 Electronics recycling, 169 Employment, 55, 58–61 high-tech, 72–73 job creation, 64–66 low-wage, 73, 162 service and caregiving, 65, 77 Engaged objectivity, 146–147 Environmental justice, 169 Epistemic liberation, 148 Epistemology, 132, 148 Equity, 23–24 and citizenship, 30 and digital divide programs, 36–37 and distributive paradigm, 24–27, 48, 147 and information economy, 53, 56, 77–78, 154, 157–170 and IT, 152 and oppression, 45, 48 and policy, 126, 163 and social location, 57 Ethnography, 178 Ever-Shifting Internet Population, The, 37 Danish Board of Technologies (DBT), 164 DataCenter, 165 Data entry employment, 72–73 Deliverables, 113, 118 Democracy, 105, 129, 132, 151, 163 Department of Social Services (DSS), 92 Digital divide critiques of, 39 origin of, 35 people-centered solutions, 45 policy, 36–37, 39 and social privilege, 42 and women, 37–42, 48 Dinkelaker, Pat, 13, 100–101, 109, 113–114 Distributional ethic, 25 Distributive paradigm, 37, 42 and equity, 24–27, 48, 147 and high-tech development, 78 and social justice, 36, 45, 81 Domestic Workers United (DWU), 158 Double consciousness, 148 Fair distribution, 26 Falling Through the Net I & II, 35 Feminist analyses, 27–28, 107 Flexible labor markets, 61, 71 Flux, 56 Flyvbjerg, Bent, 146 Index Folbre, Nancy, 160 Franklin, Ursula, 31 Fraud, 90 Freire, Paulo, 96, 101, 105 Friedman, Thomas L., 56, 78 Fudjack, John, 114 Garnet, Henry Highland, 50 GDP growth, 53–55 Gender and education, 58 and poverty status, 63 General Electric, 159 Gentrification, 166–168 Gibson, Cuemi, 87–90, 93–94, 115, 133, 136, 157 Glaser, Barney G., 178 Globalization, 169 Gordon, Tamar, 145 Governance. See Political learning Grant writer, 112–113 Greenbaum, Joan, 107 Guzman, Ruth Delgado, 5–8, 37–39 Haraway, Donna, 31, 147 Harding, Sandra, 146, 148 Harvey, David, 168 Hazardous waste, 169 Head Start, 97 Health effects, 73–74 Highlander Folk School tradition, 105 Highlander Research and Education Center, 32, 101, 171 High-tech economy.

The Despot's Accomplice: How the West Is Aiding and Abetting the Decline of Democracy
by Brian Klaas
Published 15 Mar 2017

‘The Effects of US Foreign Assistance on Democracy Building, 1990– 2003’, World Politics, 59(3), 404–39. 24.╇Gyimah-Boadi, Emmanuel (2010). ‘Assessing Democracy Assistance: Ghana’, Ghana Center for Democratic Development and FRIDE, May 2010, http://fride.org/download/IP_WMD_Ghana_ENG_jul10.pdf, last accessed 12 February 2016. 25.╇World Bank, ‘GDP Growth (Annual %)’, World Development IndicaÂ� tors, http://data.worldbank.org/indicator/NY.GDP.MKTP.KD.ZG, last accessed 21 February 2016. 26.╇This strategy can backfire, however. More on this in Chapter 13. 27.╇Carothers (2015). € € € € € € € € € 10.╇THE CARROT 1.╇ C ity Paper (2015).

‘China-Thailand Rail Project Gets Untracked’, The Diplomat, 1 April 2016, http://thediplomat.com/2016/04/chinathailand-railway-project-gets-untracked/, last accessed 2 April 2016. 29.╇Tull, Dennis (2006). ‘China’s Engagement in Africa: Scope, Significance and Consequences’, The Journal of Modern African Studies, 44(3), 459– 79. 30.╇World Bank (n.d.). ‘GDP Growth (Annual %)’, World Development Indicators, http://data.worldbank.org/indicator/NY.GDP.MKTP.KD. ZG?page=1, last accessed 2 April 2016. 31.╇Kurlantzick, Joshua (2013). ‘Why the “China Model” Isn’t Going Away’, The Atlantic, 21 March 2013, http://www.theatlantic.com/ € € € € € € € € € € € € € € € € 254 notes pp. [207–211] china/archive/2013/03/why-the-china-model-isnt-going-away/274 237/, last accessed 19 March 2016. 32.╇Zavadski, Katie (2015).

The New Harvest: Agricultural Innovation in Africa
by Calestous Juma
Published 27 May 2017

The mobile penetration rate (number of subscriptions per 100 inhabitants) in Africa is expected to reach 69% by the end of 2014.21 Much of this growth in cell phone use—as much as 45% annually from 2002 through 2011—coincided with economic growth in the region. It is estimated that every 10% growth in mobile phones can raise up to 1.5% in GDP growth. There are five ways in which mobile phone access boosts microeconomic performance: reducing search costs and therefore improving overall market efficiency, improving productive efficiency of firms, creating new jobs in telecommunications-based industries, increasing social networking capacity, and allowing for mobile development projects to enter the market.22 Advances in Science, Technology, and Engineering 49 Mobile phones cut out the opportunity costs, replacing several hours of travel with a two-minute phone call and also allowing firms and producers to get up-to-date information on demand.

She also stressed the important of applying technology and modern techniques to boost growth in the sector.6 The overarching objective of the Year of Agriculture is to “consolidate active commitments toward new priorities, strategies and targets for achieving results and impacts, with special focus on sustained, all Africa agriculture-led growth, propelled by stronger, private sector investment and public-private partnerships.”7 The African Union has committed to reduce poverty by half, with agricultural growth and transformation as the catalyst, and has promised to put in place the policy, institutional, and monetary support to make this happen. The African Union singled out several benchmarks by which to measure progress: first, agricultural GDP growth would reach at least 6% annually; second, it promised to strengthen public-private partnerships for key commodity value chains with links to smallholder farmers; third, it will focus on creating employment opportunities for 30% of the youth in these value chains; and fourth, it will focus particularly on involving women and youth in agribusiness opportunities.8 As has been discussed throughout this book, Africa possesses a latecomer advantage in adopting existing technology.

pages: 357 words: 99,684

Why It's Still Kicking Off Everywhere: The New Global Revolutions
by Paul Mason
Published 30 Sep 2013

In North Africa there is a demographic bulge of young people, including graduates and students, who are unable to get a decent job—or indeed any job. By 2011 there was 20 per cent youth unemployment across the region, where two-thirds of the population is under the age of thirty. In Libya, despite high GDP growth, youth unemployment stood at 30 per cent. But youth unemployment is not a factor confined to North Africa. In Spain, in 2011 youth unemployment was running at 46 per cent, a figure partially ameliorated by the tendency for young Spaniards to live off their extended families. In Britain, on the eve of the student riots of 2010, youth unemployment stood at 20 per cent.

Benefits and tax credits, together with neighbourhood policing and CCTV systems, made life tolerable in towns where there would never be high-paid work again. For those who had bought their homes, including council-estate dwelling workers, the Blair years would see ‘equity withdrawal’—borrowing against rising house prices—equivalent to a stunning 103 per cent of GDP growth.11 Crime fell, and the feel-good factor increased with credit-fuelled spending power, especially for the poor; analysts noted that the main drivers of equity withdrawal were people ‘with low credit scores and high credit card utilisation rates, who are most likely to have been credit-constrained in the past’12.

pages: 349 words: 98,868

Nervous States: Democracy and the Decline of Reason
by William Davies
Published 26 Feb 2019

The first part examines how the seventeenth-century ideal of expertise came about, and why it has been losing credibility, especially since the 1990s. In particular, mounting inequality in the West means that, in certain ways, the facts produced by experts and technocrats simply do not capture lived reality for many people. Objective indicators of progress, such as GDP growth, conceal deep fractures within society. Crucially, these divisions are not merely economic, but have acquired a bodily and existential dimension: people’s lives are being shaped by divergent health, life expectancy and encounters with physical and psychological pain. Pessimism emanates most strongly from bodies that are aging faster and suffering more.

But qualitative, anecdotal, or cultural evidence (for instance, stories of individual migrants settling down in Britain) provoked the opposite, much warmer reaction. When Nigel Farage, sometime leader of Britain’s anti-immigration UK Independence Party, said in 2014 that he thought there were more important things in politics than GDP growth, he was treated as deluded. Within a couple of years, this was accepted across the political spectrum. In any case, statistical predictions have not always fared well in the early twenty-first century. Just as the certainty of predictions becomes exaggerated by politicians and the media, so their subsequent inaccuracies become amplified and replayed to create a sense of scandal.

pages: 463 words: 105,197

Radical Markets: Uprooting Capitalism and Democracy for a Just Society
by Eric Posner and E. Weyl
Published 14 May 2018

Jordan, The Competitive Allocation Process Is Informationally Efficient Uniquely, 28 Journal of Economic Theory 1 (1982); Noam Nisan & Ilya Segal, The Communication Requirements of Efficient Allocations and Supporting Prices, 129 Journal of Economic Theory 192 (2006). 8. Lange, The Computer and the Market, at 157. 9. The Soviet Union: GDP Growth, Nintil (March 26, 2016), https://nintil.com/2016/03/26/the-soviet-union-gdp-growth/. 10. See, for example, Modiface’s eye-tracking–based advertising analytic system described at http://www.mobilemarketer.com/news/modiface-eye-tracking-app-increases-smashbox-conversions-by-27/447825/. INDEX Italic page numbers indicate figures and tables abortion, 27, 112–13, 116 Acemoglu, Daron, 240, 316n4 activism, 3, 124, 140, 176–77, 188, 193, 211, 232 Adachi, Kentaro, 80–81, 105–8 Africa, 136, 138 African Americans, 24, 89, 209–10 Airbnb, 70, 117 airlines, 171, 183, 189–91, 194 Akerlof, George, 66–67 algorithms, 208, 214, 219, 221, 281–82, 289–93, 307n7 Allen, Robert C., 240 Amazon, 112, 230–31, 234, 239, 248, 288, 290–91 American Constitution, 86–87 American Federation of Musicians, 210 American Tobacco Company, 174 America OnLine (AOL), 210 Anderson, Chris, 212 antitrust: Clayton Act and, 176–77, 197, 311n25; landlords and, 201–2; monopolies and, 23, 48, 174–77, 180, 184–86, 191, 197–203, 242, 255, 262, 286; resale price maintenance and, 200–201; social media and, 202 Apple, 117, 239, 289 Arginoussai Islands, 83 aristocracy, 16–17, 22–23, 36–38, 84–85, 87, 90, 135–36 Aristotle, 172 Arrow, Kenneth, 92, 303n17 Articles of Confederation, 88 artificial intelligence (AI), 202, 257, 287; Alexa and, 248; algorithms and, 208, 214, 219, 221, 281–82, 289–93; automated video editing and, 208; Cortana and, 219; data capacities and, 236; Deep Blue and, 213; democratization of, 219; diminishing returns and, 229–30; facial recognition and, 208, 216–19; factories for thinking machines and, 213–20; Google Assistant and, 219; human-produced data for, 208–9; marginal value and, 224–28, 247; Microsoft and, 219; neural networks and, 214–19; payment systems for, 224–30; recommendation systems and, 289–90; siren servers and, 220–24, 230–41, 243; Siri and, 219, 248; technofeudalism and, 230–33; techno-optimists and, 254–55, 316n2; techno-pessimists and, 254–55, 316n2; worker replacement and, 223 Athens, 55, 83–84, 131 Atwood, Margaret, 18–19 auctions, xv–xxi, 49–51, 70–71, 97, 99, 147–49, 156–57, 300n34 au pair program, 154–55, 161 Australia, 10, 12, 13, 159, 162 Austrian school, 2 Autor, David, 240 Azar, José, 185, 189, 310n24 Bahrain, 158 banking industry, 182–84, 183, 190 Bank of America, 183, 184 Becker, Gary, 147 Beckford, William, 95 behavioral finance, 180–81 Bénabou, Roland, 236–37 Bentham, Jeremy, 4, 35, 95–96, 98, 132 Berle, Adolf, 177–78, 183, 193–94 Berlin Wall, 1, 140 Berners-Lee, Tim, 210 big data, 213, 226, 293 Bing, xxi BlackRock, 171, 181–84, 183, 187, 191 Brazil, xiii–xvii, 105, 135 Brin, Sergey, 211 broadcast spectrum, xxi, 50–51, 71 Bush, George W., 78 Cabral, Luís, 202 Cadappster app, 31 Caesar, Julius, 84 Canada, 10, 13, 159, 182 capitalism, xvi; basic structure of, 24–25; competition and, 17 (see also competition); corporate planning and, 39–40; cultural consequences of, 270, 273; Engels on, 239–40; freedom and, 34–39; George on, 36–37; growth and, 3 (see also growth, economic); industrial revolution, 36, 255; inequality and, 3 (see also inequality); labor and, 136–37, 143, 159, 165, 211, 224, 231, 239–40, 316n4; laissez-faire, 45; liberalism and, 3, 17, 22–27; markets and, 278, 288, 304n36; Marx on, 239–40; monopolies and, 22–23, 34–39, 44, 46–49, 132, 136, 173, 177, 179, 199, 258, 262; monopsony and, 190, 199–201, 223, 234, 238–41, 255; ownership and, 34–36, 39, 45–49, 75, 78–79; property and, 34–36, 39, 45–49, 75, 78–79; Radical Markets and, 169, 180–85, 203, 273; regulations and, 262; Schumpeter on, 47; shareholders and, 118, 170, 178–84, 189, 193–95; technology and, 34, 203, 316n4; wealth and, 45, 75, 78–79, 136, 143, 239, 273 Capitalism and Freedom (Friedman), xiii Capitalism for the People, A (Luigi), 203 Capra, Frank, 17 Carroll, Lewis, 176 central planning: computers and, 277–85, 288–93; consumers and, 19; democracy and, 89; governance and, 19–20, 39–42, 46–48, 62, 89, 277–85, 288–90, 293; healthcare and, 290–91; liberalism and, 19–20; markets and, 277–85, 288–93; property and, 39–42, 46–48, 62; recommendation systems and, 289–90; socialism and, 39–42, 47, 277, 281 Chetty, Raj, 11 Chiang Kai-shek, 46 China, 15, 46, 56, 133–34, 138 Christensen, Clayton, 202 Chrysler, 193 Citigroup, 183, 184, 191 Clarke, Edward, 99, 102, 105 Clayton Act, 176–77, 197, 311n25 Clemens, Michael, 162 Coase, Ronald, 40, 48–51, 299n26 Cold War, xix, 25, 288 collective bargaining, 240–41 collective decisions: democracy and, 97–105, 110–11, 118–20, 122, 124, 273, 303n17, 304n36; manipulation of, 99; markets for, 97–105; public goods and, 98; Quadratic Voting (QV) and, 110–11, 118–20, 122, 124, 273, 303n17, 304n36; Vickrey and, 99, 102, 105 colonialism, 8, 131 Coming of the Third Reich, The (Evans), 93 common ownership self-assessed tax (COST): broader application of, 273–76; cybersquatters and, 72; education and, 258–59; efficiency and, 256, 261; equality and, 258; globalization and, 269–70; growth and, 73, 256; human capital and, 258–61; immigrants and, 261, 269, 273; inequality and, 256–59; international trade and, 270; investment and, 258–59, 270; legal issues and, 275; markets and, 286; methodology of, 63–66; monopolies and, 256–61, 270, 300n43; objections to, 300n43; optimality and, 61, 73, 75–79, 317n18; personal possessions and, 301n47, 317n18; political effects of, 261–64; predatory outsiders and, 300n43; prices and, 62–63, 67–77, 256, 258, 263, 275, 300n43, 317n18; property and, 31, 61–79, 271–74, 300n43, 301n47; public goods and, 256; public leases and, 69–72; Quadratic Voting (QV) and, 123–25, 194, 261–63, 273, 275, 286; Radical Markets and, 79, 123–26, 257–58, 271–72, 286; taxes and, 61–69, 73–76, 258–61, 275, 317n18; technology and, 71–72, 257–59; true market economy and, 72–75; voting and, 263; wealth and, 256–57, 261–64, 269–70, 275, 286 communism, 19–20, 46–47, 93–94, 125, 278 competition: antitrust policies and, 23, 48, 174–77, 180, 184–86, 191, 197–203, 242, 255, 262, 286; auctions and, xv–xix, 49–51, 70–71, 97, 99, 147–49, 156–57; bargaining and, 240–41, 299n26; democracy and, 109, 119–20; by design, 49–55; elitism and, 25–28; equilibrium and, 305n40; eternal vigilance and, 204; horizontal concentration and, 175; imperfect, 304n36; indexing and, 185–91, 302n63; innovation and, 202–3; investment and, 196–97; labor and, 145, 158, 162–63, 220, 234, 236, 239, 243, 245, 256, 266; laissez-faire and, 253; liberalism and, 6, 17, 20–28; lobbyists and, 262; monopolies and, 174; monopsony and, 190, 199–201, 223, 234, 238–41, 255; ownership and, 20–21, 41, 49–55, 79; perfect, 6, 25–28, 109; prices and, 20–22, 25, 173, 175, 180, 185–90, 193, 200–201, 204, 244; property and, 41, 49–55, 79; Quadratic Voting (QV) and, 304n36; regulations and, 262; resale price maintenance and, 200–201; restoring, 191–92; Section 7 and, 196–97, 311n25; selfishness and, 109, 270–71; Smith on, 17; tragedy of the commons and, 44 complexity, 218–20, 226–28, 274–75, 279, 281, 284, 287, 313n15 “Computer and the Market, The” (Lange), 277 computers: algorithms and, 208, 214, 219, 221, 281–82, 289–93; automation of labor and, 222–23, 251, 254; central planning and, 277–85, 288–93; data and, 213–14, 218, 222, 233, 244, 260; Deep Blue, 213; distributed computing and, 282–86, 293; growth in poor countries and, 255; as intermediaries, 274; machine learning (ML) and, 214 (see also machine learning [ML]); markets and, 277, 280–93; Mises and, 281; Moore’s Law and, 286–87; Open-Trac and, 31–32; parallel processing and, 282–86; prices of, 21; recommendation systems and, 289–90 Condorcet, Marquis de, 4, 90–93, 303n15, 306n51 conspicuous consumption, 78 Consumer Reports magazine, 291 consumers: antitrust suits and, 175, 197–98; central planning and, 19; data from, 47, 220, 238, 242–44, 248, 289; drone delivery to, 220; as entrepreneurs, 256; goods and services for, 27, 92, 123, 130, 175, 280, 292; institutional investment and, 190–91; international culture for, 270; lobbyists and, 262; machine learning (ML) and, 238; monopolies and, 175, 186, 197–98; preferences of, 280, 288–93; prices and, 172 (see also prices); recommendation systems and, 289–90; robots and, 287; sharing economy and, 117; Soviet collapse and, 289; technology and, 287 cooperatives, 118, 126, 261, 267, 299n24 Corbyn, Jeremy, 12, 13 corruption, 3, 23, 27, 57, 93, 122, 126, 157, 262 Cortana, 219 cost-benefit analysis, 2, 244 “Counterspeculation, Auctions and Competitive Sealed Tenders” (Vickrey), xx–xxi Cramton, Peter, 52, 54–55, 57 crowdsourcing, 235 crytocurrencies, 117–18 cybersquatters, 72 data: algorithms and, 208, 214, 219, 221, 281–82, 289–93; big, 213, 226, 293; computers and, 213–14, 218, 222, 233, 244, 260; consumer, 47, 220, 238, 242–44, 248, 289; diamond-water paradox and, 224–25; diminishing returns and, 226, 229–30; distribution of complexity and, 228; as entertainment, 233–39, 248–49; Facebook and, 28, 205–9, 212–13, 220–21, 231–48; feedback and, 114, 117, 233, 238, 245; free, 209, 211, 220, 224, 231–35, 239; Google and, 28, 202, 207–13, 219–20, 224, 231–36, 241–42, 246; investment in, 212, 224, 232, 244; labeled, 217–21, 227, 228, 230, 232, 234, 237; labor movement for, 241–43; Lanier and, 208, 220–24, 233, 237, 313n2, 315n48; marginal value and, 224–28, 247; network effects and, 211, 236, 238, 243; neural networks and, 214–19; online services and, 211, 235; overfitting and, 217–18; payment systems for, 210–13, 224–30; photographs and, 64, 214–15, 217, 219–21, 227–28, 291; programmers and, 163, 208–9, 214, 217, 219, 224; Radical Markets for, 246–49; reCAPTCHA and, 235–36; recommendation systems and, 289–90; rise of data work and, 209–13; sample complexity and, 217–18; siren servers and, 220–24, 230–41, 243; social networks and, 202, 212, 231, 233–36; technofeudalism and, 230–33; under-employment and, 256; value of, 243–45; venture capital and, 211, 224; virtual reality and, 206, 208, 229, 251, 253; women’s work and, 209, 313n4 Declaration of Independence, 86 Deep Blue, 213 DeFoe, Daniel, 132 Demanding Work (Gray and Suri), 233 democracy: 1p1v system and, 82–84, 94, 109, 119, 122–24, 304n36, 306n51; artificial intelligence (AI) and, 219; Athenians and, 55, 83–84, 131; auctions and, 97, 99; basic structure of, 24–25; central planning and, 89; check and balance systems and, 23, 25, 87, 92; collective decisions and, 97–105, 110–11, 118–20, 122, 124, 273, 303n17, 304n36; collective mediocrity and, 96; competition and, 109, 119–20; Declaration of Independence and, 86; efficiency and, 92, 110, 126; elections and, 22, 80, 93, 100, 115, 119–21, 124, 217–18, 296n20; elitism and, 89–91, 96, 124; Enlightenment and, 86, 95; Europe and, 90–96; France and, 90–95; governance and, 84, 117; gridlock and, 84, 88, 122–24, 261, 267; Hitler and, 93–94; House of Commons and, 84–85; House of Lords and, 85; impossibility theorem and, 92; inequality and, 123; Jury Theorem and, 90–92; liberalism and, 3–4, 25, 80, 86, 90; limits of, 85–86; majority rule and, 27, 83–89, 92–97, 100–101, 121, 306n51; markets and, 97–105, 262, 276; minorities and, 85–90, 93–97, 101, 106, 110; mixed constitution and, 84–85; multi-candidate, single-winner elections and, 119–20; origins of, 83–85; ownership and, 81–82, 89, 101, 105, 118, 124; public goods and, 28, 97–100, 107, 110, 120, 123, 126; Quadratic Voting (QV) and, 105–22; Radical Markets and, 82, 106, 123–26, 203; supermajorities and, 84–85, 88, 92; tyrannies and, 23, 25, 88, 96–100, 106, 108; United Kingdom and, 95–96; United States and, 86–90, 93, 95; voting and, 80–82, 85–93, 96, 99, 105, 108, 115–16, 119–20, 123–24, 303n14, 303n17, 303n20, 304n36, 305n39; wealth and, 83–84, 87, 95, 116 Demosthenes, 55 Denmark, 182 Department of Justice (DOJ), 176, 186, 191 deregulation, 3, 9, 24 Desmond, Matthew, 201–2 Dewey, John, 43 Dickens, Charles, 36 digital economy: data producers and, 208–9, 230–31; diamond-water paradox and, 224–25; as entertainment, 233–39; facial recognition and, 208, 216, 218–19; free access and, 211; Lanier and, 208, 220–24, 233, 237, 313n2, 315n48; machine learning (ML) and, 208–9, 213–14, 217–21, 226–31, 234–35, 238, 247, 289, 291, 315n48; payment systems for, 210–13, 221–30, 243–45; programmers and, 163, 208–9, 214, 217, 219, 224; rise of data work and, 209–13; siren servers and, 220–24, 230–41, 243; spam and, 210, 245; technofeudalism and, 230–33; virtual reality and, 206, 208, 229, 251, 253 diversification, 171–72, 180–81, 185, 191–92, 194–96, 310n22, 310n24 dot-com bubble, 211 double taxation, 65 Dupuit, Jules, 173 Durkheim, Émile, 297n23 Dworkin, Ronald, 305n40 dystopia, 18, 191, 273, 293 education, 114; common ownership self-assessed tax (COST) and, 258; data and, 229, 232, 248; elitism and, 260; equality in, 89; financing, 276; free compulsory, 23; immigrants and, 14, 143–44, 148; labor and, 140, 143–44, 148, 150, 158, 170–71, 232, 248, 258–60; Mill on, 96; populist movements and, 14; Stolper-Samuelson Theorem and, 143 efficient capital markets hypothesis, 180 elections, 80; data and, 217–18; democracy and, 22, 93, 100, 115, 119–21, 124, 217–18, 296n20; gridlock and, 124; Hitler and, 93; multi-candidate, single-winner, 119–20; polls and, 13, 111; Quadratic Voting (QV) and, 115, 119–21, 268, 306n52; U.S. 2016, 93, 296n20 Elhauge, Einer, 176, 197 elitism: aristocracy and, 16–17, 22–23, 36–38, 84–85, 87, 90, 135–36; bourgeoisie and, 36; bureaucrats and, 267; democracy and, 89–91, 96, 124; education and, 260; feudalism and, 16, 34–35, 37, 41, 61, 68, 136, 230–33, 239; financial deregulation and, 3; immigrants and, 146, 166; liberalism and, 3, 15–16, 25–28; minorities and, 12, 14–15, 19, 23–27, 85–90, 93–97, 101, 106, 110, 181, 194, 273, 303n14, 304n36; monarchies and, 85–86, 91, 95, 160 Emergency Economic Stabilization Act, 121 eminent domain, 33, 62, 89 Empire State Building, 45 Engels, Friedrich, 78, 240 Enlightenment, 86, 95 entrepreneurs, xiv; immigrants and, 144–45, 159, 256; labor and, 129, 144–45, 159, 173, 177, 203, 209–12, 224, 226, 256; ownership and, 35, 39 equality: common ownership self-assessed tax (COST) and, 258; education and, 89; immigrants and, 257; labor and, 147, 166, 239, 257; liberalism and, 4, 8, 24, 29; living standards and, 3, 11, 13, 133, 135, 148, 153, 254, 257; Quadratic Voting (QV) and, 264; Radical Markets and, 262, 276; trickle down theories and, 9, 12 Espinosa, Alejandro, 30–32 Ethereum, 117 Europe, 177, 201; democracy and, 88, 90–95; European Union and, 15; fiefdoms in, 34; government utilities and, 48; income patterns in, 5; instability in, 88; labor and, 11, 130–31, 136–47, 165, 245; social democrats and, 24; unemployment rates in, 11 Evans, Richard, 93 Evicted (Desmond), 201–2 Ex Machina (film), 208 Facebook, xxi; advertising and, 50, 202; data and, 28, 205–9, 212–13, 220–21, 231–48; monetization by, 28; news service of, 289; Vickrey Commons and, 50 facial recognition, 208, 216–19 family reunification programs, 150, 152 farms, 17, 34–35, 37–38, 61, 72, 135, 142, 179, 283–85 Federal Communications Commission (FCC), 50, 71 Federal Trade Commission (FTC), 176, 186 feedback, 114, 117, 233, 238, 245 feudalism, 16, 34–35, 37, 41, 61, 68, 136, 230–33, 239 Fidelity, 171, 181–82, 184 financial crisis of 2008, 3, 121 Fitzgerald, F.

pages: 335 words: 96,002

WEconomy: You Can Find Meaning, Make a Living, and Change the World
by Craig Kielburger , Holly Branson , Marc Kielburger , Sir Richard Branson and Sheryl Sandberg
Published 7 Mar 2018

Connect with the following groups: Investors' Circle is an early-stage impact investment network that favors startups with an American presence Put Your Money Where Your Mouth/Meaning Is Company (PYMWYMIC) is a European community of funders Go Beyond is a traditional network of angel investors that lists social impact among its five priorities Toniic is a global community of impact investors Impact Assets showcases 50 impact investment fund managers each year Cause Capitalism lists 15 social venture capital firms worth knowing about Impact Space is a database of more than 2,000 impact investors, searchable by objective and location The GIIN's Investors' Council lists 50 leading impact investors Where Would You Invest?18 Rate of Gross Domestic Product (GDP) growth by 2020: In emerging markets, 5 percent. Rate of Gross Domestic Product (GDP) growth by 2020: In developed markets, 2 percent. Projected percentage of global GDP in emerging markets: 37 percent by 2020. Projected percentage of global GDP in emerging markets: 66 percent by 2050. Biggest players: India and China will represent 50 percent of that global GDP by 2050.

pages: 330 words: 99,044

Reimagining Capitalism in a World on Fire
by Rebecca Henderson
Published 27 Apr 2020

Japanese banks also held significant equity stakes in their debtors. 88. Nishiyama Kengo, “Proxy Voting Trends in 2014 and Outlook in 2015,” presentation, Financial Services Agency, Tokyo, July 9, 2013, www.fsa.go.jp/frtc/kenkyu/gijiroku/20140709/01.pdf. 89. “GDP Growth (Annual %)—Japan,” World Bank Data, https://data.worldbank.org/indicator/NY.GDP.MKTP.KD.ZG?locations=JP; “United Kingdom,” World Bank Data, https://data.worldbank.org/country/united-kingdom. 90. “GDP Growth (Annual %)—Japan,” World Bank Data, https://data.worldbank.org/indicator/NY.GDP.MKTP.KD.ZG?locations=JP; “United Kingdom,” World Bank Data, https://data.worldbank.org/country/united-kingdom. 91.

pages: 93 words: 30,572

How to Stop Brexit (And Make Britain Great Again)
by Nick Clegg
Published 11 Oct 2017

This isn’t simply about the price of things on supermarket shelves. It’s also about the raw materials on which our economy relies. When import costs go up, it has a knock-on effect on everything from food production to complex engineering. So the Brexit squeeze on sterling means the economy will grow less quickly. That’s why GDP growth fell to 0.2 per cent in the first quarter of 2017. Remarkably, the UK had the slowest rate of growth of all the twenty-seven other countries of the EU. It went from being the fastest-growing economy in the G7 in 2016 to the joint slowest (with Italy) in the first three months of 2017.39 For businesses, this is only part of the story.

pages: 385 words: 111,113

Augmented: Life in the Smart Lane
by Brett King
Published 5 May 2016

Previously such huge national efforts had been limited to wartime endeavours, but during the cold war, while the arms race was in full swing, the ability to claim the region of space local to earth orbit was just as critical a foothold in the minds of these two competing nations. The atomic age was an age of massive economic growth. GDP growth hovered between 6 and 10 per cent for most of the 1950s and 1960s, and the demand for electricity growth was running at 7 per cent per year. While coal-fired plants were growing rapidly, projections showed that these facilities would not be able to cater for the growth expected through to the end of the century.

Given the efficiency gains that technology brings, does that mean that as technology displaces historical businesses it inevitably destroys jobs? Actually no, that’s not what the research shows at all. “The Internet’s impact on global growth is rising rapidly. The Internet accounted for 21 per cent of GDP growth over the last five years among the developed countries MGI studied, a sharp acceleration from the 10 per cent contribution over 15 years. Most of the economic value created by the Internet falls outside of the technology sector, with 75 per cent of the benefits captured by companies in more traditional industries.

pages: 430 words: 109,064

13 Bankers: The Wall Street Takeover and the Next Financial Meltdown
by Simon Johnson and James Kwak
Published 29 Mar 2010

You can intimidate everybody.”)29 They were betting that by increasing taxes and bringing budget deficits under control, they could reduce interest rates and stimulate growth. These policy choices approximately coincided with the beginning of one of the longest economic booms in recent history—from 1993 to 2000, annual real GDP growth averaged 3.9 percent, while inflation averaged only 1.8 percent30—although other factors probably contributed to the boom, including the increasing use of computer technology and the impact of globalization. In early 1995, Rubin succeeded Bentsen as treasury secretary, becoming the administration’s primary economic policymaker, at a crucial moment for the White House.

“Rubinomics” established the party’s credibility in the eyes of the business and financial communities, repairing the damage done by the perceived economic mismanagement of the Carter administration and helping to balance the fund-raising scales against the Republicans. The long boom of the 1990s, whether or not it should be credited to Clinton-era policies, looked especially good when compared to the record of the George W. Bush administration, which saw slower growth (average real GDP growth of 2.2 percent, down from 3.9 percent under Clinton) and declining median income (falling from $52,500 in 2000 to $50,300 in 2008, both in 2008 dollars).33 The shift of the Republican Party toward “cultural” issues also helped throw more investment banking and hedge fund moguls into Democratic arms.

pages: 363 words: 107,817

Modernising Money: Why Our Monetary System Is Broken and How It Can Be Fixed
by Andrew Jackson (economist) and Ben Dyson (economist)
Published 15 Nov 2012

Perhaps most important to Zimbabwe was its strong banking sector and a well-functioning property rights system, which “allowed owners to use the equity in their land to develop and build new businesses, or expand their old ones.” (Richardson, 2005, p. 1) After gaining independence in 1980, Zimbabwe was on its way to prosperity, with an average GDP growth rate of 4.3 percent a year. For about two decades it experienced sustained growth, which was only occasionally interrupted.1 However, by the end of the 1990s this progress came to a halt and Zimbabwe’s economy entered into a depression. What caused this turnaround? Media reports often simplistically imply that the printing of money was the cause of Zimbabwe’s economic collapse.

Zimbabwe’s president, Robert Mugabe, and other members of the leading party ZANU-PF, have been eager to blame the continuous years of drought and the targeted sanctions of Western countries as the main reasons for the economic decay. Yet these claims are easily refuted - sanctions on top government officials only came into effect in 2002. Empirical research questions the claim that drought is to blame: “The historically close relationship between rainfall and GDP growth ended in 2000 – the first years after the land reforms.” (Coltart, 2008, p. 10) So what were the real reasons for Zimbabwe’s decline? In the mid 90s, about 4,500 white families owned most of the commercial farms, employing 350,000 black workers and often providing financial support for local infrastructure, hospitals and schools.

pages: 576 words: 105,655

Austerity: The History of a Dangerous Idea
by Mark Blyth
Published 24 Apr 2013

As Peter Englund tells it, in 1989 alone “the construction and real estate stock price index fell by 25 percent … [and] by the end of 1990 the real estate index had fallen 52 percent.”127 On top of this massive deflation, which had huge knock-on effects in the labor market, Sweden was hit by the deflationary effects of a currency crisis in the ERM mechanism that combined with the real estate bust to reduce GDP growth by −5.1 percent between 1991 and 1993. Then, and only then, did interest rates really skyrocket.128 No one cared one jot about the national debt at this point. In such a situation, however, consumers who have taken on a fair amount of debt in the expectation of capital gains in stocks and real estate, and who suddenly find themselves underwater, might not spend all that much—even if they receive a tax cut.

Starved for good news on the austerity front, the troika of the IMF, ECB, and EC responded to the Latvian government’s call to join them in a celebration of the success of Baltic States.151 After the party in Riga, an ECB board member read straight from the expansionary austerity script: Figure 6.1 REBLL GDP Growth Rates 2000–2011 Source: Data from World Bank; last updated September 6, 2012. Undertaking the necessary austerity measures at an early stage … allowed the Baltics to benefit from positive confidence effects … allowed Latvia to return to the financial markets well ahead of schedule … allowed growth to bounce back after exceptionally severe output contractions. … The concept of “expansionary contraction” has been used and criticized in the ongoing debate about growth and austerity.

pages: 338 words: 104,684

The Deficit Myth: Modern Monetary Theory and the Birth of the People's Economy
by Stephanie Kelton
Published 8 Jun 2020

Companies would go under, and eventually only a few people would be employed building yachts for the wealthy, working as their groundskeepers or flying them around in their private jets. A 2015 study by the IMF already found that “an increase in the income share of the bottom 20% (the poor) is associated with higher GDP growth,” while “GDP growth actually declines” when “the income share of the top 20% (the rich) increases.”82 If you increase the income of poor people, they generally consume more, spending that money right back into the economy. Conversely, we see that more income to the rich results in more stock-market purchases and savings, rather than the money flowing back into the economy.

pages: 356 words: 106,161

The Glass Half-Empty: Debunking the Myth of Progress in the Twenty-First Century
by Rodrigo Aguilera
Published 10 Mar 2020

And almost no one knows about it.3 Even without erasing this post-2014 blip from history, Venezuela’s narrative over the last half century is one of uninterrupted improvement in almost every socio-economic development indicator, not without some ups and downs, but unequivocally “progress” all the same. And for those tempted to discount the recent crisis as being the result of the illiberal, unenlightened rule by the Chavista regime, they must also concede that this same regime was responsible for the most spectacular improvement in GDP growth and poverty reduction in Venezuela’s history, as can be seen in Figure 2.1. During the boom years of 2004–13, Venezuela was one of the fastest growing economies not just in Latin America, but in the entire world.4 Despite having obvious clientelistic aims behind them, Chavez’s use of state-directed and community-organized “missions” for the poor did more to help the oil wealth trickle down than any of the laissez-faire governments that preceded him.

Furthermore … most OECD countries began their modern economic development in systems with limited political rights and became full-fledged representative democracies only much later.35 Despite the evidence that democracy may not be the most efficient political system to achieve rapid and sustained economic growth, hardly anyone would dare argue that we replace presidents and prime ministers with benign dictators. Democratic states are not run by the logic of pure efficiency but towards achieving the broadest level of societal well-being even if this comes at a cost to the rate of GDP growth. It therefore seems ironic that the main institution in charge of producing the prosperity necessary to achieve this societal well-being, the firm, is allowed to remain totalitarian. As a thought experiment, imagine if just one firm controlled all economic activity similar to the type of “omni-corp” we so often see in dystopian science fiction.

pages: 603 words: 182,781

Aerotropolis
by John D. Kasarda and Greg Lindsay
Published 2 Jan 2009

The reason: time equals money. The wealthier we become, the more we value our time, and the more we value our time, the more likely we are to fly. This is why, even with higher oil prices, passenger numbers continue to increase in growing economies. A bump in airfares leads to an equal decline in demand. But a bump in GDP growth causes demand to rise twice as fast. By this standard, the average American (and Dane, Swiss, and Irishman) is already a frequent flier, not that four trips a year is enough to establish residency in Airworld. Its constituents are the real-life Ryan Binghams making forty trips a year, a caste better known as road warriors.

As for peak oil’s collision with the world’s factory, it’s worth restating a few fundamental statistics quickly: a third of the value of all the goods made in the world, three trillion dollars’ worth, travels by air, while composing barely 1 percent of their weight. Air cargo’s growth outpaced world trade’s by a factor of four-to-one over the last thirty-five years, and blew past global GDP growth by nine-to-one, meaning more and more of what’s worth making and moving (including half of American exports) is aloft. In the Instant Age, Kasarda says, “The price of oil matters less than the price of speed.” Contrary to Jeff Rubin’s assertion, the real costs of air transport have not fallen or risen much since the early 1980s.

He estimated that China cost Americans 1.4 million jobs during the recession, many of them the green ones President Obama had promised “can’t be outsourced.” In just two years, it had leapfrogged the West to become the world’s largest manufacturer of wind turbines and solar panels, employing a million workers and adding a hundred thousand annually. Ninety-five percent of the panels made by its flagship company were bound for overseas. China’s GDP growth resumed its double-digit pace, while developed nations stumbled from one crisis to the next. It overtook Germany as the world’s top exporter and became America’s largest trading partner, supplying a staggering 19 percent of imports—and a tenth of all goods traded worldwide. Its strategy was the same as Japan’s in the 1970s: while America reeled from stagflation, it went for the jugular with a massive export blitz.

pages: 651 words: 180,162

Antifragile: Things That Gain From Disorder
by Nassim Nicholas Taleb
Published 27 Nov 2012

In other words, if something is fragile, its risk of breaking makes anything you do to improve it or make it “efficient” inconsequential unless you first reduce that risk of breaking. As Publilius Syrus wrote, nothing can be done both hastily and safely—almost nothing. As to growth in GDP (gross domestic product), it can be obtained very easily by loading future generations with debt—and the future economy may collapse upon the need to repay such debt. GDP growth, like cholesterol, seems to be a Procrustean bed reduction that has been used to game systems. So just as, for a plane that has a high risk of crashing, the notion of “speed” is irrelevant, since we know it may not get to its destination, economic growth with fragilities is not to be called growth, something that has not yet been understood by governments.

“The simple one-way relationship which so entrances our politicians and commentators—education spending in, economic growth out—simply doesn’t exist. Moreover, the larger and more complex the education sector, the less obvious any links to productivity become.” And, similar to Pritchet, she looks at countries such as, say, Egypt, and shows how the giant leap in education it underwent did not translate into the Highly Cherished Golden GDP Growth That Makes Countries Important or Unimportant on the Ranking Tables. This argument is not against adopting governmental educational policies for noble aims such as reducing inequality in the population, allowing the poor to access good literature and read Dickens, Victor Hugo, or Julien Gracq, or increasing the freedom of women in poor countries, which happens to decrease the birth rate.

Just as projects of one hundred million dollars are more unpredictable and more likely to incur overruns than five-million-dollar ones, simply by being richer, the world is troubled with additional unpredictability and fragility. This comes with growth—at a country level, this Highly Dreamed-of GDP Growth. Even at an individual level, wealth means more headaches; we may need to work harder at mitigating the complications arising from wealth than we do at acquiring it. Conclusion To conclude this chapter, fragility in any domain, from a porcelain cup to an organism, to a political system, to the size of a firm, or to delays in airports, resides in the nonlinear.

pages: 272 words: 19,172

Hedge Fund Market Wizards
by Jack D. Schwager
Published 24 Apr 2012

And Stage 5: After bubbles burst and when deleveragings occur, private debt growth, private sector spending, asset values, and net worths decline in a selfreinforcing negative cycle. To compensate, government debt growth, government deficits, and central bank “printing” of money typically increase. In this way, their central banks and central governments cut real interest rates and increase nominal GDP growth so that it is comfortably above nominal interest rates in order to ease debt burdens. As a result of these low real interest rates, weak currencies, and poor economic conditions, their debt and equity assets are poor performing and increasingly these countries have to compete with less expensive countries that are in the earlier stages of development.

A perfect recent example was related to our hypothesis that the nonlinear impact of increasing coal imports by China could create a trading opportunity. China is by far the world’s largest consumer and producer of thermal coal, accounting for about 50 percent of global activity. The market has grown at roughly 10 percent per year for decades now, which is in line with long-term GDP growth. Unlike most other commodities, which it must import, China has abundant physical reserves of coal. Demand growth has been consistently supplied by increased domestic production, with a small residual surplus that was exported. So, despite being the world’s largest market by far, at roughly 3 billion tons per year, China’s coal market operated essentially as a closed system.

If we had been nursing a 15 percent loss, we could never have taken the risk of buying on the break, even though it seemed like a great opportunity, because if we were wrong, we would be down another 10 percent and down 25 percent for the month. We would have been out of business. What was the primary cause for the 2008 loss, which occurred during the second half of the year? Our losses in the second half of 2008 came from our net long exposure. Although in the developed countries, GDP growth was flattening out and beginning to look ugly, in the emerging markets, everything was still booming. The earnings of all the companies in our portfolio were up sharply and valuations were very attractive. So whereas the fundamentals for developed markets suggested that you didn’t want to have any exposure to anything, the fundamentals of the individual emerging market companies supported a strong net long posture.

pages: 586 words: 186,548

Architects of Intelligence
by Martin Ford
Published 16 Nov 2018

To explain why, let’s look at the last 50 years of economic growth, and you look at that for the G20 countries (which make up a little more than 90% of global GDP), the average economic GDP growth over the last 50 years where we have the data, so between 1964 and 2014, was 3.5%. This was the average GDP growth across those countries. If you do classic growth decomposition and growth accounting work, it shows that GDP and economic growth comes from two things: one is productivity growth, and the other is expansions in the labor supply. Of the 3.5% of average GDP growth we’ve had in the last 50 years, 1.7% has come from expansions in the labor supply, and the other 1.8% has come from productivity growth over those 50 years.

pages: 1,066 words: 273,703

Crashed: How a Decade of Financial Crises Changed the World
by Adam Tooze
Published 31 Jul 2018

In the familiar twentieth-century island model of international economic interaction, the basic units were national economies that traded with one another, ran trade surpluses and deficits and accumulated national claims and liabilities. Those entities were made familiar by economists, who gave them an empirical, everyday reality in statistics for unemployment, inflation and GDP. And around them an entire conception of national politics developed.32 Good economic policy was what was good for GDP growth. Questions of distribution—the politics of “who whom?”—could be weighed up against the general interest in “growing the size of the cake.” By contrast, the new macrofinancial economics, with its relentless focus on the “interlocking matrix” of corporate balance sheets, strips away all the comforting euphemisms.

Meanwhile, EU accession triggered a subsidy payment of 19.8 billion euros to Romania’s population of 21 million. It also enabled freedom of movement and a massive migration of Romanians to the West, notably to Italy, where the Romanian population topped 1 million in 2007, triggering local anti-immigrant resentment that the Prodi government struggled to contain.42 Meanwhile, at home, Romania’s GDP growth was running at 6 percent, projected to rise to 7 percent in 2008. The Romanians dubbed themselves the “Tigers of the East.”43 There was talk of Romania joining the rich country club of the eurozone as soon as 2012. In Bucharest, its newly renovated capital, the Europe Real Estate Yearbook reported a vacancy rate for prime office space of no more than 0.02 percent.44 As US subprime was imploding, international investors like ING Real Estate were snapping up Romanian assets to add to their East European property portfolios.45 As host of the NATO summit in April 2008, Bucharest was the perfect stage for the last major effort by George W.

China had made itself into an export champion, but in so doing it had also fostered imports—of commodities and components from Australasia, the Middle East, Africa, the rest of Asia and Latin America, as well as technology and advanced machinery from the West. A large part of the value in China’s world-beating exports was accounted for by imported raw materials and subcomponents. As a result, net exports accounted for a smaller share of Chinese GDP growth before 2008 than one might imagine. In fact, no more than one third of China’s growth from 1990 was driven by exports, with two thirds coming from domestic demand.7 This was a very different balance from that of a truly export-dependent economy, of which Germany was the quintessential example. With slow domestic investment and consumption, the vast majority of Germany’s growth after 2000 was accounted for by foreign demand.

pages: 122 words: 37,785

Mongolia - Culture Smart!: The Essential Guide to Customs & Culture
by Alan Sanders
Published 1 Feb 2016

Other Risks If you plan to skate or ski, climb mountains, trek over deserts, ride horses or camels, or fly on unscheduled flights, remember to check your insurance coverage first, and make arrangements with recommended tour companies. chapter eight BUSINESS BRIEFING THE BUSINESS ENVIRONMENT In recent years Mongolia’s GDP growth has been falling, from 17.5 percent in 2011 to a projected 3 percent in 2015. Inflation is high. It was 9.3 percent in the first quarter of 2015. The US dollar–MNT rate has changed, from US $1=1,357 in 2012 to US $1=1,985 in 2015. In order to reduce deficits, the 2014 and 2015 budgets were both revised twice to cut government spending, including the dismissal of many civil servants from government agencies and state-owned enterprises, thirty-two of which were loss-making.

pages: 393 words: 115,263

Planet Ponzi
by Mitch Feierstein
Published 2 Feb 2012

In happy-world, taxation is strong, because all those companies are booming away. Federal obligations on such things as food stamps and housing benefits will diminish for the same reason. It’s easy putting budgets together in happy-land, because all the nasty things (inflation, unemployment) do all the right things, and all the nice things (GDP growth) go skipping away like spring lambs. Sadly, happy-land doesn’t look much like the planet I live on. On my planet, unemployment has stayed relentlessly high. Leading indicators of mood such as the ISM index show consistently negative results.4 Growth is constantly being revised downwards.5 Inflation is burdensome.

The pain in Spain has grabbed the headlines, but the eurozone crisis afflicts a continent, not a nation. It will only take a bank failure or a bad economic number to put Italy (with its much greater debt load) into the spotlight again. Italy, remember, has had four consecutive quarters of negative GDP growth. That’s not a recession, it’s a depression, and there’s no glimmer of change visible on the horizon. Indeed, the shrinking economy leads to one inescapable conclusion: that Italy is insolvent, mathematically unable to pay its debt. The country is too large to rescue, so disaster is the only possible outcome.

pages: 453 words: 117,893

What Would the Great Economists Do?: How Twelve Brilliant Minds Would Solve Today's Biggest Problems
by Linda Yueh
Published 4 Jun 2018

The IMF had urged Britain to reconsider imposing austerity before the economy had fully recovered. And not just Britain. The initial years of the recovery saw governments from Europe to America cutting public expenditure while private demand was weak. In the UK, the recovery was tepid and output even contracted at times. In fact, 2012 saw two non-consecutive quarters of negative GDP growth, although that’s not a recession since the formal definition requires two such consecutive quarters. In Britain, the pace of austerity had slowed alongside the economy, but was such a policy necessary? Part of the rationale for cutting government spending was that investors would not want to lend to the UK if it did not show that it was reducing its budget deficit.

France French Revolution inequality Physiocrats and Trier Freddie Mac free market capitalism see also capitalism competition see competition see also free trade free trade and competition see competition in corn see also Corn Laws regional and bilateral agreements and theory of comparative advantage free trade agreements (FTAs) Friedman, David Friedman, Janet Friedman, Milton and the 2008 financial crisis Capitalism and Freedom and the Federal Reserve Free to Choose and Goldwater and the Great Depression John Bates Clark Medal and Keynes libertarian views life and times of A Monetary History of the United States, (with Schwartz) and monetary policy and Nixon Nobel Prize and Pinochet/Chile political influence and prediction and quantitative easing and Reagan and Stigler and Thatcher A Theory of the Consumption Function Two Lucky People Tyranny of the Status Quo Volker Lectures Friedman, Rose, née Director Frisch, Ragnar Fuji Furman, Jason Galbraith, John Kenneth gas industry General Electric (GE) German Historical School of economics Germany and China competitiveness and wages and the Great Depression industrialization/Industrial Revolution inequality manufacturing and Marshall and Marx productivity and wage growth retained cash of companies reunification and wages trade and the Treaty of Versailles wage stagnation worker representation gilts Glass–Steagall Act global macroeconomic imbalances globalization backlash and deindustrialization and emerging economies future of and inequality losers from and low wages and prosperity and specialization and trade gold and the dollar standard Goldwater, Barry Google Android government administration government bonds see also gilts government regulation government spending deficit spending and employment and Keynes see also fiscal policy: Keynes’ fiscal activism public investment/spending see public investment; public spending Gramm–Leach–Bliley Act Great Britain see Britain/UK Great Depression (1930s) Black Thursday Black Tuesday and the Federal Reserve Fisher and risk of repeating the 1930s and Friedman and ‘Great Contraction’ and Keynesian revolution/economics as a liquidity crisis and unemployment and US GDP Greece see also euro crisis gross domestic product (GDP) debt-to-GDP ratio emerging economies and world GDP and government spending investment as share of Japan per capita trade-to GDP ratios US 2015 GDP US decline with Great Depression world GDP growth of economies see economic growth Guillebaud, Claude Haberler, Gottfried Hansen, Alvin Hardenberg, Karl August von Harris, Seymour Harrison, George Hausmann, Ricardo Hayek, Friedrich and the 2008 global financial crisis and the backlash against globalization business cycle theory and capitalism in Collectivist Economic Planning The Constitution of Liberty The Denationalization of Money The Fatal Conceit and the IEA influence and Keynes Law, Legislation and Liberty life and times of Nobel Prize ‘Paradox of Saving’ path to fame political philosophy presidency of Mont Pelerin Society Prices and Production Pure Theory of Capital The Road to Serfdom and Schumpeter The Sensory Order and spontaneous order and Thatcher Hayek, Hella Hazard, Caroline Hazard, Margaret see Fisher, Margaret Hazard, Rowland Hegel, Georg Wilhelm Hicks, John R.

Hopes and Prospects
by Noam Chomsky
Published 1 Jan 2009

Since the election of Morales in 2005, Bolivia’s economic performance has been quite impressive. A Center for Economic and Policy Research (CEPR) study found that in the four years since Morales took office, economic growth “has been higher than at any time in the last 30 years, averaging 4.9 percent annually.… Projected GDP growth for 2009 is the highest in the hemisphere and follows its peak growth rate in 2008,” along with “several programs targeted at the poorest Bolivians.” These are doubtless factors in Morales’s election in December 2009 by a majority of 64 percent to 26.4 percent for his right-wing opponent, a gain of 10 percent over his unprecedented victory in 2005.55 Throughout most of South America, Washington and elite opinion are compelled to support governments of a kind that might have been harshly condemned and undermined not many years ago, a reflection of the general shift toward independence in Latin America.

Economists David Rosnick and Dean Baker show that “the huge debt numbers that are being used to scare the country—especially the young—are largely projections of how much debt today’s young will pass onto future generations” primarily because “per person health care costs are projected to far outpace the rate of per capita GDP growth” unless there is serious reform of the dysfunctional health care system. The more general impact of turning Congress into a comical version of seventeenth-century Poland, with nobles having a right of veto, is also not pleasant to contemplate, however inadequate the government has been from the standpoint of the public good.51 The business community can appeal to respectable antecedents in its dedicated campaign to increase its already overwhelming power in the political system.

pages: 316 words: 117,228

The Code of Capital: How the Law Creates Wealth and Inequality
by Katharina Pistor
Published 27 May 2019

A considerably less sympathetic depiction of lawyers and their contribution to society than the transaction cost engineering account can be found in the writings of Stephen Magee, a financial economist. He published an op-ed in the Wall Street Journal in 1992 with a graph that plotted the number of lawyers in the US economy against GDP growth rates. The result was an inverted U-shaped curve, with the clear implication that lawyers contribute to economic growth, but only up to a point; too many lawyers have a negative effect on growth.19 These data and their interpretation triggered a fierce debate between Magee and legal scholars, who challenged his calculations, methodology, and his assumptions about the coherence and organizational capacity of the legal profession.20 Resolving this debate at a statistical level may well be impossible, because a simple head count of lawyers says little about what lawyers do and how different parts of the profession contribute to economic and social well-being.

Yet, the coordination of such a tax at the global level might be impossible for political reasons, and for many countries may not even be desirable, as Tsilly Dagan has shown in her recent book. See Tsilly Dagan, International Tax Policy: Between Competition and Cooperation (Cambridge: Cambridge University Press, 2018). 10. For a heroic effort to quantify GDP growth over the centuries, see Angus Maddison, The World Economy—Historical Statistics (Paris: OECD, 2003). 11. See Douglass C. North and Barry R. Weingast, “Constitutions and Commitment: The Evolution of Institutions Governing Public Choice in Seventeenth-Century England,” Journal of Economic History 49, no. 4 (1989):803–832; and David S.

pages: 429 words: 120,332

Treasure Islands: Uncovering the Damage of Offshore Banking and Tax Havens
by Nicholas Shaxson
Published 11 Apr 2011

Also see Monique Morrissey and Dean Baker, “When Rivers Flow Upstream: International Capital Movements in the Era of Globalization,” Center for Economic Policy Research Briefing Paper, March 2003. “A striking feature of the distribution of current account surpluses and deficits among developing countries is that most of the countries that are experiencing high GDP growth have surpluses, and often large surpluses…. The fact that most of these nations continue to experience rapid GDP growth, in spite of this large outflow of capital, suggests that the availability of capital has not been a major impediment to economic growth.” 23.Martin Wolf, “This Time Will Never Be Different,” Financial Times, September 28, 2009. 24.“Capital Inflows: The Role of Controls,” IMF Staff Position Note, February 19, 2010.

pages: 386 words: 112,064

Rich White Men: What It Takes to Uproot the Old Boys' Club and Transform America
by Garrett Neiman
Published 19 Jun 2023

“If you want the American dream today,” Ford Foundation president Darren Walker told CNBC in 2019, “you ought to move to Canada.”9 Some economists and politicians say that the American dream is fading because the economy isn’t growing as quickly as it once was.10 That’s a partial truth: GDP did grow more quickly in the 1950s and 1960s, when the American middle class blossomed.11 However, faster growth wouldn’t be enough to reverse social mobility trends. When David Grusky, who runs Stanford’s Center on Poverty and Inequality, conducted simulations to predict what American inequality would look like now if today’s GDP growth rates matched the growth rates that baby boomers experienced, he found that an uptick in GDP growth would make up for just one-third of the decline in social mobility.12 What accounts for the rest? The widening distribution of incomes, which has become a gaping chasm over the past few decades. But a focus on income inequality largely misses the point.

pages: 859 words: 204,092

When China Rules the World: The End of the Western World and the Rise of the Middle Kingdom
by Martin Jacques
Published 12 Nov 2009

It is projected that the duration of their respective take-offs may be roughly similar: 43 years in the case of the US, 42 years for China, because, although the latter’s growth rate is much faster, its population is also far larger. When the US commenced its take-off in 1870, its GDP accounted for 8.8 per cent of the world’s total, rising to 18.9 per cent by 1913. In contrast, China’s GDP represented 4.9 per cent of the world’s total in 1978, but is likely to rise to 18- 20 per cent by 2020. In both instances, their GDP growth has had a major impact on the expansion of global GDP. In the 1980s, for example, the United States made the biggest single contribution of any country, accounting for 21 per cent of the world’s total increase; in the 1990s, however, China, even at its present limited level of development, surpassed the US , which remained at 21 per cent, while China contributed 27.1 per cent to the growth of global GDP.

Along with the United States it has been the main engine of global economic growth, contributing no less than one-third of the world’s growth in real output between 2002 and 2005. It has been widely credited with having pulled Japan out of its long-running post-bubble recession, having been responsible for two-thirds of the growth in Japan’s exports and one-quarter of its real GDP growth in 2003 alone.140 The emergence of China as the world’s cheapest producer of manufactured goods has resulted in a sharp global drop in their prices. The price of clothing and shoes in the US, for example, has fallen by 30 per cent over the last decade. Major gainers from this have been consumers in the developed world, while the rise in commodity prices consequent upon Chinese demand had a beneficial effect on primary producers - many of which are based in the developing world - until the global downturn intervened.

Major General Qian Lihua, director of the Ministry of Defence’s Foreign Affairs Office, said in an interview that the world should not be surprised if China builds an aircraft carrier but that Beijing would use such a vessel only for offshore defence; Financial Times, 16 November 2008. 162 . China’s military spending will increase by almost 18 per cent in 2007 and rose by 14.7 per cent in 2006, but until recently the growth of military spending did not keep pace with GDP growth; ‘Sharp Rise in China’s Military Spending’, International Herald Tribune, 5 March 2007. Most outside estimates place Chinese military spending along with that of the UK, Japan and Russia. See also, Muire Dickie and Stephen Fidler, ‘China Aims to End US Navy’s Long Pacific Dominance’, Financial Times, 11 June 2007. 163 .

Cultural Backlash: Trump, Brexit, and Authoritarian Populism
by Pippa Norris and Ronald Inglehart
Published 31 Dec 2018

Many Americans lost their homes to foreclosure and house prices plummeted (in December 2008 the Case–Shiller home price index reported its largest price drop in its history), in scope and scale representing the worst downturn since the Great Recession of the 1930s.46 As a result, the US economy contracted from 2007 to 2009, as Figure 5.2 shows; millions were thrown out of work, countless companies went bankrupt, and consumer confidence nosedived. Like dominoes, the aftershocks spread across the Atlantic, catalyzing the Eurozone debt crisis in late 2009.47 Some members of Europe’s 19-­country euro-­currency union saw a sharp decline in GDP growth, which then recovered relatively fast, as shown by trends in annual GDP growth in Figure 5.2. Thus, Germany, which suffered a sharp downturn in 2009, snapped back quickly, thanks to strict banking and credit regulations and Chinese hunger for German products, which compensated for lost sales in the slumping Eurozone. Growth in several other EU member states, like Austria, Belgium, and France, fell temporarily then pulled back to former levels.

Economic Grievances 150 Austria Belgium Bulgaria Croatia Cyprus (1975-) Czech Republic Denmark Estonia Finland France (1963-) Germany Greece Hungary Iceland Ireland Italy Latvia Lithuania Luxembourg Malta Netherlands Poland Portugal Romania Russia Slovakia Slovenia Spain Sweden Switzerland Turkey Ukraine United Kingdom United States 2014 2010 2006 2002 2014 2010 2006 2002 2014 2010 2006 2002 2014 2010 2006 2002 2014 2010 2006 2002 2014 2010 2006 2002 15 10 5 0 –5 –10 –15 2014 15 10 5 0 –5 –10 –15 2010 15 10 5 0 –5 –10 –15 2006 15 10 5 0 –5 –10 –15 2002 Mean GDP growth (annual %) 15 10 5 0 –5 –10 –15 Year Figure 5.2. Annual economic growth during the financial crisis, Europe and the US Note: Annual percent change in GDP, Europe, and the US. Source: World Development Indicators, World Bank, Washington DC. https://data.worldbank .org/indicator/NY.GDP.PCAP.CD?

State-Building: Governance and World Order in the 21st Century
by Francis Fukuyama
Published 7 Apr 2004

The high-performing economies of East Asia vary tremendously with regard to state scope, ranging from minimalist Hong Kong to highly interventionist South Korea, whose average level of domestic protection during its high-growth period was as high as Argentina’s (Amsden 1989). All of these countries nonetheless achieved extraordinarily high rates of per capita GDP growth. By contrast, 20 state-building Latin America as a region scores worse than Asia on virtually every dimension of governance. A further reason for thinking that state strength is more important than scope in determining long-term economic growth rates is that there is a fairly strong positive correlation across a wide variety of countries between per capita GDP and the percentage of GDP extracted by governments (Figure 8).

pages: 131 words: 41,052

Why Europe Will Run the 21st Century
by Mark Leonard
Published 4 Sep 2000

The single market has also led to a doubling of Foreign Direct Investment in the EU, and the competition has forced prices for consumers down to record levels (with air prices falling by over 40% and phone prices by over half).23 The impact of enlargement could be equally transformative. The European Commission estimates that the fact of enlargement alone will increase the GDP growth of the new members by between 1.3 and 2.1 percentage points every year, while enlargement will add an extra 0.7 per cent a year to the existing members’ growth rates.24 A study by Goldman Sachs argues that within half a century, the Chinese, Indian, Brazilian, and Russian economies will be bigger than any of the European economies in the G7 (America, Japan, Germany, France, Britain, Italy, and Canada).

pages: 363 words: 28,546

Portfolio Design: A Modern Approach to Asset Allocation
by R. Marston
Published 29 Mar 2011

The largest emerging market economy, China’s, has had double-digit c06 P2: c/d QC: e/f JWBT412-Marston T1: g December 8, 2010 17:41 Printer: Courier Westford 105 Emerging Markets 30% Brazil Stock Return in Dollars P1: a/b 20% Russia India 10% Philippines Malaysia 0% -3% 0% -10% 3% 6% 9% China 12% GDP Growth FIGURE 6.5 Growth and Stock Returns, 1990–2009 Sources: Data for GDP growth (1990–2005) from World Bank Development Indicators Database and for stock returns (1990–2009) from MSCI. growth for much of the period. Shouldn’t growth translate into high stock returns? To answer this question, it is useful to correlate economic growth rates with stock returns.

pages: 384 words: 121,574

Very Bad People: The Inside Story of the Fight Against the World’s Network of Corruption
by Patrick Alley
Published 17 Mar 2022

The new president, Teodoro Obiang Nguema Mbasogo, who became Africa’s longest-serving dictator, inherited a cripplingly poor country that resembled its fictional counterpart in almost every respect. Except for one: its wealth lay under the sea. Equatorial Guinea’s oil boom came in the 1990s with the arrival of ‘Big Oil’ – companies like Exxon, Marathon Oil and Amerada Hess. According to the IMF, the country saw the fastest GDP growth in the world. Oil revenues increased from around US$3 million a year in 1993 to over US$210 million in 2000, according to the World Bank, which predicted that this figure would reach US$700 million by 2003. Equatorial Guinea became Africa’s third-largest oil exporter, with an economy growing at around 37 per cent per year.

When Mittal Steel made a truly terrible mining deal with the government of Liberia, a deal so bad for the country’s citizens that the new government later demanded its renegotiation, the personal wealth of the company’s owner, Lakshmi Mittal, was 295 times greater than Liberia’s national budget. If those pledges to achieve a sustainable and equitable world were to be achieved, it would require a mind-bogglingly radical overhaul of the entire global economic model, which is based on GDP growth. In turn this is based on the infinite extraction of the Earth’s resources, but infinite growth in a finite world is physically impossible. It doesn’t take a rocket scientist to work out that it’s not if we run out of oil, minerals and everything else we want to consume, or if we exhaust our planet’s ability to sustain life.

pages: 843 words: 223,858

The Rise of the Network Society
by Manuel Castells
Published 31 Aug 1996

More recent evidence remains consistent with the view that capital spending has contributed to a noticeable pick-up in productivity –and probably by more than can be explained by usual business cycle forces.30 In fact, only a substantial productivity increase could explain the economic boom in the US in 1994–9: 3.3 percent of annual GDP growth, with inflation below 2 percent, unemployment under 5 percent, and an increase, albeit moderate, in average real wages. Figure 2.1 Productivity growth in the United States, 1995–1999 (index of output per hour of all people in non-farm businesses; 1992 = 100, seasonally adjusted Source: US Bureau of Labor Statistics as reported by Uchitelle (1999) While business circles, in America and in the world, appeared to embrace the notion of a new economy, along the lines I suggested above, some respected academic economists (including Solow, Krugman, and Gordon) remained skeptical.

It was the inability of the public sector to keep expanding its markets, and thus income-generating employment, without either increasing taxes on capital or fueling inflation through additional money supply and public indebtedness.37 While some short-term answers to the profitability crisis focused on labor trimming and wage attrition, the real challenge for individual firms and for capitalism as a whole was to find new markets able to absorb a growing productive capacity of goods and services.38 This is at the root of the substantial expansion of trade relative to output, and, later, that of foreign direct investment in the last two decades of the twentieth century. They became the engines of economic growth throughout the world.39 It is true that world trade grew at a lower rate in these years than during the 1960s (because of a lower rate of economic growth overall), but the critical figure is the relationship between the expansion of trade and GDP growth: in 1970–80, while world’s GDP grew at an annual 3.4 percent, exports of merchandise trade grew at 4 percent per year. In 1980–92, the corresponding figures were 3 percent and 4.9 percent. There was a substantial acceleration of world trade, when measured in value, in the second half of the 1980s: an average annual growth of 12.3 percent.

These industries were (and will be for a long time) information technology and finance. In the United States, the information technology industries led the charge in the 1990s (see figure 2.8).119 Between 1995 and 1998, the information technology sector, accounting for only about 8 percent of America’s GDP, contributed, on average, 35 percent of GDP growth. Value added per worker in information technology-producing industries grew at an annual average of 10.4 percent in the 1990s, about five times the growth rate in the economy as a whole.120 Projections from the Commerce Department121 indicate that by 2006 almost 50 percent of the American labor force will be employed in industries which are either producers or big users of information technology.

pages: 142 words: 45,733

Utopia or Bust: A Guide to the Present Crisis
by Benjamin Kunkel
Published 11 Mar 2014

After listing several of the more spectacular property-market collapses of the long downturn (worldwide in 1973–75; Japanese in 1990; Thai and Indonesian in 1997), Harvey added that the most important prop to the US and British economies after the onset of general recession in all other sectors from mid-2001 onwards was the continued speculative vigor in the property and housing markets and construction. In a curious backwash effect, we find that some 20 percent of GDP growth in the United States in 2002 was attributable to consumers refinancing their mortgage debt on the inflated values of their housing and using the extra money they gained for immediate consumption (in effect, mopping up overaccumulating capital in the primary circuit). British consumers borrowed $19 billion in the third quarter of 2002 alone against the value of their mortgages to finance consumption.

pages: 598 words: 140,612

Triumph of the City: How Our Greatest Invention Makes Us Richer, Smarter, Greener, Healthier, and Happier
by Edward L. Glaeser
Published 1 Jan 2011

The two cities have both relied upon rigorous management to rise above the squalor and corruption that typify so many cities in the developing world. When Botswana became independent from Great Britain in 1966, it was one of the poorest places on earth. Over the next thirty-five years, it may have experienced the second-fastest GDP growth of any country, and it is now one of the two or three most prosperous nations in sub-Saharan Africa. Gaborone was founded in 1965, but it now has around two hundred thousand people, about a tenth of the country’s population. Botswana’s success rests on good governance and natural resources. The country’s first president, Seretse Khama, who led the country for fourteen years, was a traditional tribal chief and an Oxford-trained lawyer.

.; population in 1965 from Maddison, “Statistics on World Population.” 228 incomes in Singapore were about one fifth: Maddison, “Statistics on World Population.” 228 more than 8 percent growth per year, among the highest: Author’s caculations using Maddison, “Statistics on World Population.” 228 Singapore was a poor shantytown: Yew, From Third World to First, 120. 228 one of the highest per capita gross domestic products: Maddison, “Statistics on World Population.” 228 more than $70 just to enter the casino: “The Dragon’s Gambling Den,” Economist, July 10, 2010. 228 average adult in Singapore had only three years of schooling: Barro and Lee, “Educational Attainment.” 229 Singapore’s thirteen-year-olds led the world: Boston College, “Highlights of Results from TIMSS.” 229 A large literature now documents the perverse tendency of natural resource windfalls: Frankel, “The Natural Resource Curse: A Survey.” 229 high salaries and even higher penalties for malfeasance: Yew, From Third World to First, 182-98. 229 world’s best logistics for trade and transport: United Nations Industrial Development Organization, Industrial Development Report 2009, p. 69; and World Bank, Connecting to Compete, 26. 230 Until recently, it had to import . . . recycling the wastewater: “Singapore’s Deep Tunnel Sewerage System Wins Global Water Awards 2009,” Marketwire, Apr. 28, 2009. 230 adopted congestion pricing in 1975: Goh, “Congestion Management.” 230 Commute times run around thirty-five minutes: Payscale.com, www.payscale.com/research/SG/Country=Singapore/Commute_Time. 230 forty-two of its buildings rise above 490 feet: Emporis.com: Singapore high-rises—www.emporis.com/en/wm/ci/bu/sk/li/?id=100422&bt=5&ht=2&sro=0; London high-rises—www.emporis.com/en/wm/ci/bu/sk/li/?id=100637&bt=5&ht=2&sro=0; and Paris high-rises—www.emporis.com/en/wm/ci/bu/sk/li/?id=100603&bt=5&ht=2&sro=0. 231 second-fastest GDP growth of any country: Maddison, “Statistics on World Population.” 231 one of the two or three most prosperous nations in sub-Saharan Africa: Ibid. 231 Gaborone was founded in 1965 . . . a tenth of the country’s population: Botswana, “Stats Update Dec. 2009.” 231 Botswana’s success rests on . . . physical and human capital: “Khama, Sir Seretse,” Encyclopædia Britannica. 231 average years of schooling in Botswana: Barro and Lee, “Educational Attainment.” 231 Gaborone’s growth has paralleled Botswana’s: They do census on the “1” year, so it’s 1971-2001.

pages: 441 words: 136,954

That Used to Be Us
by Thomas L. Friedman and Michael Mandelbaum
Published 1 Sep 2011

The United States is not Singapore, and it is certainly not about to adopt the more authoritarian features of Singapore’s political system. Nor, like Singapore, are we likely to link the pay of high-level bureaucrats and cabinet ministers to the top private-sector wages (all top government officials in Singapore make more than $1 million a year) or give them annual bonuses tied to the country’s annual GDP growth rate. But we do have something to learn from the seriousness and creativity the Singaporeans bring to elementary education and economic development, and from their attention to the requirements for success in the post–Cold War world. Carlson told us he once met with a senior Singaporean economic minister whom he complimented on the country’s educational and economic achievements.

But we do favor hand-ups—ways in which every local and state government and the federal government can give a hand up to entrepreneurs who want to start new businesses in America and manufacture here—and then let the market sort the businesses out. Just assuming that a rising economic tide alone will bring in more blue-collar jobs—as we are doing now—is not a smart strategy. It is not a strategy at all. “While a robust economic recovery is a foundation for job growth, a cyclical rebound in GDP growth alone is unlikely to put enough Americans back to work,” McKinsey & Company analysts observed in a June 2011 study entitled An Economy That Works: Job Creation and America’s Future. “Job creation must become a national priority, not a by-product of other policy decisions.” McKinsey’s report concludes that a job-creation strategy has to include a variety of initiatives, which echoed what we heard from policymakers and entrepreneurs: addressing the growing mismatch between the needs of employers and the skills American workers get in school and in the job market; finding ways to make globalization a better source of job creation in the United States; stimulating innovation and new company start-ups; and simplifying regulatory procedures that create obstacles to job creation.

pages: 651 words: 135,818

China into Africa: trade, aid, and influence
by Robert I. Rotberg
Published 15 Nov 2008

Gabon Mozambique Rwanda Uganda Mali Botswana Cape Verde Tanzania 34 Sierra Leone Growth 4.5 percent or higher percent Ethiopia Mauritania Mauritius Ghana Benin Burkina Faso Senegal Cameroon Gambia, The Namibia Zambia Guinea 19 Growth 3–4.5 percent Togo percent Niger Malawi South Africa Madagascar São Tomé and Príncipe Lesotho Swaziland Eritrea Kenya Seychelles Comoros 20 Growth < 3 percent Côte d’Ivoire percent Central African Republic Guinea-Bissau Burundi Congo, Dem. Rep. Zimbabwe 0 5 10 15 20 Average GDP growth rate 1996–2005 Source: Broadman, Africa’s Silk Road. 05-7561-4 ch5.qxd 9/16/08 4:13 PM Page 94 94 harry g. broadman Figure 5-3. Decline in Africa’s Share of World Exports, 1948–2004 Percent 7 6 5 4 3 2 1 1948 1953 1963 1973 1983 1993 2004 Source: Broadman, Africa’s Silk Road.

In the meantime, China is working hard to obtain access for its maritime forces in key nations along these sea lanes. If China has embarked on or plans to build a blue-water navy, the reasons for it are clear. The Chinese economy has been growing at an extraordinary rate. To stay in power, the current leadership of the Communist Party must continue this high annual GDP growth rate. The ability of the Chinese economy to sustain a high growth rate is dependent on the importation of large quantities of raw materials, especially oil. In 2003, China became the world’s second-largest consumer and third-largest (after the United States and Japan) importer of oil. While oil and gas account for only about 20 percent of China’s energy requirement (coal, most of it available locally, provides the preponderance of China’s energy needs), the importance of gas and oil to the economy is growing each year.

pages: 537 words: 144,318

The Invisible Hands: Top Hedge Fund Traders on Bubbles, Crashes, and Real Money
by Steven Drobny
Published 18 Mar 2010

Before 2000, metals demand in the developed economies was roughly equivalent to that in the emerging economies, whereas after 2000, emerging markets demand for metals grew at 8 percent, while developed world demand was flat. As you can see, the Asian influence is very important. Emerging markets now contribute more to nominal GDP growth globally than developed markets. This is a pivotal structural transition, and China’s entry into the WTO in the fall of 2001 was the big structural change that coincided with the beginning of the bottoming of the tech-led recession. There was an incredible inflection point where commodity-producing nations went from running current account deficits to current account surpluses.

Does the emergence of China and commodity hoarding lead to higher inflation globally? The rise of China and emerging markets really matters with respect to inflation. Commodity price inflation is now being achieved at a much lower level of global output than what we witnessed over the past 50 years, showing up at 2.3 percent of global GDP growth, compared to over 4 percent in prior cycles. Much of that has to do with the rise of emerging markets, but the greater concern now is that cash flow and capital expenditure have been collapsing as well. In the past year, we have seen $250 billion in cancellations or delays in metals and mining spend, which is equivalent to 25 percent of forward copper capacity.

pages: 518 words: 128,324

Destined for War: America, China, and Thucydides's Trap
by Graham Allison
Published 29 May 2017

Meanwhile, India’s GDP was $1.8 trillion in 2012, $1.9 trillion in 2013, and $2 trillion in 2014. GDP data (current prices, US dollars) are from the International Monetary Fund’s “World Economic Outlook Database,” October 2016, http://www.imf.org/external/pubs/ft/weo/2016/02/weodata/index.aspx. [back] 6. Calculated based on historical GDP growth figures of the Angus Maddison Project. See “GDP Levels in Western Offshoots, 1500–1899,” in Angus Maddison, The World Economy: Historical Statistics (Paris: OECD Publishing, 2006), 462–63. [back] 7. There are various examples of this productivity gap. The British became sixty-six times more productive in making yarn by using the Hargreaves jenny draw bar, a key innovation of the era that the Chinese failed to adopt.

International Institute for Strategic Studies, The Military Balance 2016 (New York: Routledge, 2016), 495. [back] 23. The word “cloud” was generated on the Factiva database, using all headlines from the New York Times, Wall Street Journal, and Financial Times from October 25, 2013, through October 25, 2016, featuring the words “China” and “growth,” or “GDP,” or “economy.” [back] 24. GDP growth data are from the IMF. The period since the Great Recession is defined as 2010–2016. 2016 figures are IMF estimates from the fund’s October 2016 update to the World Economic Database. [back] 25. The percentage of world growth occurring in China is calculated using “GDP, PPP (Constant 2011 International $),” from the World Bank’s World Development Indicators.

pages: 497 words: 143,175

Pivotal Decade: How the United States Traded Factories for Finance in the Seventies
by Judith Stein
Published 30 Apr 2010

In 1952, after twenty years of Democratic power, the GOP won the presidency. President Dwight D. Eisenhower and his cabinet of gray businessmen did not repeal the New Deal. It is probably true that in the recessions of 1954, 1958, and 1960 the government was more passive than a Democratic administration would have been. GDP growth from 1955 through 1961 was a puny 2.3 percent. Still, Eisenhower tolerated budget deficits during the recessions, establishing Keynesianism as a bipartisan policy. He expanded Social Security and public housing programs, continued to subsidize farmers, and accepted labor unions. Ike’s philosophy lacked a bible, but he called it “modern Republicanism.”

Less tolerant of the charade, a California electronics maker wondered if the United States was on the road to becoming a “banana republic: If we think we are trying to balance our trade imbalance with the Japanese by selling them beef and grapefruit, we’ll end up killing our industrial base.”52 Carter was on the defensive. The standard reason for the trade deficit—greater American GDP growth—could not explain the Japanese surplus because the Japanese growth rate now exceeded the American.53 Although oil imports were a factor in the U.S. trade deficit, in 1978 they fell, largely because of the availability of Alaskan oil and efforts in energy conservation. The deficit in manufacturing increased, and with it the U.S. trade deficit rose to $33.9 billion.54 The skeptics were right.

pages: 483 words: 134,377

The Tyranny of Experts: Economists, Dictators, and the Forgotten Rights of the Poor
by William Easterly
Published 4 Mar 2014

The bias toward development as a self-contained thing on national territory also shows the inability to think about the role of nonnational or transnational forces or groups, such as the Mourides, in economic development. The next chapter considers more evidence that national forces alone are not as important as usually believed. CHAPTER TEN HOW MUCH DO NATIONS MATTER? If there is one number to which the rights of millions will be happily sacrificed, it is the national GDP growth rate. National leaders believe national growth takes place as the result of national actions. These leaders take great pride in rapid national growth, as do their expert advisers who think their advice is paying off. The unofficial line for a “growth miracle” seems to be annual growth of income per capita of 6 percent.

Fifteen African countries had never given the UN any data on inflation-corrected GDP.5 The data for economic growth in those fifteen countries do not even exist. To come up with numbers anyway, the United Nations was doing something between making educated guesses on the numbers and simply making them up. The second clue for measurement-error detectives is that different sources come up with different numbers for the same GDP growth rate by year and country. This is the same embarrassing problem pointed out with child-mortality statistics in Ethiopia just as Bill Gates was celebrating precise measurement to guide health policy. National policy makers using growth to guide policy also have bad numbers for this guidance. The standard source for growth data is the World Bank’s World Development Indicators (WDI).

pages: 418 words: 128,965

The Master Switch: The Rise and Fall of Information Empires
by Tim Wu
Published 2 Nov 2010

There were plenty: since the breakup, scores of new “competitive” phone and Internet companies had launched, hoping to take a piece of the Bells’ billions in revenue for themselves. In part they were drawn by the more general tech boom and economic expansion of the 1990s, when it was easy to get funding. But the real rush began in 1996, after which telecommunications would account for an unprecedented share of GDP growth. Each of the Bells did its bit to eliminate local challengers. Verizon, for its part, handled competitors in the Northeast, and managed to finally silence MCI, Bell’s bête noire, forever. But the undisputed heavyweight champion was Ed Whitacre’s Southwestern Bell, now renamed SBC. As Network World reported as early as 1997, “SBC, more than any other [Bell Company], uses a phalanx of lawyers and millions of dollars in lobbying efforts in a deliberate effort to thwart meaningful competition in its markets.”10 From the late 1990s into the following decade, SBC masterfully waged a war of attrition.

As a consequence, inventions from magnetic recording and electronic television to packet networking and fiber optics, developments feasible long before the moment with which they are associated, were squelched. The consequences of such action for economic growth and further innovation are incalculable: imagine trying to determine the effect on GDP growth if the broad rollout of email had been delayed for ten years to suit one company. This brings me to the inadequacy of traditional efficiency calculations in regulating information industries. As we have observed, it has been the habit of the Justice Department to identify failures of competition by their effect on prices.

pages: 561 words: 138,158

Shutdown: How COVID Shook the World's Economy
by Adam Tooze
Published 15 Nov 2021

The economy is an abstraction, a real abstraction perhaps, but an abstraction, a set of ideas, concepts, and statistics that aggregate actual people and things, real networks of production and reproduction.43 Normally numbers like GDP adequately capture that totality, but they create a delusive sense of separation. They make it seem meaningful to “trade off” GDP growth against other social imperatives. A virus exposes the illusion of imagining that there is a thing called the economy that is separate from society. It was through the bodies of workers, through the air circulating in workplaces, that the virus was rapidly multiplying. This is not to say that everything is equally connected.

It is this particular quality of the emergency that helps to explain the huge scale of the American program. The CARES Act had to be so big because America’s social fabric is built on work and employment. Its welfare system by contrast is fragile, worn thin by years of attacks on the public sector. As the journalist Eric Levitz forcefully put it: Steady GDP growth is the duct tape holding together this jerry-rigged social order in which low-income Americans have little to no emergency savings, many basic welfare benefits are contingent on employment, and the threadbare safety net is patchy by design. This top-heavy, gold-plated jalopy of a political economy can pass as road safe in fair weather; try to ride it through a once-in-a-century epidemiological storm and it starts to break apart.22 A society with a patchy and minimalist system of unemployment insurance, in which millions live paycheck to paycheck without the protection of paid sick leave, in which tens of millions of children rely on schools for food, cannot easily shut down.

pages: 162 words: 51,473

The Accidental Theorist: And Other Dispatches From the Dismal Science
by Paul Krugman
Published 18 Feb 2010

To be sure, many businessmen claim that the numbers are wrong (although there are some independent reasons to suspect that productivity growth remains fairly pedestrian). But in any case such claims don’t help the pro-growth argument. The reason is that the same numbers are used to estimate productivity growth and GDP growth. If you think that productivity is really growing at 3 percent, not the 1 percent the BEA reports, then you must also believe that GDP is really growing at 4 percent, not 2—in other words, the Fed is already giving us 4 percent growth, so what’s your problem? (By the way, I am told on unreliable hearsay that economists at the Fed have tried to explain this point to prominent four-percenters, and met a blank wall of incomprehension).

pages: 172 words: 49,890

The Dhandho Investor: The Low-Risk Value Method to High Returns
by Mohnish Pabrai
Published 17 May 2009

With Frontline, for about seven or eight weeks, the rates stayed at under $10,000 a day and then spiked to $80,000 a day in fourth quarter 2002. The worldwide fleet of VLCCs in 2002 was about 400 ships. Over the past several decades, worldwide oil consumption has increased by 2 percent to 4 percent on average annually. This 2 percent to 4 percent is generally tied to GDP growth. Usually there are 10 to 12 new ships added each year to absorb this added demand. When scrapping increases beyond normal levels, the fleet is no longer increasing by 2 percent to 4 percent. When the demand for oil rises, there just aren’t enough ships. The only thing that’s adjustable is the price, which skyrockets.

pages: 140 words: 91,067

Money, Real Quick: The Story of M-PESA
by Tonny K. Omwansa , Nicholas P. Sullivan and The Guardian
Published 28 Feb 2012

VISION 2030 AND FINANCIAL INCLUSION Kenya’s development blueprint, Vision 2030 (published in 2008), seeks to elevate the country from a low- to medium-income country by 2030, emulating the path of Asian tigers such as Malaysia and South Korea. It’s certainly an ambitious goal for a country without vast natural resources beyond its wildlife, and presumes 25 years averaging 10% GDP growth! Only a few countries in world history have accomplished that, and they are all small and resource rich— Equatorial Guinea (1985-2004, 12% growth), Botswana (1966-1991, 13.1% growth) and Oman (1961-1986, 13.4% growth). China (9.9%), Singapore (9.5%) and Hong Kong (9.1%)—the latter two small islands (and thus outliers)—effectively hit 10% growth as well for a 25-year period.

pages: 174 words: 52,064

Operation Lighthouse: Reflections on Our Family's Devastating Story of Coercive Control and Domestic Homicide
by Luke Hart and Ryan Hart
Published 15 Jul 2018

It could be argued that religiously motivated terrorism is but a subset of the consistent thread which runs through all terrorism – gender violence. Often after a terrorist event is committed, a history of domestic abuse is unearthed. In fact, studies of mass shootings in the United States from 2009-2016 have shown that 54% of cases were related to domestic or family violence. (2) The total yearly economic cost to the UK (through impact on GDP growth, criminal justice system, physical costs of homicides, injuries and property damage, and wider psychological effects) from domestic abuse is almost ten times that of conventional terrorism (£20bn (3) compared to £3.2bn (4)). The allocation of resources amassed to tackle these issues is grossly distorted under the promise of addressing religious fundamentalism as opposed to true problem: gender fundamentalism.

pages: 828 words: 232,188

Political Order and Political Decay: From the Industrial Revolution to the Globalization of Democracy
by Francis Fukuyama
Published 29 Sep 2014

During the cold war, the two countries were frequently compared because Kenya had adopted what Joel Barkan labeled “patron-client capitalism,” while Tanzania adopted “one-party socialism.”18 For the first two decades after gaining independence in 1963, Kenya grew substantially faster than Tanzania, arguably demonstrating the superiority of market-based economics (see Table 4). TABLE 4. GDP Growth Rates, 1965–1990 But then, beginning in the late 1980s, the countries reversed positions, with Kenya suffering a precipitous economic decline relative to Tanzania (see Figure 16). More recently, Tanzania has shared in sub-Saharan Africa’s overall strong growth with rates of around 6 percent in the period 1999–2011. Kenya by contrast has been racked, particularly since the presidential election of 2007, by violence among its ethnic groups. GDP growth has been lower and much more volatile during the 2000s, reflecting ongoing political conflict.

GDP growth has been lower and much more volatile during the 2000s, reflecting ongoing political conflict. Tanzania has remained much more stable. The reasons for this can be traced ultimately back to the fact that Tanzania’s one-party dictatorship engaged in a policy of nation building, while Kenya’s more liberal state did not. FIGURE 16. GDP Growth Rates, 1989–2011 SOURCE: World Bank Tanzania had certain preexisting advantages over Kenya in formulating a national identity. None of its 120 ethnic groups is large enough to potentially dominate the country, whereas Kenya has five major ones, constituting some 70 percent of the population.19 An alliance of any two of these larger groups—Kikuyu, Kalenjin, Luo, Kamba, Luhya—is often sufficient to gain control of the government.

pages: 829 words: 229,566

This Changes Everything: Capitalism vs. The Climate
by Naomi Klein
Published 15 Sep 2014

Only in the immediate aftermath of the great market crash of 1929 did the United States see emissions drop for several consecutive years by more than 10 percent annually, but that was the worst economic crisis of modern times.50 If we are to avoid that kind of carnage while meeting our science-based emissions targets, carbon reduction must be managed carefully through what Anderson and Bows-Larkin describe as “radical and immediate de-growth strategies in the US, EU and other wealthy nations.”II51 Now, I realize that this can all sound apocalyptic—as if reducing emissions requires economic crises that result in mass suffering. But that seems so only because we have an economic system that fetishizes GDP growth above all else, regardless of the human or ecological consequences, while failing to place value on those things that most of us cherish above all—a decent standard of living, a measure of future security, and our relationships with one another. So what Anderson and Bows-Larkin are really saying is that there is still time to avoid catastrophic warming, but not within the rules of capitalism as they are currently constructed.

It’s a challenge to some trade unions, those trying to freeze in place the dirtiest jobs, instead of fighting for the good clean jobs their members deserve. And it’s a challenge to the overwhelming majority of center-left Keynesians, who still define economic success in terms of traditional measures of GDP growth, regardless of whether that growth comes from rampant resource extraction. (This is all the more baffling because Keynes himself, like John Stuart Mill, advocated a transition to a post-growth economy.) It’s a challenge, too, to those parts of the left that equated socialism with the authoritarian rule of the Soviet Union and its satellites (though there was always a rich tradition, particularly among anarchists, that considered Stalin’s project an abomination of core social justice principles).

“Beijing’s Air Pollution at Dangerously High Levels,” Associated Press, January 16, 2014; Ma Yue, “Alarm System to Close Schools in Severe Smog,” Shanghai Daily, January 16, 2014; “Chinese Anger over Pollution Becomes Main Cause of Social Unrest,” Bloomberg, March 6, 2013, accessed January 29, 2014. 32. Bruce Einhorn, “Why China Is Suddenly Content with 7.5 Percent Growth,” Bloomberg Businessweek, March 5, 2012; “GDP Growth (Annual %),” World Development Indicators, World Bank, http://data.worldbank.org; James T. Areddy and Brian Spegele, “China Chases Renewable Energy as Coast Chokes on Air,” Wall Street Journal, December 6, 2013; Justin Guay, “The Chinese Coal Bubble,” Huffington Post, May 29, 2013; Katie Hunt, “China Faces Steep Climb to Exploit Its Shale Riches,” New York Times, September 30, 2013. 33.

pages: 196 words: 53,627

Let Them In: The Case for Open Borders
by Jason L. Riley
Published 14 May 2008

It’s worth noting that during the summer of 2006, while pols like Congressman King were selling economic protectionism to win votes, and cable news yakkers like Bill O’Reilly were doing the same to win ratings, the U.S. economy itself was humming along nicely. Since the Bush tax cuts three years earlier, annual GDP growth had averaged better than 3.6 percent. Consumer spending was also up, which is an indication of consumer confidence in the economy’s health. Exports were rising, the budget deficit was falling, inflation was low, and the slowdown predictions of the previous four years hadn’t come to fruition. In the past quarter century there had been only a half-dozen negative GDP quarters, and the last one in 2001 was mild and relatively short-lived.

End the Fed
by Ron Paul
Published 5 Feb 2011

Could this not be part of the explanation on why some people feel inequality; that they’re not doing as well in the economy? Wouldn’t this explain some of the concerns that we have? BEN BERNANKE: Congressman, that was of course a single quarter and there were a number of temporary factors that held down GDP growth in the first quarter including liquidation of the inventory overhang (which I mentioned before), a swing in our trade balance (a temporary swing), and a temporary decline in federal defense spending. All of those things have been reversing now, and so I think we will be seeing in the second quarter something closer to 3 percent growth.

Firefighting
by Ben S. Bernanke , Timothy F. Geithner and Henry M. Paulson, Jr.
Published 16 Apr 2019

Two-year historical loan-loss rates for commercial banks Sources: Federal Deposit Insurance Corp.; Federal Reserve Board; International Monetary Fund ANTECEDENTS The “Great Moderation”—two decades of more stable economic outcomes with shorter, shallower recessions and lower inflation—had added to complacency. Quarterly real GDP growth, percent change from preceding period Source: Bureau of Economic Analysis via Federal Reserve Economic Data (FRED) ANTECEDENTS Long-term interest rates had been falling for decades, reflecting decreasing inflation, an aging workforce, and a rise in global savings. Benchmark interest rates, monthly Sources: Federal Reserve Board and Freddie Mac Primary Mortgage Market Survey® via Federal Reserve Economic Data (FRED) ANTECEDENTS Home prices across the country had been rising rapidly for nearly a decade.

pages: 462 words: 150,129

The Rational Optimist: How Prosperity Evolves
by Matt Ridley
Published 17 May 2010

Then later, once most people are in the system, efficiency does start to bite and energy intensity starts to fall. This is happening in India today. The United States now uses one-half as much energy per unit of GDP as it did in 1950. The world is using 1.6 per cent less energy for each dollar of GDP growth every year. Surely now energy usage will eventually also start to fall? That is what I thought, until one day I tried to have an unnecessary conversation on a mobile telephone while a man was using a leaf-blower nearby. Even if everybody lags his loft and switches to compact fluorescent light bulbs, and throws out his patio heaters and gets his power from more efficient power stations, and loses his job in a steel plant but gets a new one in a call centre, the falling energy intensity of the economy will be offset by the new opportunities wealth brings to use energy in new ways.

Aid can save lives, reduce hunger, deliver a medicine, a mosquito net, a meal or a metalled road. But statistics, anecdotes and case histories all demonstrate that the one thing aid cannot reliably do is to start or accelerate economic growth. Aid to Africa doubled in the 1980s as a percentage of the continent’s GDP; growth simultaneously collapsed from 2 per cent to zero. The aid that Zambia has received since 1960, if invested instead in assets giving a reasonable rate of return, would by now have given Zambians the income per head of the Portuguese – $20,000 instead of $500. Although in the early 2000s some studies managed to find evidence that certain kinds of aid sometimes trigger growth in countries with specific economic policies, even these conclusions were later dashed by Raghuram Rajan and Arvind Subramanian of the International Monetary Fund in 2005.

pages: 475 words: 155,554

The Default Line: The Inside Story of People, Banks and Entire Nations on the Edge
by Faisal Islam
Published 28 Aug 2013

For Richard Werner, it is time for the Bank to quietly park that target and instead publicly embrace its quest for moderate inflation in a manner that Japan was very shy about. ‘The Bank needs to set a nominal GDP growth target,’ he says. A nominal GDP target incorporates a bit of inflation and a bit of growth in one target. In September 2012 the US Federal Reserve considered such a target, alongside a ‘price level’ target, that would basically allow for higher inflation in current circumstances. Vince Cable’s adviser Giles Wilkes suggested, before joining government, that for five years the Bank of England replaces its totemic 2 per cent inflation target with a ‘nominal GDP’ growth target of 6 per cent. The new governor of the Bank of England, Mark Carney, dabbled in versions of policies such as this in his previous job in Canada.

pages: 497 words: 144,283

Connectography: Mapping the Future of Global Civilization
by Parag Khanna
Published 18 Apr 2016

To this day, it is impossible to imagine America’s modern prosperity without it.*7 The same is true of China. Since the financial crisis, China’s economic stimulus has focused on infrastructure such as highways, housing, metros, and railways. According to Deutsche Bank, such fiscal stimulus has delivered twice the multiplier effect on GDP growth as has America’s monetary stimulus. While Western economists have criticized China for “over-investing,” the World Bank has found that high-speed rail connections to over a hundred Chinese cities have hugely benefited productivity by putting companies and workers much closer to their markets and customers.

Pric​ewater​house​Coop​ers and Oxford Economics projection of capital project and infrastructure spending. See http://www.​pwc.​com/​gx/​en/​capital-projects -infrastructure/​publications/​cpi-outlook/​assets/​cpi-outlook-to-2025.​pdf. Estimates of current annual infrastructure spending already range from $2 trillion to $3 trillion. According to McKinsey, just to keep the current pace of GDP growth will require $3.5 trillion per year in infrastructure spending; Bain & Company predicts $4 trillion per year by 2017. 6. The Dutch-Belgian border passes through people’s living rooms and public cafés in the town of Baarle-Nassau—or Baarle-Hertog depending on which side of the invisible line you happen to be standing on.

pages: 667 words: 149,811

Economic Dignity
by Gene Sperling
Published 14 Sep 2020

Yet a 4 percent growth rate is hardly an end goal for all economic policy if it is produced through mass exploitation of workers or delivers benefits to only the top one-tenth of 1 percent. This is not a theoretical exercise: consider Norway and Saudi Arabia. Both are relatively high-wealth nations with major oil reserves. Over the past few decades, both have had multiyear GDP growth rates of 4 percent or more.4 Yet the benefits of this strong GDP vary dramatically for each country’s citizens. Norway is famously egalitarian, its increased growth broadly shared. In Saudi Arabia, meanwhile, a royal family leads the government and owns the world’s biggest oil company, which dominates the country’s economy.5 Changes in GDP may reflect the fortunes of the royal family but reveal little about the standard of living for the typical Saudi Arabian, especially women, who lack the most basic freedoms.

Kennedy, Remarks at the University of Kansas, March 18, 1968,” JFK Library, accessed November 4, 2019, https://www.jfklibrary.org/learn/about-jfk/the-kennedy-family/robert-f-kennedy/robert-f-kennedy-speeches/remarks-at-the-university-of-kansas-march-18-1968. 3. “Robert F. Kennedy, Remarks at the University of Kansas, March 18, 1968.” 4. For example, Norway from 1994 through 1997, and Saudi Arabia from 2003 through 2005 and 2010 through 2012. “GDP Growth (Annual %),” World Bank Group, accessed November 4, 2019, https://data.worldbank.org/indicator/NY.GDP.MKTP.KD.ZG. 5. See, for instance, Ruth Umoh, “This Royal Family’s Wealth Could Be More than $1 Trillion,” CNBC, August 18, 2018, https://www.cnbc.com/2018/08/18/this-royal-familys-wealth-could-be-more-than-1-trillion.html; and Heba Kanso, “Saudi Women ‘Still Enslaved,’ Says Activist as Driving Ban Ends,” Thomson Reuters Foundation, June 22, 2018, https://www.reuters.com/article/us-saudi-women-driving/saudi-women-still-enslaved-says-activist-as-driving-ban-ends-idUSKBN1JI2XH. 6.

pages: 475 words: 156,046

When They Go Low, We Go High: Speeches That Shape the World – and Why We Need Them
by Philip Collins
Published 4 Oct 2017

When Khrushchev took power in 1953 the American economy was three times as large as its Soviet counterpart. Armed with specially computed statistics that drastically overstated the Soviet growth rate, Khrushchev declared that the Soviet economy would overtake America by 1970. The year the Berlin Wall came down, annual GDP growth in the USSR was −3 per cent. In the USA it was 1.9 per cent. By 1991 Soviet GDP per capita had still not reached the level that America had reached in 1945. When put to the test, in the laboratory conditions of a city divided by a wall into ideological segments, liberal democracy had triumphed over communism.

Eventually foreign reserves fell to a crisis level and India accepted help from the International Monetary Fund (IMF) and the World Bank in exchange for necessary liberalisation, which began in 1991 under the finance minister and later prime minister Dr Manmohan Singh. The medicine worked. Adjust the data for the fact that India’s liberal reforms began thirteen years after China’s and their respective GDP growth rates are close to identical. India’s GDP per capita all but doubled between 2007 and 2016, when India overtook China to be the fastest-growing economy in the world. It may well be the case that India’s democratic institutions, so often derided, not least within India itself, as a restraint on growth, are its greatest comparative advantage.

pages: 226 words: 59,080

Economics Rules: The Rights and Wrongs of the Dismal Science
by Dani Rodrik
Published 12 Oct 2015

Economists who are able to navigate from one explanatory framework to another as circumstances require are more likely to point us in the right direction. * Roger Gordon and Gordon B. Dahl report “broad consensus” among a panel of economists from leading academic departments on fairly specific questions, such as whether “the Fed’s new policies in 2011 will increase GDP growth by at least 1% in 2012.” They also find, appropriately, that there is greater agreement when the academic literature relevant to the question is large. Gordon and Dahl, “Views among Economists: Professional Consensus or Point-Counterpoint?” American Economic Review: Papers & Proceedings 103, no. 3 (2013): 629–35

pages: 935 words: 267,358

Capital in the Twenty-First Century
by Thomas Piketty
Published 10 Mar 2014

Furthermore, this “bargaining power” explanation is consistent with the fact that there is no statistically significant relationship between the decrease in top marginal tax rates and the rate of productivity growth in the developed countries since 1980. Concretely, the crucial fact is that the rate of per capita GDP growth has been almost exactly the same in all the rich countries since 1980. In contrast to what many people in Britain and the United States believe, the true figures on growth (as best one can judge from official national accounts data) show that Britain and the United States have not grown any more rapidly since 1980 than Germany, France, Japan, Denmark, or Sweden.39 In other words, the reduction of top marginal income tax rates and the rise of top incomes do not seem to have stimulated productivity (contrary to the predictions of supply-side theory) or at any rate did not stimulate productivity enough to be statistically detectable at the macro level.40 Considerable confusion exists around these issues because comparisons are often made over periods of just a few years (a procedure that can be used to justify virtually any conclusion).41 Or one forgets to correct for population growth (which is the primary reason for the structural difference in GDP growth between the United States and Europe).

In contrast to what many people in Britain and the United States believe, the true figures on growth (as best one can judge from official national accounts data) show that Britain and the United States have not grown any more rapidly since 1980 than Germany, France, Japan, Denmark, or Sweden.39 In other words, the reduction of top marginal income tax rates and the rise of top incomes do not seem to have stimulated productivity (contrary to the predictions of supply-side theory) or at any rate did not stimulate productivity enough to be statistically detectable at the macro level.40 Considerable confusion exists around these issues because comparisons are often made over periods of just a few years (a procedure that can be used to justify virtually any conclusion).41 Or one forgets to correct for population growth (which is the primary reason for the structural difference in GDP growth between the United States and Europe). Sometimes the level of per capita output (which has always been about 20 percent higher in the United States, in 1970–1980 as well as 2000–2010) is confused with the growth rate (which has been about the same on both continents over the past three decades).42 But the principal source of confusion is probably the catch-up phenomenon mentioned above.

These figures were retained in the new treaty signed in 2012, which added a further objective of maintaining a “structural” deficit of less than 0.5 percent of GDP (the structural deficit corrects for effects of the business cycle), along with automatic sanctions if these commitments were not respected. Note that all deficit figures in European treaties refer to the secondary deficit (interest on the debt is included in expenditures). 48. A deficit of 3 percent would allow a stable debt-to-GDP ratio of 60 percent if nominal GDP growth is 5 percent (e.g., 2 percent inflation and 3 percent real growth), in view of the formula β = s / g applied to the public debt. But the argument is not very convincing (in particular, there is no real justification for such a nominal growth rate). See the online technical appendix. 49. In the United States, the Supreme Court blocked several attempts to levy a federal income tax in the late nineteenth and early twentieth centuries and then blocked minimum wage legislation in the 1930s, while finding that slavery and, later, racial discrimination were perfectly compatible with basic constitutional rights for nearly two centuries.

pages: 251 words: 63,630

The End of Cheap China: Economic and Cultural Trends That Will Disrupt the World
by Shaun Rein
Published 27 Mar 2012

Local governments in factory-laden municipalities have been lobbying the central government alongside factory owners against a fast-appreciating renminbi. Shuttering factories would hurt these regions’ tax revenue, cause massive unemployment, and potentially spur destabilizing labor unrest. There is a more important and much more personal reason local officials are equally anxious: namely, that GDP growth is one of the major criteria upon which they are judged to determine future promotion potential. On the other hand, other factions and constituencies are lobbying for an appreciation of the renminbi. Energy companies that have to buy oil priced in U.S. dollars on the open market, for instance, would benefit.

Global Financial Crisis
by Noah Berlatsky
Published 19 Feb 2010

Joshua Kurlantzick of the Carnegie Endowment for International Peace’s China program writes in the New Republic that so far China has kept the labor protests separate from one another, preventing them from developing a common theme or a common leader. “But if China’s downturn turns into an outright recession, the country could face its first serious threat to the regime,” he warns. According to the International Monetary Fund’s (IMF) 2008 world economic outlook, China’s gross domestic product (GDP) growth is expected to fall from 11.9 percent in 2007 to 9.3 percent in 2009. Adam Segal, CFR senior fellow for China studies, says the Chinese government’s announcement of a $586 billion stimulus package in November 2008 shows how worried leaders are. “This is the first serious slowdown for China in thirty years,” he says, adding that the government knows that to maintain social stability, it must keep generating employment for those migrating from rural to urban areas.

pages: 247 words: 60,543

The Currency Cold War: Cash and Cryptography, Hash Rates and Hegemony
by David G. W. Birch
Published 14 Apr 2020

A Bank of England working paper on the topic says (among other things) that (Barrdear and Kumhof 2016): We find that CBDC issuance of 30% of GDP, against government bonds, could permanently raise GDP by as much as 3%, due to reductions in real interest rates, distortionary taxes, and monetary transaction costs. Countercyclical CBDC price or quantity rules, as a second monetary policy instrument, could substantially improve the central bank’s ability to stabilize the business cycle. GDP growth aside, there is another excellent reason to take this step: cash has no API. Writing for the Bank of England’s Bank Underground blog, Simon Scorer from the central bank’s digital currencies division made a number of very interesting points about our need for some form of digital fiat (Scorer 2017).

pages: 239 words: 62,311

The Next Factory of the World: How Chinese Investment Is Reshaping Africa
by Irene Yuan Sun
Published 16 Oct 2017

Even assuming that African nations will protect their workers better than previously industrializing countries did, industrialization practically guarantees that people will die, some in truly horrific ways. We are tempted to think that Africa should back away from the path of industrialization. Every human life is precious, with value that is incommensurate with the dollars and cents of business success and GDP growth. But that would be—dare I say it—a romanticized view from countries in which the clanging steel and ugly machine parts and the blood and guts of early-stage industrialization have already faded into a bygone era. For those who lived it, who experienced it, who have paid the ultimate price, the need to forge ahead, to build more factories in the ashes of destroyed ones, is obvious.

pages: 632 words: 171,827

Israel: A Concise History of a Nation Reborn
by Daniel Gordis
Published 17 Oct 2016

No Chance,” Guardian (February 21, 2002), http://www.theguardian.com/world/2002/feb/21/israel2 [Last viewed January 10, 2016]. 20Ross, Doomed to Succeed, p. 312. 21Interview between Rachel Greenspan and Yossi Klein Halevi, December 15, 2015. 22Benny Morris, “Exposing Abbas,” National Interest (May 19, 2011), http://nationalinterest.org/commentary/exposing-abbas-5335 [Last viewed December 9, 2015]. 23Gilbert, Israel: A History, p. 627. 24“Exchange of Letters Between PM Sharon and President Bush,” Ministry of Foreign Affairs of Israel website (April 14, 2004), http://www.mfa.gov.il/mfa/foreignpolicy/peace/mfadocuments/pages/exchange%20of%20letters%20sharon-bush%2014-apr-2004.aspx [Last viewed December 9, 2015]. 25Gilbert, Israel: A History, p. 637. 26Ibid., p. 638. 27Yagil Levy, The Hierarchy of Military Death, Open University of Israel (Lisbon, April 14–19, 2009), https://ecpr.eu/Filestore/PaperProposal/2cfd87af-cab2-4374-b84d-eb03fbbc3cd1.pdf.11. 28Dan Senor and Saul Singer, Start-Up Nation: The Story of Israel’s Economic Miracle (New York: Twelve, 2012), p. 15. 29The World Bank, “GDP Growth (annual %),” http://data.world bank.org/indicator/NY.GDP.MKTP.KD.ZG?page=1. 30Senor and Singer, Start-Up Nation, p. 11. 31Ibid., pp. 11, 13. 32Ibid., pp. 11–12. 33Ibid., p. 129. 34Ibid., p. 181. 35Ibid., p. 182. 36Manfred Gerstenfeld, The War of a Million Cuts: The Struggle Against the Delegitimization of Israel and the Jews, and the Growth of New Anti-Semitism (Jerusalem: JCPA, 2015), p. 250. 37Daniel Freedman, “The World’s Deadly Obsession with Israel,” Forbes (June 24, 2010), http://www.forbes.com/2010/06/23/israel-hamas-middle-east-opinions-columnists-daniel-freedman.html. 38Gerstenfeld, The War of a Million Cuts, pp. 13–14. 39Joshua Muravchik, “Muslims and Terror: The Real Story,” Commentary (February 1, 2015), https://www.commentarymagazine.com/articles/muslims-and-terror-the-real-story-1/ [Last viewed December 9, 2015]. 40“Human Rights Actions,” Human Rights Voices, http://www.humanrightsvoices.org/EYEontheUN/priorities/actions/body/?

An Uneasy Relationship: American Jewish Leadership and Israel, 1948–1957. Syracuse, NY: Syracuse University Press, 2005. Gavison, Ruth. “No ‘Israeliness’ instead of ‘Jewishness.’” Liberal Magazine, Vol. 15 (January 2015), http://theliberal.co.il/ruth-gavison -israeliness-instead-jewishness/ [Last viewed December 9, 2015]. “GDP Growth (annual %).” World Bank, http://data.worldbank.org/indicator/NY.GDP.MKTP.KD.ZG?page=1. Gerstenfeld, Manfred. The War of a Million Cuts: The Struggle Against the Delegitimization of Israel and the Jews, and the Growth of New Anti-Semitism. Jerusalem: JCPA, 2015. Gilad, Elon. “Why Is Israel Called Israel?”

pages: 580 words: 168,476

The Price of Inequality: How Today's Divided Society Endangers Our Future
by Joseph E. Stiglitz
Published 10 Jun 2012

What matters (for an individual’s sense of well-being, for instance) is not just an individual’s absolute income, but his income relative to that of others.48 The importance of relative income in developed countries is so great that it is a completely unsettled question among economists whether there is any long-run relationship between GDP growth and subjective well-being in those countries.49 Individuals’ concerns with their consumption relative to that of others—the problem of “keeping up with the Joneses”—helps explain why so many Americans live beyond their means—and why so many work so hard and so long. Many years ago Keynes posed a question.

They provide empirical evidence that increased income inequality is associated with “overspending,” reflected in, for instance, higher bankruptcy rates. See “Expenditure Cascades,” available at http://ssrn.com/abstract=1690612, Oct 12, 2010. 49. A survey of the evidence for both developed and developing countries is in Andrew E. Clark and Claudia Senik, “Will GDP Growth Increase Happinenss in Developing Countries?,” Paris School of Economics, Working Paper no. 2010-43, March 2011. 50. John Maynard Keynes, Economic Possibilities for Our Grandchildren: Essays in Persuasion (originally published 1930) (New York: Norton, 1963), pp. 358–73. The discussion here draws upon my reflections on that essay: “Toward a General Theory of Consumerism: Reflections on Keynes’ Economic Possibilities for Our Grandchildren,” in Revisiting Keynes: Economic Possibilities for Our Grandchildren, ed.

pages: 678 words: 160,676

The Upswing: How America Came Together a Century Ago and How We Can Do It Again
by Robert D. Putnam
Published 12 Oct 2020

B., 115–16, 200–201, 228, 244, 324, 337 Duca, John V., 100–101 DuPont, 25, 310, 325 Durkheim, Émile, 39, 293, 444n29 Dyer Anti-Lynching Bill (1919), 228 Dylan, Bob, 305 economic equality/inequality, 21–68 charitable donations by wealthy, 5, 142–43, 225 education and, 23, 28–32, 47–48 financial regulation and, 61–64 in the first Gilded Age (late 1800s), 2–4, 5, 8, 32–33, 37, 157 GDP growth per capita, 22–23 gender and, 254–65, 429n24, 429n27, 430–31nn40–42, 431n49, 431–32n56 government transfer payments and, 34, 35, 59–61 Great Convergence and, 38–39, see also Great Convergence (1913–70) Great Divergence and, 40–44, see also Great Divergence (mid-1970s–) health and, 25–28, 41–44 history of, 9–10, 11, 21–32 housing and, 23–24 income distribution and, 33–36, 39, 46–47, 52–53, 59, 63–64, 363n61 I-we-I curve(s), 33–38, 41–44, 47–48, 50, 51, 55–64, 67–68, 284–87, 294–96 marriage and, 153–54, 156–57 minimum wage and, 59, 62–64, 80, 286, 321, 369nn115–16 overlap with politics/political parties, 8, 79–80, 100–101 parenthood and, 156–57 race and, 32–33, 202, 210–14, 229, 240, 429n27, 431n49 religion and, 131–32 in the second Gilded Age (late 1900s), 37–38, 313 social norms and, 65–68 taxation and, 54–59 technological change and, 23, 28, 47–48 trade and, 45, 364n65 transportation and, 24–25 unions and, 49–54, 143–45 wealth distribution and, 36–38, 46–47, 53 see also social class education: Brown v.

Scott, 174 Follett, Mary Parker, 111 “foot off the gas” phenomenon: in education, 30, 32, 48, 210 gender and, 275, 281–82, 296 nature of, 15, 32, 203, 205, 240–42, 243, 281–82, 296, 411n15 in voting rights, 216–17 Ford, Gerald, 84 Fountainhead, The (Rand), 186–87 4-H, 116, 118, 121 Fox News, 101 franchises: civic organizations, 117–19, 322–23 corporate, 117 Franklin, Vincent P., 207 fraternal groups, 112, 114, 116, 117, 323 Freemasons, 115, 116, 121 Free Speech and Headlight (newspaper), 323–24 Frick, Henry Clay, 326 Friedan, Betty, 254–55, 256–57, 263, 278–79, 303 Friedman, Milton, 84, 186 Fukuyama, Francis, 188 Galbraith, John Kenneth, 302 Gates, Bill, 142–43 Gates, Henry Louis, Jr., 217–18 gay rights/homosexuality, 138, 141, 180, 192, 376n53 Gelfand, Michele, 164–65 gender equality/inequality, 245–82 abortion rights, 85, 94, 100, 279, 304, 376n53 changing attitudes toward, 262–63, 270–79, 433–35nn68–73 civic associations and, 114–15, 116, 121, 267–68, 323, 324 economics of gender equality, 254–65, 429n24, 429n27, 430–31nn40–42, 431n49, 431–32n56 education and, 31–32, 248, 249–54, 259, 279, 280, 319–20 Equal Rights Amendment (ERA), 78, 267–68, 278, 374n27 feminism/women’s movement, see feminism/women’s movement in the first Gilded Age (late 1800s), 2, 4, 7, 246–47 “foot off the gas” phenomenon and, 275, 281–82, 296 generational differences and, 262–63, 270–77 Great Migration and, 223 homosexuality/gay rights, 138, 141, 180, 192, 376n53 income equality/inequality and, 256–60, 263, 264–65, 431n49, 431–32n56 I-we-I curve, 13–16, 281–82 labor force participation, 246–48, 250–65, 268, 429n24 lesbian rights, 279 long-term trends, 13–16, 247–49, 270–77, 280–81 marriage and, 246, 252, 254–57, 259–60, 262–65 #MeToo movement, 277, 328 mid-20th century, 11, 14–16, 178 motherhood and domesticity, 246, 252, 254–57, 259–60, 262–65, 276–77, 282 occupational segregation, 260–63, 430–31nn40–42 political parties and, 78, 94, 268, 269–70, 278, 320–21 Progressive Era (1900–1915), 247–48, 267–68, 319–21 public office and, 89, 269–70, 278 racial equality/inequality and, 247, 259, 265, 271, 279–80, 281, 429n27, 431n49 sexual harassment, 264, 277, 278, 328 social class and, 246–47, 256–57, 259, 265, 267, 282, 320 Title IX, Education Amendments (1972), 82, 264–65, 279 unions and, 53, 115, 248 voting rights and, 2, 74–75, 114–15, 119, 120, 247–49, 266, 269–70, 324, 428n11 women’s groups, 114–15, 116, 121, 267–68, 323, 324 General Federation of Women’s Clubs, 115, 121 General Social Survey (GSS), 124 Generation Me (Campbell), 194 Generation X/Gen-Xers, 148, 273–76, 314 George, Henry, 326 Georgetown University, Center on Education and the Workforce, 259 GI Bill (1944), 31–32, 252, 357–58n22 Gilded Age: first, see first Gilded Age (late 1800s) second, see second Gilded Age (late 1900s) as term, 8, 17–18 Gini index, 195–96 Girls Clubs, 116 Girl Scouts, 116, 118–19, 121, 274 Gitlin, Todd, 189, 300, 309 Gladden, Washington, 327–28 Glendon, Mary Ann, 192 globalization, 296–98 impact of, 45–46 see also immigrants and immigration; international trade Goldin, Claudia, 38, 47, 48, 248, 252–53, 262, 280–81 Golding, William, 182, 308, 442n55 Goldwater, Barry, 81, 84, 85 Google, Ngram analysis, 169–70, 172–73, 175–76, 190–95, 197–98, 402–3nn18–23, 439n27 Gose, Leah, 333 Goss, Kristin A., 267–68 government regulation: “big government” as polarizing issue, 84–85 financial regulation, 61–62 in the first Gilded Age (late 1800s), 4–5 New Deal programs, see New Deal Progressive Era, 74–75 unions and, 50, 52 “Grand Expectations” (Patterson), 301 Grange, 116, 118, 120, 121 Grapes of Wrath (Steinbeck), 174 Great Compression, see Great Convergence (1913–70) Great Convergence (1913–70), 38–39, 299 educational innovation and, 47–48 financial regulation and, 61–62 gender equality/inequality and, 247–49, 281–82 Great Migration and, 219–25 income equality/inequality and, 35, 52–53, 211 international factors and, 45–46 minimum wage and, 62–64 New Deal programs and, see New Deal origins in the Progressive Era, 38–39, 46–48, 285–86, 288 of politics/political parties, 70–71, 76–84, 88, 90–91, 98, 102–3 public economic policy and, 54 racial equality/inequality and, 227–36 regional equality/inequality and, 44 social innovations and institutional reforms, 46, 54, 59–61, 65–66, 74–76 taxation and, 54–55, 56–59, 65 technological change and, 48 as term, 33, 358n26 timing of, 33, 281 unions and, 49–51, 53–54 wealth equality/inequality and, 37 Great Depression: causes of, 291 economic policies in, 173–75 education during, 250–51 financial regulation and, 61–62 GDP growth per capita, 22–23 political parties and, 76–77 social solidarity vs. isolation and, 119–21, 127, 134, 142, 156, 157, 295–96 unions and, 50, 51 see also New Deal Great Disruption, The (Fukuyama), 188 Great Divergence (mid-1970s–), 40–44 financial deregulation and, 62 “foot off the gas” phenomenon, see “foot off the gas” phenomenon health measures and, 41–44 income equality/inequality and, 35–36, 53 intergenerational economic mobility, 41, 42 international factors and, 45–46, 296–98 minimum wage and, 63–64 of politics/political parties, 6, 16–17, 84–108 public economic policy and, 54 racial equality/inequality and, 239–42, 243 regional equality/inequality and, 44 reversal of social innovations and institutional reforms, 46–47, 54, 55–61, 65–68 taxation and, 55–58, 61, 65 technological change and, 48 as term, 35 unions and, 51–54 Greatest, The (film), 306 Greatest (Silent) Generation, 66, 138, 147–48, 152, 160–61, 234–35, 252, 262–63, 272–73 Great Leveling, 39, see also Great Convergence (1913–70) Great Migration, 207, 213–14, 219–25, 229, 244, 419n77 Great Recession (2008–2009), 24, 61, 142, 214, 310 Great Society initiatives, 60, 82, 85, 102, 190, 233, 236–39, 300, 375n38 “Greed is Good” ethos, in first Gilded Age (late 1800s), 5 Greenfield, Patricia, 197 Greening of America, The (Reich), 305 Greenpeace, 123 Greenspan, Alan, 187 gun violence, 328 Guthrie, Woody, 305 Habits of the Heart (Bellah), 137 Hadassah, 118, 119, 121, 323 Halley, Janet, 264 Halpin, James, 168 Hamer, Fannie Lou, 232 Hanifan, L.

pages: 651 words: 162,060

The Climate Book: The Facts and the Solutions
by Greta Thunberg
Published 14 Feb 2023

. / 4.26 Degrowth Jason Hickel People tend to talk about the ecological crisis in terms of ‘the Anthropocene’, referring to the way that, for the first time in geological history, human activity is dramatically reshaping our planet and our climate. This terminology is useful in certain respects, but it is also incorrect. It is not humans as such that are causing the problem but rather a specific economic system – namely, capitalism – which is organized around and dependent on perpetual GDP growth. This might not be an issue if growth was just plucked out of thin air. But it is not. GDP is tightly coupled to energy and resource use, that is, all the material stuff the global economy extracts, produces and consumes each year. This is a problem, because as our economy grows and our energy use increases it becomes more difficult to decarbonize the energy system fast enough to keep global warming to less than 1.5 or 2°C.

See also individual organisation name Climeworks Orca, 216 Clinton, Bill, 26 clouds, 24, 51, 57, 58, 60–61, 74, 99, 172 coal, 7, 14, 23, 24, 27, 28, 29, 30, 49, 56, 57, 58, 92, 93, 156, 163, 164, 181, 211, 217, 219, 220, 221, 222, 223, 224, 225, 227, 260, 297, 306, 358, 393, 411, 426 Coca-Cola, 295, 297, 326 coffee, 248 cognitive dissonance, 338 colonialism, 162, 174, 175, 311, 313, 316, 364, 387–9, 398, 399–400, 410–11, 417, 418, 436 Concerned Scientists United, 338 Conference of the Parties, 93; COP1 (Berlin, 1995), 302; COP25 (Madrid, 2019), 378; COP26 (Glasgow, 2021), 93, 136, 158, 204, 212, 278, 340, 356; COP27 (Egypt, 2022), 93, 206 consumerism, 202, 218, 280, 281–9, 299, 331–6, 369, 377, 425–6 consumption-based emissions accounting, 257–8, 257, 258 consumption, circle of, 425–6 Coope, Russell, 14 Copenhagen Accord (2009), 28 Copernicus Atmosphere Monitoring Service, 98, 218 coral reefs, 7, 15, 33, 38, 51, 80, 84–5, 334, 335, 345, 346, 350 corporate engagement, 30 Covid-19 pandemic 21, 132–3, 136, 139, 141, 145, 149, 157, 159, 192, 217, 274, 355, 378–83, 393, 436 crabs, 350 crops, 52, 96; advent of agriculture and, 107; biological control agents, 110; cropland expansion, 100, 244–6, 246; cropland reallocations, 341–2, 343; cropland relocations, 109; deforestation and, 236; drought and, 172; fertilizer, 13, 32, 35, 111, 245, 246, 251, 252–4, 340, 341, 342, 343, 346, 414; food systems and, 253–5; loss/failure of, 165, 168, 172; pollination, 108, 110; rotations, 251; soil and, 340–41; yield, 149–50, 183, 245–6, 251, 253, 254, 343, 402 cryosphere, 37, 73, 114 culture wars, 326, 433 cycling, 135, 273, 274 cyclones, 67, 69, 70–71, 79, 397 D Dálvvadis, 173–4 Dakota Access Pipeline, 164 dams, 35, 89, 388 Danish Meteorological Institute, 49 Darity, William, 412 Darwin, Charles, 12 DDT, 111 decarbonization, 205, 258, 261, 264, 271, 275, 311, 315, 317, 381–2, 405–9 Deepwater Horizon oil spill (2010) 198–9, 201 defections, powerbrokers, 3, 65 democracy, 5, 42, 161, 164, 180–81, 213, 279, 325–6, 355, 356, 358, 371, 391, 392, 393, 394, 412–13, 424 dengue, 133, 143, 144, 145, 146 denial, climate-change, 2, 29, 202, 204–9, 207, 337, 338, 370, 372–4, 373, 383 dictatorship, 42, 180, 362, 364, 366, 400 Dieffenbach’s rail, 13 diets: changing, 11, 150, 239, 244–55, 246, 249, 250, 251, 340–33, 343; meat, 107, 112, 236, 248, 249–50, 249, 250, 253, 254, 282, 285, 288, 302, 356, 434; plant-based, 135, 236, 244, 247, 248, 249, 251, 327, 329, 335, 338, 342, 433; vegan, 281, 328, 329, 339, 360, 434; vegetarian, 324, 329, 435 direct-air capture (DAC), 238 disinformation campaigns, 27, 29, 30, 31 divestment, 30, 222, 412, 431 dogs, 9–10 drawdown technologies, 235–9 drought, 26, 38, 39, 65, 68, 74–5, 88, 96–7, 98, 99–100, 116, 124, 134, 165–8, 187, 189, 233, 299, 300, 399, 415 Durán, Alejandro, 299, 300 E East Siberian Arctic Seas (ESAS), 118, 121 e-bikes, 209 echinoderm, 84–5 ecocide, 431 Ecological Threat Register, Institute for Economics and Peace, 187 economics, 8, 29; capitalism, 13, 30–31, 162, 202, 310, 361–2, 390, 399; degrowth, 310–12; divestment, 30, 222, 412, 431; economic institutions, creating new, 376; equity and, 308–9; extractive economy, 163, 391; financial crisis (2008) 393; financial crisis, climate-related, 192–3; financialization of nature, 204; financial rescue packages, Covid-19, 217; GDP and see GDP; growth, 133, 148, 156, 183, 209, 240, 280, 310–12; incomes see income; laissez-faire policies, 30; market economics, 30–31, 200, 202, 255, 258, 284, 309, 324, 366, 412; market failure, climate change as, 30–31; socio-economic cost of climate change, 191–3; socio-economic trends since 1750 35; wealth inequality see wealth education, self- 324–7, 433 efficiency gains 251, 258, 259, 261, 264, 272, 288, 306, 311, 392 Ehrlich, Paul, 112 electricity generation, 30, 56, 88, 217, 227, 228, 257, 259, 261, 266, 268, 281, 309, 388, 434 electrification, 209, 271, 273n; electric vehicles (EVs), 28, 209, 221, 222–3, 226, 227, 268, 271–5, 283, 324, 333, 386; industrial processes, 260–61 elephants, 349, 350, 400 El Niño 38, 64, 100, 189, 190 El Salvador, 165–6, 168 End-Permian mass extinction, 7 energy democracy, 392, 394, 413 ENSO (El Niño-Southern Oscillation) 38 Environmental Defense Fund, US, 25 Environmental Protection Agency, US, 163, 211–12 epidemiological surveillance, 145 Equinor, 262 equity, 154; cars/personal mobility and, 274–5; colonialism and, 315; consumption-based emissions accounting approach and, 257; desire to look away from issues of, 218; geoengineering and, 233–4; Indigenous peoples and, 177; intergenerational, 172; material consumption levels and, 269; meaning of, 396–401; nationally determined contributions (NDC) and, 308–9; net zero by 2050 target and, 21, 304; Paris Agreement and, 308–9; school strike movement and, 355; taboo subject, 208–9; taxes and, 409; water system and, 89; wealth and see wealth.

pages: 235 words: 65,885

Peak Everything: Waking Up to the Century of Declines
by Richard Heinberg and James Howard (frw) Kunstler
Published 1 Sep 2007

Campbell, Joseph carbon dioxide emissions. see also greenhouse gas emissions carbon trading Carlowitz, Hanns Carl von cars Carter, Jimmy “Century of Self ” (Curtis) China CIA (Central Intelligence Agency) cities civilization (see also industrialization): basis of; development; and emergent phenomena, garbage from; v. wild societies climate Climate Change (see also psychology of peak oil/climate change; techno-collapse): after techno-collapse; benefits of cooperation with Peak Oil; from burning fossil fuels (see also greenhouse gas emissions); concerted campaign for; conflict with Peak Oil; consequences of; experts in; peak levels of; possible strategies for; psychological theories on; scientific agreement on; strategies for psychologically coping with Clinton, Bill coal: “clean,” future role; and greenhouse gases; production levels Cold War The Collapse of Complex Societies (Tainter) Colodzin, Benjamin community building computers conures Cornwall, England corporations Crane, Walter CTL (coal-to-liquids) Cuba’s Special Period culture, preservation of. see also arts, preservation of currency collapse Curtis, Adam D Damasio, Antonio democracy design: industrial; and industrialized society; in a techno-collapsed world developing countries Diamond, Jared Diamond, Stanley dignity E Earth Day economic inequality economics: after techno-collapse; free market; of future agriculture; and idea of steady growth- and industrial revolution education egalitarianism Ehrlich, Paul emergent phenomena energy. see also alternative energy sources; fossil fuels; non-renewable resources Energy and Equity (Illich) environmental damage (see also Climate Change): after techno-collapse; from agriculture; by invasive species; and language barrier environmental movement EROEI (energy returned on energy invested) ethanol Ewen, Stuart ExxonMobil F famine: in early history; prediction of feedback loops, reinforcing fish harvests food production (see also agriculture): after techno-collapse; as key to human society; and Malthus; in pre-history; and rationing; in US; and use of fossil fuels forests fossil fuels (see also coal; natural gas; oil; tar sands): and agriculture; and concentrations of greenhouse gases (see also greenhouse gas emissions); consequences of continuing use of; earliest technology run on; and feedback loops; future of; and hippie aesthetic- and industrial revolution; and level of happiness; modern problems connected to; and modern technology; predictions on how long they will last; scenarios of running out of; strategies for dealing with depletion of; substitutes for Fostering Sustainable Behavior (MacKenzie-Mohr and Smith) France Frank, Justin Freud, Sigmund G Gage, Phineas GDP (Gross Domestic Product) generation gap genetic engineering genetically modified crops Genuine Progress Indicator (GPI) Gini index Glendinning, Chellis global warming. see also Climate Change Gore, Al government: after techno-collapse; and beginnings of political organization; and democracy; environmental legislation; and language; reaction to disaster; reaction to Peak Oil; and sustainability measures GPI (Genuine Progress Indicator) grain Great Britain The Greatest Generation (Brokaw) greenhouse gas emissions: from coal; concentrations by source; from fossil fuels; how much they need to be reduced; peak levels; strategies for reducing Gross Domestic Product (GDP) growth v. sustainability H Haber-Bosch process Hansen, James happiness Harris, Marvin Hawkins, Louis W. Heather, Peter heavy oil Herman, Judith hippies Hirsch, Robert Holmgren, David Hopkins, Rob horticulture Hubbard, Elbert Hubbert, M. King Huebner, Jonathan human rights Human Scale (Sale) hydrocarbons. see fossil fuels I ideological changes: away from fossil fuels; away from industrialization; from perpetual growth to sustainability; role of language in Illich, Ivan An Inconvenient Truth (Gore) Indian Line Farm industrial design industrialization (see also fossil fuels; techno-collapse): adapted to disasters; and crafts; history of; how it’s changed humans; and industrial revolution; modern criticism of; plan for de-industrialization; as savior; weeding ourselves off inventions Iroquois Irving, Judy J Jackson, Wes Jeavons, John K Kelly, R.

pages: 267 words: 71,123

End This Depression Now!
by Paul Krugman
Published 30 Apr 2012

On the basis of previous trends, we should have expected the U.S. economy to grow around 9 percent over the four years from 2007 to 2011. In fact, it barely grew at all, as a steep slump from 2007 to 2009 was followed by a weak recovery that by 2011 had only just made up the lost ground. So even normal growth in federal spending would have produced a sharp rise in spending as a share of GDP, simply because GDP growth was far below its normal trend. That said, there was exceptionally rapid growth in federal spending from 2007 to 2011. But this didn’t represent a huge expansion of the government’s operations; the higher spending was overwhelmingly about emergency aid for Americans in need. Spending did rise faster than usual, but all of the difference was due to an expansion of safety-net programs in response to the economic emergency.

pages: 261 words: 64,977

Pity the Billionaire: The Unexpected Resurgence of the American Right
by Thomas Frank
Published 16 Aug 2011

The first metric had little to do with the economy as average people experienced it; the second metric is actually rigged against Roosevelt—Shlaes counts people who held temporary government jobs as having been unemployed. The author thereby makes a mystery of the enthusiasm for FDR felt by the millions of people who were saved by jobs with the WPA. As for the standard yardstick of economic well-being—GDP growth—Shlaes does not mention it at all. On the chance that anyone gives a damn about what actually happened in the thirties, here are the numbers. GDP shrank dramatically from 1929 to 1933, then abruptly reversed course in the year after Roosevelt took office. “Real GDP increased 11% in 1934, 9% in 1935, and 13% in 1936,” writes the economist Christina Romer—and those percentages, incidentally, dwarf the growth levels of the eighties, nineties, and zeroes.

pages: 219 words: 65,532

The Numbers Game: The Commonsense Guide to Understanding Numbers in the News,in Politics, and inLife
by Michael Blastland and Andrew Dilnot
Published 26 Dec 2008

So in order to measure economic growth, what do we put in our sample of businesses? Businesses that we already know about, what else? Oddly enough, this does not lead to an underestimate of growth, since the problem is known and understood. The figures are adjusted, with an estimate of growth in new areas. However, that estimate is usually too high, and initial reports of GDP growth in the United States are almost always revised down. In the UK, by contrast, this new growth is simply ignored until the tax returns come in to tell us what it was. So the initial UK GDP figures fail to count the one area of the economy that is plausibly growing fastest—the new firms with the new ideas, creating new markets.

The Data Journalism Handbook
by Jonathan Gray , Lucy Chambers and Liliana Bounegru
Published 9 May 2012

As Max Planck Institute professor Gerd Gigerenzer says, better tools will not lead to better journalism if they are not used with insight. Even if you lack any knowledge of math or stats, you can easily become a seasoned data-journalist by asking 3 very simple questions. 1. How was the data collected? Amazing GDP growth The easiest way to show off with spectacular data is to fabricate it. It sounds obvious, but data as commonly commented upon as GDP figures can very well be phony. Former British ambassador Craig Murray reports in his book, Murder in Samarkand, that growth rates in Uzbekistan are subject to intense negotiations between the local government and international bodies.

pages: 224 words: 69,494

Mobility: A New Urban Design and Transport Planning Philosophy for a Sustainable Future
by John Whitelegg
Published 1 Sep 2015

It is a source of deep regret that within the EU both national governments and EU-wide policies have fundamentally failed to understand these issues and have set us on a trajectory that will, as a result of an illogical commitment to mobility, multiply a large number of negative consequences including severe climate change. 7. Climate Change “Reducing global transport greenhouse gas (GHG) emissions will be challenging since the continuing growth in passenger and freight activity could outweigh all mitigation measures unless transport emissions can be strongly decoupled from GDP growth (high confidence).” (IPCC,2013) “Reducing [climate change] emissions from the on-road transportation sector is particularly attractive because this action yields both rapid and longer term climate benefits.” (Unger, 2010, page 3) The transport sector in the 27 member states of the European Union (EU27) is responsible for 25.5% of total CO2 emissions and these are expected to rise by 120% in the period 2000-2050 (UITP, 2009).

pages: 233 words: 66,446

Bitcoin: The Future of Money?
by Dominic Frisby
Published 1 Nov 2014

China has got its own difficulties with maintaining this high growth rate, which seems to be unsustainable, and other emerging markets are feeding off that. And so it’s hard to see how the case for global growth is a good one. When you look at fixed income markets, yields have not been this low in living memory. So there’s no return, there’s low nominal GDP growth, there’s no inflation. Put it all together it’s pretty hard to find some good investments. ‘The world is looking for something – for a new trick. I think that crypto may well be that thing.’ I ask him when he first started looking at Bitcoin? ‘Early 2013. I went to a conference to find out what was going on.

pages: 251 words: 69,245

The Haves and the Have-Nots: A Brief and Idiosyncratic History of Global Inequality
by Branko Milanovic
Published 15 Dec 2010

The same calculation is, of course, performed for each and every other country that participates in the International Comparison Project: When we say $PPP 1, we mean that a unit of such imaginary currency can buy the same basket of goods in India as in China as in France, Argentina, or Zambia. We shall use these PPP dollars a lot because they represent the only way we can compare the real income of nations. And once we have GDP per capita in PPP dollars “fixed” for a given year, we can then use countries’ GDP growth rates to “project” backward their GDPs per capita in PPP terms. This adds the second necessary dimension: comparisons over time. Here’s a small example that shows how this is done. Suppose that our 2005 comparison exercise tells us that the real U.S. per capita income is $PPP 40,000, and China’s income is $PPP 4,000 (approximately the actual numbers).

pages: 247 words: 68,918

The End of the Free Market: Who Wins the War Between States and Corporations?
by Ian Bremmer
Published 12 May 2010

Weaver (Boston: Allyn & Bacon, 1973), ch. 28. 2 George Will, “Capitalism Goes Out of Tune,” Washington Post, May 10, 2009, p. 2. 3 In fact, Schumpeter believed that capitalism would eventually give way to some form of socialism as economies fail to create enough jobs for those who want them and intellectuals seize on social discontent to create welfare states. 4 Roger Altman, “Globalization in Retreat,” Foreign Affairs, July- Aug. 2009. 5 World Bank press release, Feb. 12, 2009, http://web.worldbank.org/WBSITE/EXTERNAL/NEWS/0,,contentMDK:22067892~pagePK:64257043~piPK:437376~theSitePK:4607,00.html. 6 Tom Biracree, “IHS Herold/Harrison Lovegrove Study Finds 2008 Global Upstream Oil & Gas Transaction Value Fell 32%,” Source, IHS (Information Handling Services), http://press.ihs.com/article_display.cfm?article_id=4004. 7 From various reports by Albert Park, Cai Fang, and Du Yang for the World Bank’s China Quarterly Update. According to the bank, in the 1980s, each 1 percent of GDP growth in China led to a 0.3 percent rise in employment, whereas since 2000, each 1 percent of growth may have yielded on average only a 0.1 percent growth in jobs. “How High Is China’s Jobless Rate?” Economist, Nov. 27, 2008, http://www.economist.com/businessfinance/displayStory.cfm?story_id=12677296. 8 News Conference by the President, Apr. 29, 2009, http://www.whitehouse.gov/the_press_off ice/News-Conference-by-the-President- 4/29/2009. 9 http://travel.state.gov/visa/immigrants/types/types_4317.html.

pages: 212 words: 69,846

The Nation City: Why Mayors Are Now Running the World
by Rahm Emanuel
Published 25 Feb 2020

Cornett put that rise on steroids. In his first five years in office, the city added 72,000 jobs. It made it through the Great Recession just fine: During that time it had the second lowest rate of unemployment in the country for metropolitan areas of more than one million people, and it had one of the best rates of GDP growth among the country’s major metro areas. He helped push through what was known as MAPS for Kids, a $700 million program started under his predecessor designed to renovate and rebuild schools in the city. In 2009 he devised his own MAPS program, called MAPS 3, which focused on improving the quality of life in the city.

pages: 288 words: 64,771

The Captured Economy: How the Powerful Enrich Themselves, Slow Down Growth, and Increase Inequality
by Brink Lindsey
Published 12 Oct 2017

As the malaise persists, evidence is accumulating that the growth slowdown reflects deep structural problems that predate the crisis.3 Growth in real (i.e., inflation-adjusted) gross output per capita has averaged only 1 percent per year during the twenty-first century, half the average rate of growth over the course of the twentieth century.4 The combination of slowing growth and rising inequality has inflicted a double whammy on Americans’ economic prospects. The growth slowdown means that expected progress in living standards has evaporated; high inequality means that just looking at GDP growth understates the magnitude of popular economic discontent, as the gains of growth have shifted away from ordinary Americans to benefit a relatively narrow elite. The damage done by our economic malaise is not confined to the economic realm. The shocking election of Donald Trump—and the threat to liberal democratic norms and institutions that it entails—could only have happened in a country where confidence in the nation’s leaders and governing institutions had sunk to dangerously low levels.

pages: 233 words: 64,702

China's Disruptors: How Alibaba, Xiaomi, Tencent, and Other Companies Are Changing the Rules of Business
by Edward Tse
Published 13 Jul 2015

He moved to Hainan, China’s southernmost province and traditionally a place where disgraced officials were sent into exile as punishment. There, on a subtropical island 1,500 miles from Beijing’s grim political climate, Feng found himself in the middle of a spectacular property boom. As speculative money flooded in from across China, Hainan’s GDP growth rate leapt to an astonishing 42 percent in 1992, and Feng abandoned his official post to start a property firm (or, as he told me recently, “I decided to move outside of the system” ). Toward the end of the following year, finance officials reined in Hainan’s overheated economy, popping its property bubble and sending the island into a recession whose aftermath would linger well into the 2000s.

pages: 210 words: 65,833

This Is Not Normal: The Collapse of Liberal Britain
by William Davies
Published 28 Sep 2020

In those conversations, a powerful image emerged of a department that had been embattled for a long time. In an era in which national borders were viewed as an unwelcome check on the freedom of capital and (to a lesser extent) labour, and geographic mobility was regarded as a crucial factor in promoting productivity and GDP growth, the Home Office, with its obsession with ‘citizenship’ and security, was an irritant to the Treasury and the Department for Business, Innovation and Skills. There has been an ideological conflict in Whitehall for some time regarding the proper relationship between the state, markets and citizens, but it has been masked by the authority of a succession of prominent, ambitious chancellors pushing primarily economic visions of Britain’s place in the world.

pages: 593 words: 189,857

Stress Test: Reflections on Financial Crises
by Timothy F. Geithner
Published 11 May 2014

And in March 2013, the blunt across-the-board spending cuts of the so-called “sequester” took effect, chopping another half point off GDP. We didn’t quite repeat the 1937 mistakes to the extent that Europe did, so premature austerity didn’t kill our recovery; but insufficient stimulus definitely sapped its strength. The Economy Started Growing Again Remarkably Quickly Quarterly Real GDP Growth The overwhelming force of the policies we deployed in early 2009 turned an economy contracting at an annual rate of more than 8 percent into a growing economy within six months. Since the end of the Great Recession, the economy has expanded at an average annual rate of 2.4 percent, despite headwinds from the European financial crisis, state and local government cutbacks, and a more recent shift to austerity at the federal level.

Includes FDIC portion of $425 million termination fee from Bank of America, and proceeds from Citigroup TruPS provided in consideration for ring fence. 3 Chairman Bernanke pursue such aggressive monetary policy actions: A central objective of post-crisis monetary policy is to get the nominal interest rate below the nominal rate of GDP growth, which will help facilitate a softer deleveraging, or what the hedge fund manager Ray Dalio describes as a “beautiful deleveraging.” The Fed was able to deploy monetary policy that helped accomplish that objective. 4 resolution authority to allow the orderly wind-down of failing financial firms: Though it is a significant enhancement to our pre-crisis toolkit, the new statutory resolution authority will not make the system invulnerable to damaging runs and contagion.

pages: 662 words: 180,546

Never Let a Serious Crisis Go to Waste: How Neoliberalism Survived the Financial Meltdown
by Philip Mirowski
Published 24 Jun 2013

In general, you can write down a model that predicts just about anything.16 If you worked for a firm or the government, you were simply expected to produce predictions like clockwork, and with a straight face. The Federal Reserve Bank of Philadelphia regularly surveyed “professional” economic forecasters; not unexpectedly, their forecasts for GDP growth and the unemployment rate for the year 2008 tended to bunch together in November 2007: their mean predicted GDP growth of 2.5 percent and an unemployment rate of 4.9 percent, even though the financial collapse by then had already begun. If you had aspirations to be a public intellectual, then one could not write op-eds or appear on television or radio without being importuned to predict something or other.

pages: 603 words: 182,826

Owning the Earth: The Transforming History of Land Ownership
by Andro Linklater
Published 12 Nov 2013

To pay for this, U.S. personal taxes on income rose up to 75 percent and and on dividends up to 95 percent, in theory although in practice the top rate was about 60 percent. The heavily taxed and regulated economy grew at 3.7 percent a year from 1950 to 1973, and Wall Street returned an annual rate of 9.58 percent to investors during the same period. In Britain similar figures—GDP growth of 3.1 percent annually from 1964 to 1973, and stock market returns of about 8 percent from 1950 to 1970—prompted the respected Financial Times economist Samuel Brittan to describe this period as “a Golden Age, which achieved far higher growth than experienced during any sustained period before or since.”

.”: Story cited in Margaret Thatcher: Portrait of the Iron Lady by John Blundell (London: Algora, 2008), 41. It was a revealing admission: The Constitution of Liberty by Friederich Hayek (Chicago: University of Chicago Press, 1960). The heavily taxed and regulated economy grew: Economic growth 1950–70. U.S. GDP growth, “Historical trends 1950–92, and current uncertainties” by Ronald E. Kutscher. Monthly Labor Review Nov. 1993. Stock market returns, compound annual rates of return from S&P 500, figures from MoneyChimp. UK figures from “A backward glance: the reappraisal of the 1960s” lecture by Samuel Brittan to the Institute of Contemporary British history, April 1997.

pages: 932 words: 307,785

State of Emergency: The Way We Were
by Dominic Sandbrook
Published 29 Sep 2010

By 1960, this had slipped to less than 17 per cent, and, by 1970, barely 10 per cent, just half that of West Germany. In the league table of GDP growth, meanwhile, Britain fell from ninth in 1961 to thirteenth in 1966 and fifteenth in 1971, on its way to a miserable eighteenth in 1976. What was particularly striking was the gulf between Britain and the countries of Europe’s Common Market, which made rather a mockery of the government’s arrogant decision to stay out in the 1950s. By almost every measure, from investment and productivity to the rate of GDP growth per head and the growth of average real earnings, the Common Market countries were ahead.

The irony was that if Britain had joined the Common Market in the mid-1950s, as its European neighbours had hoped, then it would have done so as a military and economic superpower, still unquestionably Western Europe’s pre-eminent nation. But by 1970 no serious observer could pretend that Britain still set the standards for the rest of the Continent. In productivity growth, for example, it had fallen behind not only the astonishingly industrious West Germans but the supposedly lazy French and Italians, while its GDP growth rate was just half that of the five major EEC countries (France, West Germany, Italy, Belgium and the Netherlands). On top of that, while Britain’s share of world exports had collapsed from 26 per cent in 1950 to less than 11 per cent in 1970 and barely 10 per cent in 1980, West Germany’s share soared from 7 per cent in 1950 to 20 per cent in 1970 and 30 per cent by 1980.

pages: 280 words: 73,420

Crapshoot Investing: How Tech-Savvy Traders and Clueless Regulators Turned the Stock Market Into a Casino
by Jim McTague
Published 1 Mar 2011

The most optimistic economists, and there were not many of them, predicted a V-shaped economic rebound, meaning that economic activity would pick up as quickly as it had come down in 2007 and 2008 during the credit and housing crisis. In their view, the market rally reflected this outcome and thus was behaving rationally by bouncing back up like a super ball. The conventional view was a pessimistic one. This broad camp argued that the recovery would be U-shaped, with slow gross domestic product (GDP) growth and high unemployment into the early years of the next decade. In their view, the stock markets were prematurely optimistic, the result of wishful thinking as opposed to solid earnings. There were some suspicions among this gloomy tribe that banks and Wall Street firms had been bidding up the price of stocks by trading them back and forth among themselves.6 Such activity would generate higher returns for their substantial reserves of cash, which they were reluctant to lend, owing to economic conditions.

Technological Revolutions and Financial Capital: The Dynamics of Bubbles and Golden Ages
by Carlota Pérez
Published 1 Jan 2002

The deployment period can be a time of relatively stable and prosperous development based on a good match between technology and the institutional framework. Whereas structural unemployment is likely to be a feature of the installation period, high levels of employment may well be attained in many countries during ‘deployment’. This factor leads people to think of deployment as a ‘golden age’ or ‘belle époque’, even though measured GDP growth may actually have been higher in some countries during the frenzy phase of the installation period. However, in the maturity phase of the deployment period, diminishing returns set in for the (now) older and mature technologies. Arthritis may set in for some of the once vigorous new firms and activities.

pages: 278 words: 74,880

A World of Three Zeros: The New Economics of Zero Poverty, Zero Unemployment, and Zero Carbon Emissions
by Muhammad Yunus
Published 25 Sep 2017

Gross domestic product (GDP) measures the monetary value of all the finished goods and services produced within a country’s borders in a specific time period. GDP is carefully measured by government agencies and widely reported in the news media. It is often treated as a measurement of the success of a country’s economic system. Governments have even fallen as a result of perceived shortfalls in GDP growth. Yet human society is an integrated whole. It consists of much more than the economic activity measured by GDP. Its success or failure should be measured in a consolidated way, not purely on the basis of an aggregate of narrowly selected economic information about individual performance. GDP does not and cannot tell the whole story.

pages: 244 words: 76,192

Execution: The Discipline of Getting Things Done
by Larry Bossidy
Published 10 Nov 2009

In preparing our economic assumptions for this automotive product, we looked at four areas. First, we looked at the legislative situation, since the product has to do with emissions control in each major market. Where were regulations going to be tightened? Second, we looked at the macroeconomic environment or worldwide GDP growth. Third, we looked at the underlying environment for motor vehicles specifically in each geographical area. Fourth, we analyzed each major automotive market in the world—Europe, the Americas, and Asia—since each has different needs. Our product also affects fuel efficiency, so we looked at the requirements for that in each country of the major markets.

pages: 283 words: 73,093

Social Democratic America
by Lane Kenworthy
Published 3 Jan 2014

I display the data in log form in order to focus on the rate of growth. The straight line represents what the data would look like if the economic growth rate had been perfectly constant. The actual data points hug this line. In other words, despite occasional slowdowns and speedups, the rate of per capita GDP growth in the United States has essentially been constant for the past 120 years.21 We’ve gone from being a country with a relatively small government to one with a medium-size government, and in doing so we’ve suffered no slowdown in economic growth.22 Now let’s look at two big-government countries: Denmark and Sweden.

pages: 251 words: 76,128

Borrow: The American Way of Debt
by Louis Hyman
Published 24 Jan 2012

Even those who did not speculate enjoyed the rising home prices, cashing out all that excess home value through home equity loans and using the money to pay off their credit cards. By the summer of 2009, pundits and policy makers claimed that the worst of the crisis was over. The National Bureau of Economic Research, which determines when recessions begin and end, announced that since GDP growth had returned, the crisis was over. The stock market had regained a lot of lost ground. Unemployment growth had slowed. Housing prices, in many markets, were actually increasing. Superficially, AIG and the rest of the securitization institutions were functioning again. The hundreds of billions of dollars shot into the economy to prop up key financial institutions appeared to have worked.

pages: 300 words: 76,638

The War on Normal People: The Truth About America's Disappearing Jobs and Why Universal Basic Income Is Our Future
by Andrew Yang
Published 2 Apr 2018

This resulted in lower prices, higher efficiencies, and some new opportunities but also increased pressures on American workers who now had to compete with a global labor pool. Automation started out on farms earlier in the century with tractors and then migrated to factories in the 1970s. Manufacturing employment began to slip around 1978 as wage growth began to fall. Median wages used to go up in lockstep with productivity and GDP growth before diverging sharply in the 1970s. Since 1973, productivity has skyrocketed relative to the hourly compensation of the average wage earner: How workers are compensated and how their companies perform stopped being aligned over the same period. Even as corporate profitability has soared to record highs, workers are earning less.

pages: 280 words: 71,268

Measure What Matters: How Google, Bono, and the Gates Foundation Rock the World With OKRs
by John Doerr
Published 23 Apr 2018

And here’s what’s exciting: I think we’re just getting started. OKRs may be called a tool, or a protocol, or a process. But my image of choice is a launch pad, a point of liftoff for the next wave of entrepreneurs and intrapreneurs. My dream is to see Andy Grove’s brainchild transform every walk of life. I believe it can have a huge impact on GDP growth, health care outcomes, school success, government performance, business results, and social progress. We’re getting glimpses of that future through forward thinkers like Orly Friedman, who has introduced OKRs to every elementary schoolchild at the Khan Lab School in Mountain View, California. (Imagine you are five or six years old and setting your own goals for learning—your own objectives and key results!

pages: 280 words: 74,559

Fully Automated Luxury Communism
by Aaron Bastani
Published 10 Jun 2019

This central pillar of neoliberalism – sold as part of a broader set of policies during the Thatcher and Reagan years – was identified as necessary in dealing with issues of inflation which increasingly beset the economies of the Global North after the early 1970s. After that, the ideologues said, sustainable economic growth was only possible with low, controlled inflation, and central banks had to play a leading role in the new orthodoxy. Yet, as already discussed, average GDP growth has fallen in each decade since. It has become increasingly hard to argue that the purpose of low inflation is anything other than to advantage asset-holders and creditors over those with debts. In short, monetarism and low-inflation ideology is just one part of the rigged system that serves speculative capital and the wealthy at the expense of everything else.

pages: 269 words: 77,876

Brilliant, Crazy, Cocky: How the Top 1% of Entrepreneurs Profit From Global Chaos
by Sarah Lacy
Published 6 Jan 2011

The chal enge of Africa is the extreme fragmentation and diversity in language, quality of life, political systems, safety, corruption, and economic sophistication. Rwanda is considered a pre-transition economy in Africa—the most nascent with the lowest GDP per capita. But these economies —especial y Rwanda—have some of the highest swings in growth. From 1990–2000 Rwanda’s real GDP growth was a paltry .4 percent. From 2000 to 2008 it was 7.3 percent. In 2010, the World Bank named Rwanda the second-most-improved country in the last five years in terms of the ease of doing business; applauding the country’s substantial and systemic policy changes. Rwanda may be tiny, but if Kagame can move the educational system from French to English and continue to position the country as a clean, wel -lit place to do business, it could become an unexpected continental hub for multinationals and foreign investors like Israel, Dubai or Singapore.

pages: 269 words: 70,543

Tech Titans of China: How China's Tech Sector Is Challenging the World by Innovating Faster, Working Harder, and Going Global
by Rebecca Fannin
Published 2 Sep 2019

Meituan packs in more than 200 service and product categories. The app has racked up 400 million active buyers, 5.8 million merchants in 2,800 Chinese cities, 6.7 billion transactions, and 5 billion user reviews.22 The upside is clear. The consumer economy in China will account for about half of the country’s GDP growth by 2020;23 the e-commerce market will hit $1.8 trillion by 2022, up from $1.1 trillion in 2018.24 Meanwhile, the food services segment of the e-commerce market is growing by nearly 20 percent yearly and could top $1.15 billion by 2023.25 Never Made Money What these screens don’t divulge is that Meituan has been losing money since its inception.

pages: 247 words: 78,961

The Return of Marco Polo's World: War, Strategy, and American Interests in the Twenty-First Century
by Robert D. Kaplan
Published 6 Mar 2018

Take Africa, which has had years of steady economic growth thanks less to the development of a manufacturing sector and more to a rise in commodity prices. Commodity prices are now falling, along with Chinese infrastructure investment in Africa, as China itself experiences a dramatic decrease in GDP growth. Thus African stability, to the degree that it exists, is imperiled because of economic changes in Asia. Then there are the various radical Islamic movements rampaging across Sahelian Africa. This is actually the latest phase of African anarchy—in which the communications revolution brings millenarian Islam to weak and failed states.

pages: 600 words: 72,502

When More Is Not Better: Overcoming America's Obsession With Economic Efficiency
by Roger L. Martin
Published 28 Sep 2020

See, for example, Byard Duncan, “California’s Almond Harvest Has Created a Golden Opportunity for Bee Thieves,” Reveal, October 8, 2018. 16. Jim Donnelly, “The Irish Famine,” BBC History, February 17, 2011. Chapter 4 1. Aspen Publishers, Blue Chip Economic Indicators, December 10, 2008. 2. Kimberly Amadeo, “2008 GDP, Growth, and Updates by Quarter,” The Balance, June 25, 2019. 3. Congressional Budget Office, “Economic Effects of Reducing the Fiscal Restraint That Is Scheduled to Occur in 2013,” May 2012. 4. Tim Harford, “An Astonishing Record—of Complete Failure,” Financial Times, May 30, 2014. 5. John Berman, “Killer Whale: Ocean’s Best Hunter Learns to Kill on Land,” ABC News, February 4, 2010. 6.

pages: 223 words: 71,414

Abolish Silicon Valley: How to Liberate Technology From Capitalism
by Wendy Liu
Published 22 Mar 2020

And what guarantees do we have that the market will optimise for the right ends? The logic of the market is to encourage self-interest in the belief that the invisible hand will make everything right, on the grounds that economic activity is a good in itself. But the measurements we use for the health of the economy — GDP growth, unemployment rates, stock market capitalisations — are not themselves infused with ethical values, and it’s becoming increasingly clear that they are a poor proxy for tracking societal wellbeing. Purdue Pharma earning billions from selling the drugs that fuelled the US opioid crisis?9 That’s entirely reasonable by market logic.

pages: 823 words: 206,070

The Making of Global Capitalism
by Leo Panitch and Sam Gindin
Published 8 Oct 2012

The average annual real rate of growth of the American economy in the quarter-century after the resolution of the crisis of the 1970s (from 1983 to 2007) was 3.5 percent. This was higher than in any similar period from 1830 to 1950, and was only marginally less than during the so-called postwar “golden age”; and, unlike then, US GDP growth in the quarter-century after 1983 surpassed that of the other advanced capitalist countries.67 In the years from 1950 to 1973, US manufacturing productivity growth averaged 2.5 percent, well below that of the other advanced capitalist countries; between 1983 and 2007, it increased quite dramatically to 3.5 percent, running ahead of all the other G7 economies.

US consumption had accounted for over a third of the growth in global consumption between 2000 and 2007.63 Through 2007, global exports increased at more or less the same rate as in the period since 1994 (an average of 7.4 percent per year); then, in 2008, global export growth slowed to 3.4 percent; and in 2009 global exports decreased by an unprecedented 11.3 percent (the last decrease was in 1975, when, amid the twinned economic and energy crises, global exports fell by 2.9 percent). Given that world GDP growth, which had run at 3 percent annually from 2000 to 2007, also decreased in 2009 for the first time since World War II, a slowdown in trade was hardly surprising. But global trade (exports plus imports) that year in fact fell much more than GDP itself, largely reflecting the drying up of trade credit.

pages: 258 words: 83,303

Why Your World Is About to Get a Whole Lot Smaller: Oil and the End of Globalization
by Jeff Rubin
Published 19 May 2009

Relative to the size of the economy, the federal deficit will be over twice as big as it was when Washington had to finance the Korean or Vietnam war. But the enemy this time is not fascism or communism—it is economic stagnation. If you force-feed a $14 trillion economy with $1.7 trillion of deficit spending, GDP growth will respond. That’s not economic theory, just simple arithmetic. All that additional money will get spent in the economy, whether it comes in the form of tax breaks or government checks or public-spending programs. If only the Japanese had figured this out, so the thinking goes, they wouldn’t have lost a decade of growth.

pages: 278 words: 82,069

Meltdown: How Greed and Corruption Shattered Our Financial System and How We Can Recover
by Katrina Vanden Heuvel and William Greider
Published 9 Jan 2009

They preferred calling their program of military expansion and tax cuts for the rich “supply-side economics.” Whatever the label, this combination generated an increase in the federal deficit of about two percentage points relative to the size of the economy at that time. In 1983 GDP rose sharply by 4.5 percent. In 1984 GDP growth accelerated to 7.2 percent, with Reagan declaring the return to “morning in America.” Unemployment fell back to 7.5 percent. In today’s economy, an economic stimulus equivalent to the 1983 Reagan program would amount to about $300 billion in spending—roughly double the size of April’s stimulus program, though in line with the high-end figures being proposed in Congress.

pages: 444 words: 86,565

Investment Banking: Valuation, Leveraged Buyouts, and Mergers and Acquisitions
by Joshua Rosenbaum , Joshua Pearl and Joseph R. Perella
Published 18 May 2009

As the formula in Exhibit 3.21 indicates, this method relies on the WACC calculation performed in Step III and requires the banker to make an assumption regarding the company’s long-term, sustainable growth rate (“perpetuity growth rate”). The perpetuity growth rate is typically chosen on the basis of the company’s expected long-term industry growth rate, which generally tends to be within a range of 2% to 4% (i.e., nominal GDP growth). As with the exit multiple, the perpetuity growth rate is also sensitized to produce a valuation range. EXHIBIT 3.21 Perpetuity Growth Method where: FCF = unlevered free cash flow n = terminal year of the projection period g = perpetuity growth rate r = WACC The PGM is often used in conjunction with the EMM, with each serving as a sanity check on the other.

pages: 279 words: 87,910

How Much Is Enough?: Money and the Good Life
by Robert Skidelsky and Edward Skidelsky
Published 18 Jun 2012

We want leisure to grow and pollution to decline. Both are part of any sane idea of human welfare. But both are excluded from GDP, which measures only that portion of domestic production that is traded in markets. There is no subtraction for pollution, and no addition for leisure. The extent to which further GDP growth will improve welfare is therefore moot. It surely does so for very poor countries, but it may be the case that rich societies already have too much GDP. Our view is that, for the wealthy nations of the world, GDP should be treated as a by-product of policies aimed at realizing the good life. Only experience will show whether the GDP outcome is positive, negative or stationary.

pages: 278 words: 88,711

The Next 100 Years: A Forecast for the 21st Century
by George Friedman
Published 30 Jul 2008

Iran is twenty-ninth, with a GDP of just under $300 billion. Egypt is fifty-second, with a GDP of about $125 billion a year. For the past five years Turkey's economy has been growing at 5 to 8 percent a year, one of the highest sustained growth rates for any major country. With the exception of two years of recession, Iran has also had a sustained GDP growth rate of over 6 percent for the past five years, as has Egypt. These two countries are growing fast, but they are starting with a much smaller base than Turkey. Compared to European countries, Turkey already has the seventh-largest economy and is growing faster than most. Now, it's true that economic size is not everything.

pages: 223 words: 10,010

The Cost of Inequality: Why Economic Equality Is Essential for Recovery
by Stewart Lansley
Published 19 Jan 2012

The share of output accounted for by finance, in contrast, doubled from around 5 per cent in the mid-1970s to slightly over ten per cent by 2008.104 The expansion of finance accelerated from the second half of the 1990s. In the three years to 2007—before the onset of the credit crunch—financial services accounted for a third of overall GDP growth (another third came from residential and commercial property) and had grown to play a bigger role in the economy than in any other comparable nation.105 Thus financial services accounts for 7.5 per cent of the US economy, 6.7 per cent in Japan, 4.6 per cent in France and 3.8 per cent in Germany.

pages: 283 words: 81,163

How Capitalism Saved America: The Untold History of Our Country, From the Pilgrims to the Present
by Thomas J. Dilorenzo
Published 9 Aug 2004

Numerous studies have documented the remarkable degree of upward income mobility in the United States, but to realize just how much opportunity this country offers, one need think only of the countless stories of penniless immigrants who have come to America and become affluent entrepreneurs. TABLE 1.2: ECONOMIC FREEDOM AND ECONOMIC GROWTH ECONOMIC FREEDOM INDEX (QUINTILES) REAL GDP GROWTH PER CAPITA Bottom -0.57% 4th 1.51% 3rd 1.76% 2nd 1.88% 1st 2.34% Source: Fraser Institute, Economic Freedom of the World, 2003 Annual Report (Vancouver, B.C.: Fraser Institute, 2003), 11. BACKLASH Capitalism’s record is truly extraordinary. It has brought incredible economic opportunity to countless people, has lifted many out of poverty, has allowed consumers to be in control of the economy, and so much more.

pages: 561 words: 87,892

Losing Control: The Emerging Threats to Western Prosperity
by Stephen D. King
Published 14 Jun 2010

Indeed, the easiest way to mask the problem of modest income gains for large swathes of the population has been to encourage a culture of debt dependency. Why worry if income growth is not particularly strong when consumer spending can be fuelled through the exorbitant use of plastic? It’s easy to keep the masses happy in the short term through big increases in debt. If, however, GDP growth does not easily translate into household income growth – as has been the case for the vast majority of the US population – the short-term fix will lead to long-term problems. Even if, in a world of low nominal interest rates, debt is easy to service, the truth of the matter is that, eventually, the outstanding debt will have to be repaid (or, alternatively, the debtor will have to default).

pages: 285 words: 86,174

Twilight of the Elites: America After Meritocracy
by Chris Hayes
Published 11 Jun 2012

The first era of equality, from the end of the Second World War to the early 1970s, represented a period of historically unprecedented growth, mass affluence, and middle-class expansion that has not been duplicated since. Income inequality markedly declined, even as the economy posted a nearly unmatched level of annual GDP growth. Union density rose as high as 34 percent (the highest it’s ever been), while the ratio between average CEO compensation and average production worker compensation hovered around 25 (by 2009 it was 185), and people up and down the income scale saw remarkable material gains. Between 1947 and 1979 real family income grew for everyone but it grew the most for the poorest 20 percent of the population.

pages: 345 words: 86,394

Frequently Asked Questions in Quantitative Finance
by Paul Wilmott
Published 3 Jan 2007

Note that the arbitrage argument is an approximate one, relating diversified portfolios, on the assumption that the stock-specific risks are negligible compared with the factor risks. In practice we can choose the factors to be macro-economic or statistical. Here are some possible macro-economic variables. • an index level • GDP growth • an interest rate (or two) • a default spread on corporate bonds • an exchange rate Statistical variables come from an analysis of a covariance of asset returns. From this one extracts the factors by some suitable decomposition. The main differences between CAPM and APT is that CAPM is based on equilibrium arguments to get to the concept of the Market Portfolio whereas APT is based on a simple approximate arbitrage argument.

pages: 261 words: 81,802

The Trouble With Billionaires
by Linda McQuaig
Published 1 May 2013

But, once again, the evidence ‌does not support this claim.30 Since the mid-1970s, top marginal tax rates, particularly in the Anglo-American countries, have declined dramatically. While this has prompted other countries to cut their marginal rates as well, the cuts haven’t been as deep elsewhere. Yet, as Figure 17 shows, there is no relationship between cuts in the top tax rate and per capita GDP growth. ‌ Fig. 17 Cuts in top personal marginal tax rates do not lead to increased rates of economic growth31 However, while there is no relationship between lower marginal tax rates on the rich and rates of economic growth, there is a strong and statistical significant relationship between lower taxes on the rich and the share of national income that the rich are able to capture.

pages: 383 words: 81,118

Matchmakers: The New Economics of Multisided Platforms
by David S. Evans and Richard Schmalensee
Published 23 May 2016

It believed SMEs in China confronted five challenges: “(1) limited geographic presence which restricts their ability to develop customer and supplier relationships beyond their local markets; (2) fragmentation of suppliers and buyers which makes it difficult to find and communicate with suitable trading partners; (3) limited communication channels and information sources to market and promote their products and services to find new markets or suppliers; (4) relatively small scale of operations which limits their resources for sales and market; and (5) absence of efficient mechanisms for evaluating the trustworthiness of trading partners.”24 Consumers and retail businesses faced many of these same challenges. But there were other frictions that needed solutions as well. Retail Frictions By the early 2000s, China was booming. The average real GDP growth rate ranged from a low of 7.6 percent to a high of 11.0 percent between 1995 and 2004.25 Retail spending was increasing rapidly as Chinese consumers, particularly urban ones, got higher-paying jobs and accrued wealth from investments in real estate and stocks. They wanted to shop. Conventional retail businesses had trouble keeping up with consumer demand.

Rethinking Money: How New Currencies Turn Scarcity Into Prosperity
by Bernard Lietaer and Jacqui Dunne
Published 4 Feb 2013

The Dutch government is on the edge of collapse because of the popular and political unwillingness to accept the austerity program proposed by its conservative government. Romania is not far behind. Greece, Italy and Portugal remain in perilous condition. . . . On the American front, the decline of GDP growth to 2.2 percent rightly raises fears that our sputtering domestic recovery is just about over.”5 There is a solution, as the events in Curitiba illustrate. Government, whether at a local, state, or regional level, can take its economic fate into its own hands and issue a cooperative currency. This cooperative medium of exchange, which can be customized to any given government’s needs, is a currency called the civic.

pages: 304 words: 82,395

Big Data: A Revolution That Will Transform How We Live, Work, and Think
by Viktor Mayer-Schonberger and Kenneth Cukier
Published 5 Mar 2013

Microsoft has entered the arena with the Windows Azure Marketplace. It aims to focus on high-quality data and oversee what is on offer, similar to the way Apple supervises the offerings in its app store. In Microsoft’s vision, a marketing executive working on an Excel spreadsheet may want to cross-tabulate her internal company data against GDP growth forecasts from an economic consultancy. So she clicks to buy the data then and there, and it instantly flows into her columns on the screen. So far there’s no telling how the valuation models will play out. But what’s certain is that economies are starting to form around data—and that many new players stand to benefit, while a number of old ones will probably find a surprising new lease on life.

pages: 296 words: 82,501

Stuffocation
by James Wallman
Published 6 Dec 2013

The rise of the global middle class Consider, for example, the opening statement in Dominic Wilson, Alex L. Kelston, Swarnali Ahmed, “Is this the BRICs Decade?“, Goldman Sachs’ BRICs Monthly Issue, 10/03, May 2010: “The last decade saw the BRICs make their mark on the global economic landscape. Over the past 10 years they have contributed over a third of world GDP growth and grown from one-sixth of the world economy to almost a quarter (in PPP terms). Looking forward to the coming decade, we expect this trend to continue and become even more pronounced.“ Or consider the final sentence in Catherine Wolfram, “Rising Middle Class Fuels Global Energy Surge“, Bloomberg.com, 17 January 2012: “There is no doubt that the rise of the global middle class is a positive development.

The Ages of Globalization
by Jeffrey D. Sachs
Published 2 Jun 2020

China embarked on that path decisively with the rise to power of the brilliant pragmatic reformer Deng Xiaoping in 1978. Following Deng’s sage advice on pragmatic market opening and his famed nonideological approach (“It doesn’t matter whether a cat is black or white so long as it catches mice”), China achieved around 10 percent per year GDP growth for nearly thirty-five years, roughly from 1980 to 2015. Growth at 10 percent per year results in a doubling every seven years. Over thirty-five years, that means five doublings, or a cumulative growth of 2 × 2 × 2 × 2 × 2 = 32 times. In fact, according to IMF data, China grew just under 10 percent per year (9.8 percent), so that cumulative growth came to an increase of twenty-six times, an extraordinary result.7 The result is shown in figure 8.7.

pages: 365 words: 88,125

23 Things They Don't Tell You About Capitalism
by Ha-Joon Chang
Published 1 Jan 2010

In the short run, this creates economic instability, as liquid capital sloshes around the world at very short notice and in ‘irrational’ ways, as we have recently seen. More importantly, in the long run, it leads to weak productivity growth, because long-term investments are cut down to satisfy impatient capital. The result has been that, despite enormous progress in ‘financial deepening’ (that is, the increase in the ratio between financial assets and GDP), growth has actually slowed down in recent years (see Things 7 and 13). Thus, exactly because finance is efficient at responding to changing profit opportunities, it can become harmful for the rest of the economy. And this is why James Tobin, the 1981 Nobel laureate in economics, talked of the need to ‘throw some sand in the wheels of our excessively efficient international money markets’.

pages: 280 words: 83,299

Empty Planet: The Shock of Global Population Decline
by Darrell Bricker and John Ibbitson
Published 5 Feb 2019

We can’t be certain of the answer. But we can at least look for clues. Some of those clues can be found in Nairobi. Africa, in the second decade of the twenty-first century, is a happening place. In 2016, fourteen of the thirty fastest growing economies—so almost half—were in Africa. Kenya ranked twentieth, with a projected GDP growth above 6 percent each year for the foreseeable future—three times what most Western nations are experiencing.178 Few doubt that the continent will remain a center of economic growth in the decades ahead. Some of that growth is self-generating as the continent becomes increasingly important as a consumer market.

pages: 316 words: 87,486

Listen, Liberal: Or, What Ever Happened to the Party of the People?
by Thomas Frank
Published 15 Mar 2016

To put it bluntly, it is not clear that cheering for innovation in the bombastic way we see in the blue states actually improves the economic well-being of average citizens. For example, the last fifteen years have been a golden age of financial and software innovation, but they have been feeble in terms of GDP growth. In ideological terms, however, innovation definitely works: as a way of excusing soaring inequality and explaining the exalted status of the rich, it is the best we’ve got. TRIUMPH OF THE INNO-CRATS Massachusetts’s identification with the Democratic Party is profound and well-known. The home state of the Kennedy family, it has produced two other Democratic presidential nominees in recent decades—Governor Michael Dukakis and Senator John Kerry—and was, as we know, the only state won by George McGovern in 1972.

pages: 287 words: 80,050

The Wisdom of Frugality: Why Less Is More - More or Less
by Emrys Westacott
Published 14 Apr 2016

And the assumption that there is some correlation between GDP and general well-being isn’t fanciful; countries with the highest GDP per capita typically rank high on other positive indexes, while those with relatively low GDP per capita typically don’t. This is Diane Coyle’s view: Economic growth contributes to happiness, and GDP growth should remain a policy target. . . . There’s no doubt that in a number of ways GDP is a flawed statistic as a measure of welfare. But any replacement would be flawed too, not to mention much harder for many countries to collect and measure; at least with the familiar GDP statistics we know what we’re getting.15 The argument about the usefulness of GDP, or per capita GDP, as an indicator of individual or social well-being is really a technical debate within a larger philosophical discussion about values and goals.

pages: 309 words: 81,975

Brave New Work: Are You Ready to Reinvent Your Organization?
by Aaron Dignan
Published 1 Feb 2019

If growth creates pollution, don’t try to regulate, because more growth will clean things up again. Except, it turns out, it doesn’t, and it won’t.” Growth has delivered extraordinary benefits to humanity, but at a cost. The question is: Can we lift everyone up without destroying the planet? And even if we can, what then? GDP growth can’t continue forever with finite resources. Of course, this is not a new idea. In 1968 R. Buckminster Fuller warned us about this in his masterwork Operating Manual for Spaceship Earth. Decades earlier, philosopher Bertrand Russell offered a damning critique of our approach to abundance in his essay “In Praise of Idleness.”

Uncomfortably Off: Why the Top 10% of Earners Should Care About Inequality
by Marcos González Hernando and Gerry Mitchell
Published 23 May 2023

This credit-driven growth is connected to decades of runaway incomes at the top and stagnant wages at the bottom.7 Half of the UK population had barely gained from the previous four decades of growth, with a declining share of national income going to salaries and a rising share going to capital. Today, 60% of those in poverty have someone in their household who is employed, which is 20% higher than in 1995.8 With sluggish household earnings at the bottom, average weekly earnings have mostly decoupled from GDP growth. The UK has been getting richer but most people are not noticeably better off. This has been particularly true outside the capital. Average weekly earnings among full-time employees in London are a third higher than the UK average and nearly two thirds higher than those in the north-east.9 At the same time, though London is one of the richest regions in northern Europe, 27.7% of its inhabitants live in poverty.10 After the financial crisis, the UK government, instead of tackling the root causes of the financial crash – an economy over-reliant on an over-leveraged financial system whose proceeds mostly benefited one city – found scapegoats; initially welfare recipients and later, immigrants.

pages: 303 words: 93,545

I'm a stranger here myself: notes on returning to America after twenty years away
by Bill Bryson
Published 6 Jun 2000

But now the greater part of output for nearly all developed nations is in services and ideas—things like computer software, telecommunications, financial services—which produce wealth but don’t necessarily, or even generally, result in a product that you can load on a pallet and ship out to the marketplace. Because such activities are so difficult to measure and quantify, no one really knows what they amount to. Many economists now believe that America may have been underestimating its rate of GDP growth by as much as two to three percentage points a year for several years. That may not seem a great deal, but if it is correct then the American economy— which obviously is already staggeringly enormous—may be one-third larger than anyone had thought. In other words, there may be hundreds of billions of dollars floating around in the economy that no one suspected were there.

Are We Getting Smarter?: Rising IQ in the Twenty-First Century
by James R. Flynn
Published 5 Sep 2012

There is a large pool of English-speaking professional workers, and a high level of computer literacy among the youth. On the debit side, 10 percent of the people live on the verge of starvation without any state support (they pay to use a latrine). Politics turns around which of the three most powerful tribes (out of 452) will use office to favor their own tribe. GDP growth was low from 2000 to 2005, averaged at over 6 percent from 2006 to 2008, and dipped during 2009 (the inancial crisis, drought, and tripled food prices). A recovery began in 2010. Saudi Arabia (IQ 84) Batterjee (2011) report results for children aged 8 to 15 between standardizations of the Standard Progressive Matrices in 1977 56 Developing nations Box 11 The Kenyan Raven’s gains are ranked against all others on record.

pages: 363 words: 92,422

A Fine Mess
by T. R. Reid
Published 13 Mar 2017

“For a small, little-noticed country,” the professor continued, “it was useful to have a trademark. The problem is that now we’re stuck with it. The flat tax eventually outlived its benefit, but it’s our trademark, so we can’t fix it.” In the first years of Mart Laar’s flat tax, the Estonian economy soared. By 1997, the country’s GDP growth rate was 11%, making it one of the fastest-growing economies on earth. Growth rates above 7% continued into the first years of the twenty-first century. (Of course, growth rates tend to look large when a country starts from a minuscule base, as Estonia did.) And government revenues went up. “After decrease of the level of taxation, budget revenues did not fall but increased significantly,” Mart Laar wrote some years later in his English-language blog.

pages: 209 words: 89,619

The Precariat: The New Dangerous Class
by Guy Standing
Published 27 Feb 2011

There were six registered seekers for every job vacancy, up from 1.7 before the crisis, and long-term unemployment accounted for 40 per cent of the total, much more than in previous recessions. It was the only recession since the Great Depression of the 1930s to have wiped out all the job growth from the previous cyclical upturn. The rich world’s job-generating machine is running down. This pre-dates the shock of 2008. In the United States, GDP growth slowed between the 1940s and 2000s but employment growth slowed much more. In the 1940s, nonagricultural employment rose by nearly 40 per cent; the increase was less in the 1950s, accelerated slightly in the 1960s, fell to 28 per cent in the 1970s and 20 WHY THE PRECARIAT IS GROWING 47 per cent in the 1980s and 1990s.

pages: 357 words: 95,986

Inventing the Future: Postcapitalism and a World Without Work
by Nick Srnicek and Alex Williams
Published 1 Oct 2015

Paul Krugman, ‘Sympathy for the Luddites’, New York Times, 13 June 2013; Lawrence Summers, ‘Roundtable: The Future of Jobs’, presented at The Future of Work in the Age of the Machine, Hamilton Project, Washington, DC, 19 February 2015, at hamiltonproject.org. 130.Glyn, Capitalism Unleashed, pp. 27–31. 131.Harvey, Companion to Marx’s Capital, Volume 1, pp. 284–5. 132.PMI surveys suggest the annual growth rate has been 2 per cent, which is far below what has been standard for global GDP growth. (Chris Williamson, ‘January’s PMI Surveys Signal First Global Growth Upturn for Six Months’, Markit, 4 February 2015, at markit.com.) Other studies find that growth is higher than this, but potential output has been declining in developed economies since before the crisis, and estimates of global potential output have continually been revised down after the crisis.

pages: 342 words: 94,762

Wait: The Art and Science of Delay
by Frank Partnoy
Published 15 Jan 2012

By 2012, the numerical measures that Sarkozy was urging people to move beyond had become the object of daily obsessive observation as markets crashed. The media and the public focused relentlessly on these plummeting numbers, as happens when there is a spike in the murder rate or a sudden decline in math test scores. GDP growth was down; unemployment was up. Even France’s AAA credit rating was downgraded. Suddenly, Sarkozy faced a more immediate crisis than the long-term search for the right ways to measure well-being: the numbers were hurting his chances in an already tough reelection campaign. Measuring well-being moved to the back burner.

pages: 369 words: 94,588

The Enigma of Capital: And the Crises of Capitalism
by David Harvey
Published 1 Jan 2010

.: The World is Flat 132 futures, energy 24 futures markets 21 Certificates of Deposit 262 currency 24 Eurodollars 262 Treasury instruments 262 G G7/G8/G20 51, 200 Galileo Galilei 89 Gates, Bill 98, 173, 221 Gates foundation 44 gays, and colonisation of urban neighbourhoods 247, 248 GDP growth (1950–2030) 27 Gehry, Frank 203 Geithner, Tim 11 gender issues 104, 151 General Motors 5 General Motors Acceptance Corporation 23 genetic engineering 84, 98 genetic modification 186 genetically modified organisms (GMOs) 186 gentrification 131, 256, 257 geographical determinism 210 geopolitics 209, 210, 213, 256 Germany acceptance of state interventions 199–200 cross-border leasing 142–3 an export-dominated economy 6 falling exports 141 invasion of US auto market 15 Nazi expansionism 209 neoliberal orthodoxies 141 Turkish immigrants 14 Weimar inflation 141 Glass-Steagall act (1933) 20 Global Crossing 100 global warming 73, 77, 121, 122, 187 globalisation 157 Glyn, Andrew et al: ‘British Capitalism, Workers and the Profits Squeeze’ 65 Goethe, Johann Wolfgang von 156 gold reserves 108, 112, 116 Goldman Sachs 5, 11, 20, 163, 173, 219 Google Earth 156 Gould, Stephen Jay 98, 130 governance 151, 197, 198, 199, 201, 208, 220 governmentality 134 GPS systems 156 Gramsci, Antonio 257 Grandin, Greg: Fordlandia 188, 189 grassroots organisations (GROS) 254 Great Depression (1920s) 46, 170 ‘Great Leap Forward’ 137, 138, 250 ‘Great Society’ anti-poverty programmes 32 Greater London Council 197 Greece sovereign debt 222 student unrest in 38 ‘green communes’ 130 Green Party (Germany) 256 ‘green revolution’ 185–6 Greenspan, Alan 44 Greider, William: Secrets of the Temple 54 growth balanced 71 compound 27, 28, 48, 50, 54, 70, 75, 78, 86 economic 70–71, 83, 138 negative 6 stop in 45 Guggenheim Museu, Bilbao 203 Gulf States collapse of oil-revenue based building boom 38 oil production 6 surplus petrodollars 19, 28 Gulf wars 210 gun trade 44 H habitat loss 74, 251 Haiti, and remittances 38 Hanseatic League 163 Harrison, John 91 Harrod, Roy 70–71 Harvey, David: A Brief History of Neoliberalism 130 Harvey, William vii Haushofer, Karl 209 Haussmann, Baron 49, 167–8, 169, 171, 176 Hawken, Paul: Blessed Unrest 133 Hayek, Friedrich 233 health care 28–9, 59, 63, 220, 221, 224 reneging on obligations 49 Health Care Bill 220 hedge funds 8, 21, 49, 261 managers 44 hedging 24, 36 Hegel, Georg Wilhelm Friedrich 133 hegemony 35–6, 212, 213, 216 Heidegger, Martin 234 Helú, Carlos Slim 29 heterogeneity 214 Hitler, Adolf 141 HIV/AIDS pandemic 1 Holloway, John: Change the World without Taking Power 133 homogeneity 214 Hong Kong excessive urban development 8 rise of (1970s) 35 sweatshops 16 horizontal networking 254 household debt 17 housing 146–7, 149, 150, 221, 224 asset value crisis 1, 174 foreclosure crises 1–2, 166 mortgage finance 170 values 1–2 HSBC 20, 163 Hubbert, M.

pages: 422 words: 89,770

Death of the Liberal Class
by Chris Hedges
Published 14 May 2010

Many simply walked away from their land .12 “There’s much excited talk these days about a great global shift of power, with speculation about whether, or when, China might displace the U.S. as the dominant global power, along with India, which, if it happened, would mean that the global system would be returning to something like what it was before the European conquests,” said Noam Chomsky, speaking at the Left Forum at Pace University in New York:And indeed their recent GDP growth has been spectacular. But there’s a lot more to say about it. So if you take a look at the U.N. human development index, basic measure of the health of the society, it turns out that India retains its place near the bottom. It’s now 134th, slightly above Cambodia, below Laos and Tajikistan. Actually, it’s dropped since the reforms began.

pages: 323 words: 92,135

Running Money
by Andy Kessler
Published 4 Jun 2007

Which reminds me of a great story: An economist and an investor are helplessly lost on a hike through the peaks and valleys of the Dow and NASDAQ mountain ranges, well, the Rockies. The investor sticks a wet finger in the air to find his direction via the prevailing wind. The economist is studying charts and numbers, GDP growth, trade stats, unemployment data, inflation, hours worked, productivity, meticulously compiled by the Commerce Department, the Bureau of Labor Statistics and Bureau of Economic Analysis. “OK, I’ve got this figured out,” the economist yells. “You see that big mountain over there?” “Yup,” sighs the investor.

pages: 323 words: 90,868

The Wealth of Humans: Work, Power, and Status in the Twenty-First Century
by Ryan Avent
Published 20 Sep 2016

In 2015, emerging markets grew at their slowest pace since 2001 (excepting the global-recession year of 2009). The pace of catch-up with American income levels, in terms of GDP per person, has slowed to practically nothing. The proximate cause is the inevitable slowing of the Chinese economy. China’s boom peaked in 2007, when the economy notched up an extraordinary GDP growth rate of more than 14 per cent. It grew at less than half that pace in 2015. More declines are inevitable. The closer an economy gets to the technological frontier, the more difficult it is to achieve rapid progress towards that frontier. At the same time, China’s institutions remain highly illiberal.

pages: 353 words: 88,376

The Investopedia Guide to Wall Speak: The Terms You Need to Know to Talk Like Cramer, Think Like Soros, and Buy Like Buffett
by Jack (edited By) Guinan
Published 27 Jul 2009

Hyperinflation is a situation in which the price increases are so out of control that the concept of inflation is meaningless. 132 The Investopedia Guide to Wall Speak Investopedia explains Hyperinflation When associated with depressions, hyperinflation often occurs when there is a large increase in the money supply that is not supported by gross domestic product (GDP) growth, resulting in an imbalance in the supply and demand for the money. Left unchecked, this causes prices to increase as the currency loses its value. When associated with wars, hyperinflation often occurs when there is a loss of confidence in the ability of a currency to maintain its value in the aftermath.

words: 49,604

The Weightless World: Strategies for Managing the Digital Economy
by Diane Coyle
Published 29 Oct 1998

The size of government and government performance indicators in different country groups. Indicator Industrialised countries ‘Big’ gov’ts* 1960 1990 3.2 2.6 1.7 5.4 2.9 6.1 15.6 24.1 ‘Medium-sized’ gov’ts 1960 1990 4.0 3.3 1.6 4.3 4.6 9.2 16.4 21.6 † ‘Small’ gov’ts ‡ 1960 1990 4.6 3.3 2.3 6.1 2.7 4.2 17.4 20.8 Newly Industrialised countries¶ 1990 Real GDP growth (%)§ 6.2 Inflation (%) 15.3 Unemployment (%) 2.9 Income share of 17.0 Lowest 40% Illiterate population 9.3 2.9 13.3 4.6 2.2 0.5** 9.2 15+ (% of population) Life expectancy 72.0 77.0 70.0 77.0 71.0 77.0 74.0 * Belgium, Italy, Netherlands, Norway, Sweden (public expenditure more than 50 per cent of GDP in 1990). † Austria, Canada, France, Germany, Ireland, New Zealand, Spain (public expenditure between 40 and 50 per cent of GDP in 1990). ‡ Australia, Japan, Switzerland, UK, US (public expenditure less than 40 per cent of GDP in 1990).

pages: 322 words: 87,181

Straight Talk on Trade: Ideas for a Sane World Economy
by Dani Rodrik
Published 8 Oct 2017

Economists at Citigroup, for example, boldly concluded that circumstances had never been this conducive to broad, sustained growth around the world, and they projected rapidly rising global output until 2050, led by developing countries in Asia and Africa. The accounting and consulting firm Price Waterhouse Coopers predicted that per-capita GDP growth in China, India, and Nigeria would exceed 4.5 percent well into the middle of the century. McKinsey & Company christened Africa, long synonymous with economic failure, the land of “lions on the move.” Today, such talk has been displaced by concern about what The Economist calls “the great slowdown.”

pages: 372 words: 92,477

The Fourth Revolution: The Global Race to Reinvent the State
by John Micklethwait and Adrian Wooldridge
Published 14 May 2014

America’s problems stem from the fact that it exemplifies too many of democracy’s vices; by contrast, the European Union has exhibited too few of the virtues. One of the few things that Americans agree on nowadays is that their political system is a mess. This mess is becoming increasingly costly. The Peterson Foundation calculates that, since 2010, fiscal uncertainty—i.e., gridlock—might have slowed America’s GDP growth by one percentage point and stopped the creation of two million jobs. The mess is also taking a toll on America’s image—and by ­extension democracy’s image—abroad. Politics used to stop at the ­water’s edge. No longer: Democrats lustily accused George W. Bush of being a warmonger. Now Republicans equally lustily accuse Barack Obama of being an appeaser.

pages: 372 words: 94,153

More From Less: The Surprising Story of How We Learned to Prosper Using Fewer Resources – and What Happens Next
by Andrew McAfee
Published 30 Sep 2019

This was more than 60 percent faster than the country’s GDP grew over the same period. But a very different pattern has emerged in the years since the recession ended. The growth in plastic consumption has slowed down greatly, to less than 2.0 percent per year between 2009 and 2015. This is almost 14 percent slower than GDP growth over the same period. So while America is not yet post-peak in its use of plastic, it’s quickly closing in on this milestone. Finally, let’s look at total energy consumption combined with greenhouse gas emissions, which are the most harmful side effect of generating energy from fossil fuels.V US Real GDP and Total Energy Consumption, 1800–2017 I was surprised to learn that total American energy use in 2017 was down almost 2 percent from its 2008 peak, especially since our economy grew by more than 15 percent between those two years.

pages: 340 words: 90,674

The Perfect Police State: An Undercover Odyssey Into China's Terrifying Surveillance Dystopia of the Future
by Geoffrey Cain
Published 28 Jun 2021

They couldn’t report authoritatively on the epidemic of fatal road crashes and haphazard law enforcement on China’s lawless streets. Foreign Policy’s James Palmer later lamented the near total absence of reliable data in the article “Nobody Knows Anything about China”: We don’t know the real figures for GDP growth… We don’t know the true size of China’s population… We don’t know anything about China’s high-level politics… We don’t know what people really think… We don’t know the real defense budget… We don’t know how good Chinese schools really are.20 [ ] The Chinese state was almost as much in the dark about the lives of its citizens as foreign China-watchers.

pages: 302 words: 92,206

Nomad Century: How Climate Migration Will Reshape Our World
by Gaia Vince
Published 22 Aug 2022

There is another way to reduce demand, and that is to reduce growth: during economic recessions and other reductions in activity, such as the Covid pandemic, emissions dropped significantly. A number of environmental activists are calling for an end to growth or even for negative growth, pointing out that the usually defined ‘healthy’ growth rate of around 2–3 per cent of GDP per annum is environmentally unsustainable. Globally, the average rate of GDP growth is around 3.5 per cent per year, and the world’s environmental problems are getting worse. However, it is not growth that is the problem, but environmentally and socially unsustainable growth. Economic growth is an increase in the quantity and quality of goods and services produced per person over time.

pages: 278 words: 91,332

Carmageddon: How Cars Make Life Worse and What to Do About It
by Daniel Knowles
Published 27 Mar 2023

Scott Ford, Henry Ford Motor Company France, 249 Paris free parking fuel-efficiency funding gasoline cost of prices taxes gender General Motors (GM) gentrification Germany Gibson, Donald Glencore (firm) governments Parliament, UK US Govind (driver) Grahame, Kenneth Great Depression The Great Gatsby (Fitzgerald) Greenwich Village, New York gridlock traffic gross domestic product (GDP) growth health Hidalgo, Anne high-speed trains highways/freeways Detroit protests against relocating population Vancouver See also specific highways Hitler, Adolf Hong Kong horses housing/houses costs of “dingbats” parking and public Houston, Texas Howard, Ebenezer HS2 railway hybrid vehicles imports, car incentives incomes/wages India inequality infrastructure Institute of Transportation Engineers insurance internal combustion engines International Energy Agency Jacobs, Jane jaywalking Jeep Jim Crow Laws Katy Freeway Kennedy Expressway Kentucky Kenya King, David Kolwezi, Democratic Republic of Congo land Las Vegas, Nevada Lawson, Henry John leaded gasoline Lean NOx Trap (LNT) Le Corbusier (architect) Levitt, William J.

pages: 1,544 words: 391,691

Corporate Finance: Theory and Practice
by Pierre Vernimmen , Pascal Quiry , Maurizio Dallocchio , Yann le Fur and Antonio Salvi
Published 16 Oct 2017

In this chapter you learned about the APT and were told that the two V factors are growth of GDP and unanticipated inflation. The equation for the model is: rj = 5.6% + bj 1 × 2% + bj 2 × 5%. Suppose that the sensitivity of your portfolio to GDP growth is −0.4, what is your portfolio’s sensitivity to unanticipated inflation? You believe that a recession is looming and you wish to eliminate your portfolio’s sensitivity to GDP growth but you still want to get the returns you expected. What happens to your portfolio’s sensitivity to unanticipated inflation? Answers Questions Because if it were remunerated, this would be an “unwarranted” gain.

How long can the economic profit it represents be sustained? How long will market growth last? Most importantly, the company’s rate of growth to perpetuity cannot be significantly greater than the long-term growth rate of the economy as a whole. For example, if the anticipated long-term inflation rate is 2% and real GDP growth is expected to be 2%, then if you choose a growth rate g that is greater than 4%, you are implying that the company will not only outperform all of its rivals but also eventually take control of the economy of the entire country or indeed of the entire world (trees do not grow to the sky)!2 In the case of ArcelorMittal, the normalised cash flow must be calculated for the year 2021, because we are looking for the present value at the end of 2020 of the cash flows expected in 2021 and every subsequent year to perpetuity.

pages: 850 words: 224,533

The Internationalists: How a Radical Plan to Outlaw War Remade the World
by Oona A. Hathaway and Scott J. Shapiro
Published 11 Sep 2017

President Ronald Reagan lifted the sanctions when the hostages were released, but put them back in place in 1984 after Hezbollah, a Shiite militia funded by Iran, killed 241 American servicemen in a Beirut attack. Over the course of the next two decades, the United States imposed a range of sanctions aimed at blocking Iranian efforts to obtain nuclear weapons.58 But by 2005, decades of sanctions had produced little, if any, progress. The Iranian economy was relatively healthy, averaging an annual GDP growth rate of 5.5 percent over the first half of the decade.59 Meanwhile, there was little evidence that the sanctions were dissuading the Iranians from pursuing nuclear research.60 The first step toward more effective sanctions was an increase in international cooperation. Outcasting, after all, is not very effective if carried out by a single state—even one as powerful as the United States.

John Mueller and Karl Mueller, “Sanctions of Mass Destruction,” Foreign Affairs 78, no. 3 (May/June 1999). 58. Gary Samore, ed., “Sanctions Against Iran: A Guide to Targets, Terms, and Timetables,” addendum to Decoding the Iran Nuclear Deal (Cambridge, MA: Harvard Kennedy School, 2015), http://belfercenter.ksg.harvard.edu/files/Iran%20Sanctions.pdf. 59. “Data: GDP growth (annual %),” The World Bank, http://data.worldbank.org/indicator/NY.GDP.MKTP.KD.ZG. 60. Shreeya Sinha and Susan Campbell Beachy, “Timeline on Iran’s Nuclear Program,” New York Times, April 2, 2015. 61. United Nations, S.C. Res. 1696 (July 31, 2006); S.C. Res. 1737 (December 23, 2006); S.C. Res. 1747 (March 24, 2007); S.C.

pages: 1,014 words: 237,531

Escape From Rome: The Failure of Empire and the Road to Prosperity
by Walter Scheidel
Published 14 Oct 2019

It quickly eclipsed Mediterranean trade in volume and value terms. Access to Atlantic commerce helped shape institutions that empowered merchants in their relations with monarchs and protected property rights. This beneficial influence was reflected in stronger urban and gross domestic product (GDP) growth in countries that were exposed to Atlantic trade, although less so in France and especially Spain. It was thus primarily in states with nonabsolutist political conditions that involvement in the Atlantic economy strengthened commercial interests and investment. Whereas Italian city-states with similar political attributes lacked direct access to the Atlantic, the Netherlands and England enjoyed both advantages.4 Dynamic models suggest that international trade made a considerable contribution to European economic development after 1500, especially in Britain, Portugal, and the Netherlands.

For England’s pioneering role in the fossil fuel transition, see, e.g., Warde 2013: 131–41 and chapters 10 and 12 in this volume. For the transformative shift from organic and fossil fuel economies, see most recently Wrigley 2016: 1–3. 9. On life expectancy, see Norberg 2017: 43; Pinker 2018: 54. See Roser 2019 for more detail. See Deaton 2013: 29–41 for the link between GDP and life expectancy. On global per capita GDP growth, see Maddison 2010. On poverty and malnourishment, see Norberg 2017: 9, 20, 65, 76. 10. Floud et al. 2011: 69, table 2.5 (heights), 364 (quote). 11. On literacy, see Norberg 2017: 131–33; Roser 2018. On freedom, see Pinker 2018: 202–3; Roser 2018. Fifty-six percent of the world’s population currently lives in democracies.

pages: 381 words: 101,559

Currency Wars: The Making of the Next Gobal Crisis
by James Rickards
Published 10 Nov 2011

Velocity (V) is just the measure of how quickly money turns over. If someone spends a dollar and the recipient also spends it, that dollar has a velocity of two because it was spent twice. If instead the dollar is put in the bank, that dollar has a velocity of zero because it was not spent at all. On the other side of the equation, nominal GDP growth has its real component (y) and its inflation component (P). For decades one of the most important questions to flow from this equation was, is there a natural limit to the amount that the real economy can expand before inflation takes over? Real growth in the economy is limited by the amount of labor and the productivity of that labor.

pages: 334 words: 98,950

Bad Samaritans: The Myth of Free Trade and the Secret History of Capitalism
by Ha-Joon Chang
Published 26 Dec 2007

Milanovic (2005), Worlds Apart – Measuring International and Global Inequality (Princeton University Press, Princeton and Oxford). 23 For example, see D. Rodrik and A. Subramaniam (2004), ‘From “Hindu Growth” to Growth Acceleration: The Mystery of Indian Growth Transition’, mimeo., Kennedy School of Government, Harvard University, March 2004. Downloadable from http://ksghome.harvard.edu/~drodrik/IndiapaperdraftMarch2.pdf 24 Annual per capita GDP growth rate between 1975 and 2003 was 4% in Chile, 4.9% in Singapore and 6.1% in Korea. See UNDP (2005), Human Development Report 2005 (United Nations Development Program, New York). 25 Chile’s per capita income (in 1990 dollars, as all the following figures are) was $5, 293 in 1970, when Salvador Allende, the left-wing president who was subsequently deposed by Pinochet, came to power.

pages: 322 words: 99,066

The End of Secrecy: The Rise and Fall of WikiLeaks
by The "Guardian" , David Leigh and Luke Harding
Published 1 Feb 2011

In a success all too rare, the GOT is effective in delivering services (education, health care, infrastructure and security) to its people. The GOT has sought to build a “knowledge economy” to attract FDI that will create high value-added jobs. As a result, the country has enjoyed five percent real GDP growth for the past decade. On women’s rights, Tunisia is a model. And, Tunisia has a long history of religious tolerance, as demonstrated by its treatment of its Jewish community. While significant challenges remain (above all the country’s 14 percent unemployment rate) on balance Tunisia has done better than most in the region. 4.

pages: 346 words: 102,625

Early Retirement Extreme
by Jacob Lund Fisker
Published 30 Sep 2010

Often, money is spent in the most inefficient way possible, by using credit cards, then making minimum payments, thus paying for the item twice over in interest alone. Enjoyment is often limited to buying things because there's no time to use them, since the buyer has to get back to work and earn more money. Measured in terms of gross domestic product (GDP) growth, this cycle is highly productive, but it could be argued that the net effect is not very productive at all. Thanks to advertising, nobody knows when enough is enough, even though running out of space in the garage should serve as an indication. Material wants are universally believed to be infinite in scope.

pages: 346 words: 101,255

The Big Necessity: The Unmentionable World of Human Waste and Why It Matters
by Rose George
Published 13 Oct 2008

The goal of sanitation is to prevent excrement traveling from anus to mouth. Basic, adequate sanitation is containment. Nearly 800 million Indians are spreading possibly contagious bugs around with abandon. The scale of open defecation in India may shock because it persists in a country with a galloping GDP growth rate of 8 percent a year. Or because the Indian government has been trying to combat it for decades. Over the last twenty years, millions of latrines have been constructed throughout the country, and billions of rupees have been set aside for sanitation targets. Between 1986 and 1999, the Government of India Central Rural Sanitation Program (CRSP) installed 9.45 million latrines, and 7.4 million more people a year gained access to sanitation.

pages: 347 words: 99,317

Bad Samaritans: The Guilty Secrets of Rich Nations and the Threat to Global Prosperity
by Ha-Joon Chang
Published 4 Jul 2007

Milanovic (2005), Worlds Apart – Measuring International and Global Inequality (Princeton University Press, Princeton and Oxford). 23 For example, see D. Rodrik and A. Subramaniam (2004), ‘From “Hindu Growth” to Growth Acceleration: The Mystery of Indian Growth Transition’, mimeo., Kennedy School of Government, Harvard University, March 2004. Downloadable from http://ksghome.harvard.edu/~drodrik/IndiapaperdraftMarch2.pdf 24 Annual per capita GDP growth rate between 1975 and 2003 was 4% in Chile, 4.9% in Singapore and 6.1% in Korea. See UNDP (2005), Human Development Report 2005 (United Nations Development Program, New York). 25 Chile’s per capita income (in 1990 dollars, as all the following figures are) was $5,293 in 1970, when Salvador Allende, the left-wing president who was subsequently deposed by Pinochet, came to power.

pages: 831 words: 98,409

SUPERHUBS: How the Financial Elite and Their Networks Rule Our World
by Sandra Navidi
Published 24 Jan 2017

Later in my career in structured finance, where highly leveraged assets like homes and companies are securitized and sold all over the world, I came to wonder how all of this was sustainable. Today we know that the engine behind excessive consumption has been financialization fueled with debt. Debt and Financialization Debt has been one of the key drivers of inequality. According to a McKinsey study, “global debt has grown by $57 trillion . . . outpacing world GDP growth” and “no major economy has decreased its debt-to-GDP ratio since 2007.”3 In the decades preceding the crisis, an increasingly greater share of GDP had been based on financial services, which in turn had been based on credit growth. However, financialization only contributes to growth up to a certain point before this trend reverses.4 As finance takes up an increasingly larger share of GDP, investment in the real economy falls.5 The author and former banker Satyajit Das notes that “[at] its peak, the finance industry generated 40 percent of corporate profits.”6 As a result finance decoupled from the economy, and while Wall Street got richer, everyone else got poorer, thereby increasing the wealth gap.

pages: 417 words: 97,577

The Myth of Capitalism: Monopolies and the Death of Competition
by Jonathan Tepper
Published 20 Nov 2018

Much like Rosemary Alvarez, the US economy is suffering from unexplained symptoms, and economists and policymakers cannot figure out what the problem is. The Federal Reserve pumped trillions of dollars into the economy as a giant dose of medicine, but over $2 trillion sits unused as excess reserves at the central bank. Government debt has increased by over $10 trillion since the financial crisis, yet GDP growth has been anemic, at best. Large corporations have been hoarding almost $2 trillion dollars, primarily offshore, yet corporate investment levels are dismal by historical standards. Corporations prefer share buybacks to raising wages or investing. Economists cannot figure out what ails the patient.

Free Money for All: A Basic Income Guarantee Solution for the Twenty-First Century
by Mark Walker
Published 29 Nov 2015

The Economist, 102 FREE MONEY FOR ALL which ought to know better, says we are overproductive. CNN Money discusses the problem of productivity, the President blames productivity growth for unemployment. Even someone as sophisticated as Brad DeLong writes “with productivity surging, it’s hard to be pessimistic about GDP growth, but it’s easy to be pessimistic about unemployment” which seems to suggest that if only productivity growth were lower, employment would be higher. And yet the “dark side” of productivity is merely another form of the Luddite fallacy—the idea that new technology destroys jobs. If the Luddite fallacy were true we would all be out of work because productivity has been increasing for two centuries.

Forward: Notes on the Future of Our Democracy
by Andrew Yang
Published 15 Nov 2021

Virtually all of these have been trending negatively for years. Reversing these declines should be the point of public service and the purpose of politics, policy, and government. If one fears that these goals wouldn’t work for people of different political alignments, there are measurements that conservatives would be likely to embrace, including GDP growth, rates of entrepreneurship and small business starts, labor force participation rate, efficiency of public resources, military readiness, global perception of the United States, crime rates, marriage rates and proportion of children in a two-parent household, volunteerism, and philanthropy. I’m a fan of many of these measurements too.

pages: 348 words: 97,277

The Truth Machine: The Blockchain and the Future of Everything
by Paul Vigna and Michael J. Casey
Published 27 Feb 2018

The same is true for asset managers at mutual funds, pension funds, and hedge funds, whose compensation is determined by how well their portfolios perform on a quarterly basis compared with the broader market. Even government bond traders march to the drum of delayed, audited releases of financial information, in their case economic indicators on estimates of inflation, unemployment, and GDP growth. What happens to this industry when all financial and economic data is being updated, automatically and indisputably in real time? What happens to the people who lose their jobs? What happens to the work culture? If the future foreseen by this book comes to pass, we’ll witness the biggest employment shakeup the world has ever seen.

Systematic Trading: A Unique New Method for Designing Trading and Investing Systems
by Robert Carver
Published 13 Sep 2015

Technical vs fundamental Strategies vary in the source of data they use, either using technical or fundamental information, or both. Purely technical rules only use price data. Non price, fundamental data, comes in two main flavours: micro and macro. Micro data is about a specific asset, for example the yield of a particular bond or the PE ratio of a company. Macro data such as inflation and GDP growth covers entire economies. 43 Systematic Trading I have worked extensively with both fundamental and technical data. Technical systems are easier to build and run, but in another example of barriers to entry the additional effort required for including fundamental rules is usually rewarded with higher returns.

Corbyn
by Richard Seymour

But there are growing signs since the global financial crash that we have reached, as one of John McDonnell’s advisors, economist James Meadway, put it, ‘peak globalisation’. World trade is still growing, but far less rapidly than before the credit crunch, and more slowly than global GDP. According to the World Trade Organization, the ratio of trade growth to GDP growth fell to 0.6:1 in 2016. Financial internationalism, wherein banks extend their reach increasingly globally, is slowing down. Protectionism is on the rise across the G20, and various governments – notably the Chinese – have imposed capital controls.2 This is a crisis of globalisation, and, with that, a crisis of all the taken-for-granted wisdom about globalisation.

pages: 388 words: 99,023

The Emperor's New Road: How China's New Silk Road Is Remaking the World
by Jonathan Hillman
Published 28 Sep 2020

It felt like being asked to tell Thomas Edison about lightbulbs, but I wanted to see how they would react. The answer? Blank stares. Apparently, the notion that bad projects might ultimately leave people and places worse off just did not compute. After all, China’s own rise has been fueled by dramatic infrastructure spending. Its top leaders have all ascended in a system that rewards GDP growth, which they have learned to boost through building infrastructure.21 These incentives favor quantity over quality, masking longer-term costs. Within China, “ghost cities” artificially boost growth figures and then sit unused. The same playbook that Chinese planners have used at home, where they have fewer checks on their authority, faces even greater challenges abroad.

pages: 393 words: 102,801

Welcome to Britain: Fixing Our Broken Immigration System
by Colin Yeo;
Published 15 Feb 2020

Yet, to deny these children further and higher education, as we do at present, is to cause them permanent disadvantage. It is also a good example of a self-defeating policy: further and higher education are not a pointless drain on public resources; they are good for society and the economy as a whole as they increase productivity and future GDP growth. To deny a particular individual this benefit on the grounds of limited resources is to fly in the face of good economics. Law-makers have several options available to them and doing nothing is not one of them. While inaction might have been a justifiable position to adopt in previous years, it is hard to see how a rational and responsible politician could reach this conclusion today, given that the estimated size of the unauthorised migrant population in the UK today is between 600,000 and 1.2 million.

pages: 352 words: 98,561

The City
by Tony Norfield

Immigration controls in rich countries, along with the strong popular support for these, have also been important factors preventing an equalisation of rates of exploitation globally. This point is also relevant beyond the US. In the UK, for example, it was one factor supporting an unprecedented period of uninterrupted quarter-on-quarter GDP growth from late 1991 until early 2008. Optimism about the outlook for the capitalist economy became entrenched: things could only get better! It led ordinary people, businesses and most economists to dismiss the possibility of a serious setback, which in turn encouraged higher levels of borrowing. Cheap foreign labour did deliver a significant boost to global profitability, principally in all the richer countries, but its incremental impact is now likely to be much reduced.

pages: 328 words: 96,678

MegaThreats: Ten Dangerous Trends That Imperil Our Future, and How to Survive Them
by Nouriel Roubini
Published 17 Oct 2022

“There is no doubt in my mind that material conditions for the overwhelming majority of people in China have improved phenomenally and in an unprecedented manner at an unprecedented speed and magnitude in the thirty years after 1980,” said author and Columbia University economics professor Jeffrey Sachs.11 Indeed China had—since its economic opening—almost three decades of 10 percent GDP growth. While the unopposed Chinese Communist Party chalked up stunning gains, US and Western democracies often succumbed to partisan paralysis. In developing countries, struggling people marveled at China’s progress and scoffed at the West. Democracy, in their eyes, took a back seat to growth. “‘Give me liberty or give me death’ is all well and good if you can afford it,” the economist Dambisa Moyo told a TED audience.

pages: 349 words: 99,230

Essential: How the Pandemic Transformed the Long Fight for Worker Justice
by Jamie K. McCallum
Published 15 Nov 2022

In that environment, there was hardly an uproar that capitalism had simply not produced enough good jobs for those without college degrees, who make up the bulk of the American workforce.17 In 2019, over one-quarter of low-wage workers qualified for some form of public supplement such as Medicaid or food stamps.18 But then something remarkable happened: the labor market heated up and wages at the bottom started to rise. The combination of the Fight for $15 movement and a tight labor pool shrunk the reserve army of labor to historic lows. Many states raised their minimum wages. It was a decidedly weird moment of good news after a decade of anemic GDP growth. The ever-buoyant optimism of the political class finally had some hard data on its side. Then the pandemic hit. As early as February 2020, the US was experiencing COVID-19 outbreaks in West Coast cities. The Centers for Disease Control and Prevention (CDC) issued stark warnings about an impending economic crisis.

pages: 364 words: 104,697

Were You Born on the Wrong Continent?
by Thomas Geoghegan
Published 20 Sep 2011

And if you lived in a city where they spike vodka with diphtheria, you’d be right to scoff at Zurich. What kind of kick could Zurich be? Still, as I walked the streets, I had to gasp: My God! I had never seen a city not just opulent but opulent in such an elegantly intelligent way. How could a continent like Europe change so much in ten years? I now saw what ten good years of GDP growth can do! Much of Europe, from Milan up to Stockholm, had climbed up to us, in America, and a few countries, like Norway, were even above us in GDP per capita. But that’s not the shock. It’s not the per capita on paper. It’s the per capita in the street. I mean, these are social democracies. The richest, like Sweden, are the most Red, i.e., on the left.

pages: 358 words: 106,729

Fault Lines: How Hidden Fractures Still Threaten the World Economy
by Raghuram Rajan
Published 24 May 2010

With inflation low and unemployment high, the Fed’s healthy-economy mandate suggested it should keep interest rates low. Indeed, given the level of unemployment and the consequent slack in the economy, Fed officials, including Ben Bernanke, openly worried about the possibility of deflation, even in mid-2003, when quarterly GDP growth was around 3 percent.3 The Federal Reserve seemed to be influenced by the recent experience of Japan, which had faced prolonged price deflation and slow growth in the 1990s as a result of the collapse of its real estate bubble. But this concern was misplaced: unlike Japan, the United States in 2001 had not experienced a debt crisis, only a meltdown of the overvalued tech stocks.

The Metropolitan Revolution: How Cities and Metros Are Fixing Our Broken Politics and Fragile Economy
by Bruce Katz and Jennifer Bradley
Published 10 Jun 2013

By 2025, McKinsey & Company estimates, 1 billion more people will have entered the global “consuming class,” meaning that they will have enough income to be consumers of global goods. The bulk of these consumers will live in cities outside of the United States and Europe. McKinsey estimates that of these 1 billion new urban consumers, 600 million will live in 440 cities in emerging markets, markets that will be responsible for half of global GDP growth between 2010 and 2025.45 That growth will contribute to an already large market for goods that exists outside the United States; according to the U.S. International Trade Administration, 70 percent of the world’s purchasing power is located outside the United States.46 Places that innovate will be able to take advantage of rising global demand for new kinds of products and services.

pages: 416 words: 108,370

Hit Makers: The Science of Popularity in an Age of Distraction
by Derek Thompson
Published 7 Feb 2017

Executives knew they had an awards show darling and thought perhaps it would slowly build an audience to match its critical reception. Finally, in its third season, the show’s average ratings perked up. In 1985, Cheers began an eight-year run as one of the top ten shows on TV. Hits have what economists call “multiplier effects.” If you introduce one dollar into an economy, it can produce more than one dollar of GDP growth. The same is true of hits: Growth begets growth, popularity begets popularity. The value of a hit television show is greater than its ratings or its ad rates alone, because those don’t account for an even more important feature: their ability to support other shows. The spillover effects of NBC’s patience in the mid-1980s were massive.

pages: 471 words: 109,267

The Verdict: Did Labour Change Britain?
by Polly Toynbee and David Walker
Published 6 Oct 2011

Kyoto seemed to promise concerted action but Labour’s attention soon wandered; it is hard to trace a green line through their policies on road, rail, housing and urban living. Later on, in a rare example of Blair–Brown harmony at the Gleneagles summit in 2005, the government sounded a fanfare over Sir Nicholas Stern’s powerful report. In it, the Treasury official argued that small cuts in GDP growth now could lessen climate change in the future. Save now for your grandchildren’s sake. Polls showed 60 per cent of adults felt climate change would have little or no effect on them personally, but 85 per cent reckoned the effect on future generations ‘would be a great deal or quite a lot’. The Stern report was influential abroad but Labour, devoted to economic growth, found his message too tough.

pages: 364 words: 99,897

The Industries of the Future
by Alec Ross
Published 2 Feb 2016

Driving through the hills of western Rwanda toward the capital city of Kigali, I regularly passed shoulder-high spools of fiber lining the road to lay a fiber-optic network better than those in much of the rural United States. It now connects all 30 of Rwanda’s districts with 1,000 miles of fiber, allowing a little country in the center of Africa to connect to the wider world and open a high-tech commodities exchange. If you look at the math, the strategy has worked. Between 2001 and 2013, real GDP growth averaged over 8 percent a year and poverty decreased substantially. Unlike many other economies (including the United States) where inequality has increased despite overall economic growth, Rwanda’s inequality has decreased over the past 15 years. Though not a favorite of journalists and (some) human rights advocates, Rwanda’s president, Paul Kagame, has taken a landlocked African country that exhibited the most savage behavior humanity is capable of and turned it into a nation with a functional economy and an innovation strategy at its core.

pages: 368 words: 32,950

How the City Really Works: The Definitive Guide to Money and Investing in London's Square Mile
by Alexander Davidson
Published 1 Apr 2008

King is seen to be of the school of thought that the growth in money supply, significant in 2007, could at least have some useful forecasting value in terms of assessing inflation. The Bank’s own forecasting model, the Bank of England Quarterly Model (BEQM), does not include an explicit role for money supply. Quarterly inflation report The Bank of England publishes a quarterly Inflation Report, which takes a retrospective look at recent progress and makes inflation and GDP growth forecasts. Various economists, including a shadow MPC through Times Online (www. timesonline.co.uk), make interest rate predictions before the MPC meeting. _______________________________________ THE BANK OF ENGLAND 15  Knock-on effect Once the MPC has changed the repo (repurchase agreement) rate, the retail banks tend to change their lending rates rapidly, often setting them at a margin above the base rate.

pages: 518 words: 107,836

How Not to Network a Nation: The Uneasy History of the Soviet Internet (Information Policy)
by Benjamin Peters
Published 2 Jun 2016

And yet the reforms did not work as hoped: GNP growth plunged from 8.4 percent in 1956 to 3.8 percent in 1957, the year of Khrushchev’s major reforms, and bounced around a 5 percent average until the Khrushchev-toppling disaster that was the poor harvest of 1963 (-1.1 percent decline, the only year with a negative GDP growth until the end of the Soviet Union).18 Cybernetic economists quickly learned a point that network theorist Alex Galloway has subsequently clarified: control does not necessarily dissipate with decentralized or distributed networks.19 It exists in the protocols and the (network) administrators and their rulings, and planning protocols were periodically scrambled.

pages: 385 words: 111,807

A Pelican Introduction Economics: A User's Guide
by Ha-Joon Chang
Published 26 May 2014

Foreign Direct Investments and Transnational Corporations (TNCs) Foreign direct investment has become the most dynamic component in the balance of payments In the last three decades, foreign direct investment (FDI) has emerged as the most dynamic element in the balance of payments. It has grown faster than international trade, albeit with a much greater fluctuation. Between 1970 and the mid-1980s, annual global FDI flows (measured in terms of inflows) were equivalent to around 0.5 per cent of world GDP.13 Since then, its growth accelerated relative to world GDP growth, until it went up to the equivalent of 1.5 per cent of world GDP in 1997. Then there was another acceleration in FDI flow, with the ratio reaching around 2.7 per cent of world GDP on average between 1998 and 2012, although with big fluctuations.14 What makes FDI particularly important is the fact that it is not a simple financial flow.

pages: 370 words: 111,129

Inglorious Empire: What the British Did to India
by Shashi Tharoor
Published 1 Feb 2018

Some of these criticisms are legitimate—indeed, I have made variants of them myself in my own books, though not in such extreme or trenchant terms—but one set of failings do not invalidate another. Nor can twenty decades of colonial oppression be undone in six; the record of Indian, indeed Congress, governments is in most respects vastly better than that of their British colonial predecessors in India, especially on such indices as GDP growth, literacy, poverty eradication, life expectancy and overcoming droughts and crop failures. History, in any case, cannot be reduced to some sort of game of comparing misdeeds in different eras; each period must be judged in itself and for its own successes and transgressions. The fact that reparations were a centrepiece of the Oxford debate added fuel to my critics’ fire.

pages: 416 words: 112,268

Human Compatible: Artificial Intelligence and the Problem of Control
by Stuart Russell
Published 7 Oct 2019

According to 2016 survey data, the eighty-eighth percentile corresponds to $100,000 per year: American Community Survey, US Census Bureau, www.census.gov/programs-surveys/acs. For the same year, global per capita GDP was $10,133: National Accounts Main Aggregates Database, UN Statistics Division, unstats.un.org/unsd/snaama. 56. If the GDP growth phases in over ten years or twenty years, it’s worth $9,400 trillion or $6,800 trillion, respectively—still nothing to sneeze at. On an interesting historical note, I. J. Good, who popularized the notion of an intelligence explosion (this page), estimated the value of human-level AI to be at least “one megaKeynes,” referring to the fabled economist John Maynard Keynes.

pages: 565 words: 122,605

The Human City: Urbanism for the Rest of Us
by Joel Kotkin
Published 11 Apr 2016

There are now 188,000 millionaire households among its residents, including a growing group of migrants from the rest of Asia, Europe, Oceania, and even America, who are attracted to the low-tax, clean, safe, and orderly city.3 This influx of foreigners and, even more so, their money, has created an importation of cultural riches from around the world, which has eroded local culture and, by many accounts, made life harder for ordinary Singaporeans. Even as GDP growth continues to chug along at somewhat close to 5 percent per annum, real wages for ordinary Singaporeans have stagnated.4 From 1998 to 2008, the income of the bottom 20 percent of households dropped an average of 2.7 percent, while the salaries of the richest 20 percent rose by more than half.5 The residents of this highly successful city-state are now among the most pessimistic of peoples, alongside the understandably dour residents of Greece, Spain, Cyprus, Slovenia, and Haiti.6 For many Singaporeans, discontent is leading them to consider a move elsewhere.

pages: 416 words: 106,532

Cryptoassets: The Innovative Investor's Guide to Bitcoin and Beyond: The Innovative Investor's Guide to Bitcoin and Beyond
by Chris Burniske and Jack Tatar
Published 19 Oct 2017

Figure 6.2 The efficient frontier of modern portfolio theory Source: https://www.ways2wealth.com/Portals/0/Images/Efficient%20Frontier.jpg?ver=2016-03-14-220603-923 Within the financial services industry, people talk about risk in two ways: systematic and unsystematic. Systematic risk is the risk inherent to investing in assets subject to the effects of macroeconomic events—like global gross domestic product (GDP) growth, trade relations, warfare, and so on. It is also known as undiversifiable risk because all assets are affected by it. Unsystematic risk, on the other hand, is the risk specific to each individual investment, such as market sector, management, product expansion, geographic exposure, and so on. It is also known as firm-specific risk and can be neutralized with a smartly constructed portfolio.

The Permanent Portfolio
by Craig Rowland and J. M. Lawson
Published 27 Aug 2012

This means that the economy in Canada could be very prosperous, yet at the same time the economy in the United Kingdom could be inflationary. Likewise, a period of deflation in Japan may have no effect at all on someone living in Australia. Table 12.1 illustrates this idea. We are going to take a limited look at the economic climates of several countries by central bank interest rate, inflation rate, unemployment rate, and GDP growth. The world economy is very diverse despite the recent hoopla around globalization and “the world is flat” mantras. Table 12.1 Every Country Has its Own Economic Conditions. The World is Definitely not flat. The world economy is very diverse despite the recent hoopla around globalization and “the world is flat” mantras.

pages: 343 words: 102,846

Trees on Mars: Our Obsession With the Future
by Hal Niedzviecki
Published 15 Mar 2015

Appearing at a 2014 United States Senate Committee on Appropriations Hearing on “Driving Innovation Through Federal Investments,” the umbrella organization released this statement: “While U.S. federal R&D investment was once on a consistent growth path, we are today coming nowhere close to that. Projected U.S. investments fall far short of GDP growth and even further below China’s rate of investment.”18 Following this came a 2015 report out of MIT called “Future Postponed,” which makes the case for massive increases in basic research funding and details fifteen areas where increasing funding could foster American innovation. The report, put together by a high-powered committee of scientists, was necessary because, as committee chair and MIT physicist Marc Kastner told journalists, science funding is “the lowest it has been since the Second World War as a fraction of the federal budget.”19 It’s a strange situation.

pages: 350 words: 109,521

Our 50-State Border Crisis: How the Mexican Border Fuels the Drug Epidemic Across America
by Howard G. Buffett
Published 2 Apr 2018

By 1996, the government of Mexico was pleased that total trade between the NAFTA partners increased to record levels, registering a total of $441 billion, an increase of 46 percent over 1993, and there were significant increases in trade between Mexico and the United States and Mexico and Canada. Mexico still had significant challenges. In 1994 a recalibration of the peso threw the economy into a tailspin, and GDP growth did not resume until 1997.6 There was political turmoil surrounding NAFTA, and in the long run it hurt people in rural areas where poor farmers were left to compete with ever-increasing imports from U.S. farmers. Low-skilled, uneducated farmworkers had limited job options, and many crossed into the United States illegally in order to work in agriculture and other jobs in the United States that paid more.

pages: 401 words: 109,892

The Great Reversal: How America Gave Up on Free Markets
by Thomas Philippon
Published 29 Oct 2019

Finally, when we compare the US with other countries, we use the International Standard Industrial Classification system (ISIC), organized by the United Nations. The principles underlying ISIC are similar to the ones of NAICS, and the US, Canada, and Mexico have tried to create NAICS industries that do not cross ISIC two-digit boundaries. Some differences remain, however, especially when we use granular definitions. B. UNDERSTANDING REAL GDP GROWTH Nominal GDP for the US measures the market value of goods and services in the current year, using current prices. The problem with nominal GDP is that the base level of prices is arbitrary. US nominal GDP was $19.5 trillion in 2017. That is, if you measure it in dollars. If you measured it in pennies, it would be 1,950 trillion pennies.

pages: 374 words: 111,284

The AI Economy: Work, Wealth and Welfare in the Robot Age
by Roger Bootle
Published 4 Sep 2019

In fact, they are usually building on foundations laid down by others. What’s more, although James Watt patented the first steam engine in 1769, it wasn’t until about a hundred years later that the full impact on labor productivity was felt. Similarly, it seems that electricity didn’t have a major impact on GDP growth in the USA until about a half-century after the first generating stations were built. Whatever the truth of these three counterarguments, the optimists have a fourth one up their sleeve. Far from running out of the capacity for radical technological changes, they say, we are on the brink of new developments that promise to bring rapid advances.

Capitalism, Alone: The Future of the System That Rules the World
by Branko Milanovic
Published 23 Sep 2019

It is not obvious, however, that the right would be at all comfortable with such a costly program and the high taxes it would imply. The UBI would have to have a built-in mechanism whereby not only would its amount increase with inflation, but there would be some link between its level and real GDP growth. For example, every two or three years, UBI could be increased by the same (or perhaps a lower?) percentage than the percentage that GDP per capita had gone up. Or it could be reduced when GDP per capita dropped. UBI implies a new philosophy of the welfare state The third problem is philosophical.

pages: 375 words: 105,586

A Small Farm Future: Making the Case for a Society Built Around Local Economies, Self-Provisioning, Agricultural Diversity and a Shared Earth
by Chris Smaje
Published 14 Aug 2020

My position in this book is in keeping with the degrowth project, but I argue for a strong focus on agriculture as the key point of energetic transformation. I also have some sympathy for mainstream economists who struggle to differentiate the unfamiliar new world of degrowth economics from the familiar scourge of negative gross domestic product (GDP) growth, or recession. Moving to a mature post-carbon human energetic ecosystem would probably involve junking billions of dollars of fossil fuel investment and infrastructure, which would take a lot of movement out of the global economy of both a fiscal and physical kind. It would generate multitudes of people looking for new kinds of localised, low-carbon work.

pages: 357 words: 107,984

Trillion Dollar Triage: How Jay Powell and the Fed Battled a President and a Pandemic---And Prevented Economic Disaster
by Nick Timiraos
Published 1 Mar 2022

Recognizing that the president hated high interest rates, Cohn also warned the president he should be prepared for rates to go up—especially if their tax and regulatory policies injected the “jet fuel” into the economy that Trump boasted about. The president’s goals were captured in a framed copy of The Wall Street Journal that hung in Mnuchin’s office. Trump had signed the edition announcing Mnuchin’s appointment with a black felt marker and inscribed an audacious aim: 5% GDP. The last time the GDP growth rate had broken 5 percent was in 1984, when Trump owned the New Jersey Generals of the United States Football League. During Trump’s first year in office, Cohn and Mnuchin had convinced him not to start a trade war when he needed pro-trade Senate Republicans to secure his push for $1.5 trillion in tax cuts.

pages: 492 words: 70,082

Immigration worldwide: policies, practices, and trends
by Uma Anand Segal , Doreen Elliott and Nazneen S. Mayadas
Published 19 Jan 2010

While in the early years of the economic boom returning Irish emigrants could meet the new and increasing demand for labor, a decrease in the the number of returning emigrants after 2000 has seen labor demands being met by immigrants from EU countries and beyond (Quinn and O’Connell, 2007). In considering Ireland’s approach to the 10 EU accession states, Doyle, Hughes, and Wadensjo (2006, p. 12) note that ‘‘even though the boom period of the Irish economy peaked around the turn of the century, at the time of accession the Irish economy was still in a strong position: GDP growth was the highest in Europe, at 4.5 percent, and unemployment, at 4.4 percent, was the lowest.’’ Ireland’s immigrant populations are a heterogeneous group whose diversity lies among other 210 Nations with Increasing Immigrant Populations things in their countries of origin, ethnic backgrounds, gender, age, and educational levels.

Official estimates placed unemployment at about 8.4% in 2000/2001 down from 9.2% in 1991/1992. Independent estimates push the number to 14% (Zohry 2002). However, to control 323 324 Nations with Low or Declining Immigrant Populations unemployment, Egypt will need to achieve a sustained real GDP growth rate of at least 6% per year. The economy has to generate between 600,000 and 800,000 new jobs each year in order to absorb new entrants onto the labor force. Between 1990 and 1997, however, only about 370,000 new jobs were created each year. The size of the informal sector and the level of overemployment in the public sector add to the complexity of the problem.

pages: 443 words: 112,800

The Third Industrial Revolution: How Lateral Power Is Transforming Energy, the Economy, and the World
by Jeremy Rifkin
Published 27 Sep 2011

National Geographic News. Retrieved from http://news.nationalgeographic.com/news/energy/2010/11/101109-peak-oil-iea-world-energy-outlook/. 11.BP Amoco Statistical Review of World Energy 2000. (2000, June 21). BP Global. Retrieved from http://www.bp.com/genericarticle.do?categoryId=2012968&contentId=2001815. 12.GDP Growth (Annual %). (n.d.). World Bank. Retrieved from http://data.worldbank.org/indicator/NY.GDP.MKTP.KD.ZG. 13.Blair, D. (2010, December 9). Oil Price Rise Puts Pressure on OPEC. Financial Times. http://www.ft.com/cms/s/0/cf79bac8-03bc-11e0-8c3f-00144feabdc0.html#axzz1IagH4LTi. 14.Pfeifer, S. (2011, January 4).

pages: 407 words: 114,478

The Four Pillars of Investing: Lessons for Building a Winning Portfolio
by William J. Bernstein
Published 26 Apr 2002

The American plot slopes upward at 3.6% per year, and the British at about 1.9% per year. (Incidentally, this plot places the eclipse of the British empire in 1871, when its GDP was exceeded by that of the U.S.—about a quarter of a century earlier than suggested by the plot of consol interest rates.) About two-thirds of the difference in GDP growth between the two nations can be accounted for by the higher American population growth, and the other third by our increasing edge in labor efficiency. The United States and Britain have been at the forefront of world technological progress for the past two centuries. What you are looking at is its flesh-and-blood track; it is also the engine of increasing stock prices.

pages: 421 words: 110,406

Platform Revolution: How Networked Markets Are Transforming the Economy--And How to Make Them Work for You
by Sangeet Paul Choudary , Marshall W. van Alstyne and Geoffrey G. Parker
Published 27 Mar 2016

By 2015, Singapore’s per capita GDP was $55,182, higher than that of the United States. During the fifty-five years from 1960 to 2015, Singapore’s annual growth rate was 6.69 percent, almost 2 percent higher than that of Malaysia, from which it separated in 1965.12 Similar evidence of the importance of good governance to wealth creation can be seen by comparing the GDP growth and innovation rates in communist East Germany and North Korea with those in their near-twin siblings, West Germany and South Korea.13 Good governance matters. MARKET FAILURE AND ITS CAUSES Good governance is important in both nation-states and platform businesses because absolutely free markets, in which people and organizations interact with no rules, restrictions, or safeguards, can’t always be relied upon to produce results that are fair and satisfactory to those involved.

pages: 387 words: 120,155

Inside the Nudge Unit: How Small Changes Can Make a Big Difference
by David Halpern
Published 26 Aug 2015

For example, in 2014, the UK’s Office for National Statistics, along with some other national statistical agencies, decided that GDP should include estimates for the value of the sex and illicit drug trades (and contributing to the extra bill the UK had to pay to the EU on account of its higher GDP!). Yet GDP does not include volunteering, the value of our time bringing up our children, or the natural and other capitals that often get depleted by growth. The clean-up of major oil spills counts as GDP growth, yet the depletion of the oil and the carbon it releases does not feature. Second, even in a modestly expanded classic model, the net result of individual ‘rational’ actors’ choices can lead to a reduction in utility or well-being. The overexploitation of the commons is a simple example – everyone overgrazes and destroys the commons.

pages: 401 words: 112,784

Hard Times: The Divisive Toll of the Economic Slump
by Tom Clark and Anthony Heath
Published 23 Jun 2014

George Osborne, Budget statement to the House of Commons by the Chancellor of the Exchequer, 22 June 2010. 26. The equivocation here is on the definition of ‘recession’, always an arbitrary business. One widely used convention (which has no basis in theory) is two successive quarters of negative GDP growth. Though simple, even this is not unambiguous. The latest unrounded official statistics available at September 2013 suggested that Britain's GDP declined for three successive quarters, between Q4 2011 and Q2 2012. Ambiguity arises because the decline in Q1 2012 is so tiny (a meaningless 0.01%) that the Office for National Statistics (ONS) rounds it to zero – which is entirely sensible because much larger declines are frequently revised away.

pages: 436 words: 114,278

Crude Volatility: The History and the Future of Boom-Bust Oil Prices
by Robert McNally
Published 17 Jan 2017

But once again, starting soon after the turn of the twenty-first century, tectonic shifts in global oil demand and supply began to reshape the oil market, subjecting oil producers, consumers, and governments to massive oil price volatility not seen since the 1920s and 1930s and shattering perceptions that OPEC could maintain oil price stability. On the demand side, global GDP growth picked up strongly between 2003 and 2007, averaging a healthy 5 percent per year. Strong economic activity caused oil consumption to grow by 6.5 mb/d (8 percent) over the period.1 Whereas consumption of oil had been rising by an average of 1.0 mb/d during 2000 through 2003, from 2004 to 2007 consumption rose by 1.6 mb/d, 60 percent faster.2 In China, demand exploded stemming from faster economic growth and rapid industrialization and urbanization.

pages: 393 words: 115,178

The Jakarta Method: Washington's Anticommunist Crusade and the Mass Murder Program That Shaped Our World
by Vincent Bevins
Published 18 May 2020

In Indonesia, this was the “Berkeley Mafia,” a set of economists trained at the University of California who worked with Suharto.1 In Brazil, the coup was aided by the conspiring and propagandizing of the US-funded Instituto de Pesquisas e Estudos Sociais (Research and Social Studies Institute), which remained active under the dictatorship until 1972. Both regimes were strongly influenced by Modernization Theory. And both countries began to experience economic growth. That was almost entirely sucked up by a small elite, but the GDP growth counted to foreign investors, and they could be sold as success stories. And in both cases, the countries had stable governments made up of local rulers who could trace their legitimacy to some Brazilian or Indonesian past, rather than appearing to their populations and the world as the obvious imposition of Washington.

pages: 501 words: 114,888

The Future Is Faster Than You Think: How Converging Technologies Are Transforming Business, Industries, and Our Lives
by Peter H. Diamandis and Steven Kotler
Published 28 Jan 2020

Taking advantage of these opportunities requires adaptation—which demands workforce retraining—yet the end result is a net gain in jobs. Look at the internet itself. According to research done by McKinsey, in thirteen countries stretching from China and Russia to the US, the internet created 2.6 new jobs for every 1 it destroyed. Overall, in each of these thirteen countries, the Web’s rise contributed 10 percent to GDP growth, and that number is still increasing. Make no mistake, certain jobs are heading for extinction. While experts predict technological unemployment will have a greater impact in the 2030s, the next decade could see whole categories of work start to become memories. Robots are coming for everyone from truckers and taxi drivers to warehouse workers and retail employees.

pages: 393 words: 115,217

Loonshots: How to Nurture the Crazy Ideas That Win Wars, Cure Diseases, and Transform Industries
by Safi Bahcall
Published 19 Mar 2019

Without the federal investment in the band theory of solids, for example, and techniques for growing high-quality germanium and silicon crystals, there would have been no transistor to launch the electronics age (more on the transistor later). Quantifying the impact of these discoveries, and separating the contribution of private vs. public investment, is difficult. But as one measure, economists have attributed roughly half of the trillions of dollars in US GDP growth since the end of World War II to technology improvements. Although neither Bush nor FDR could have foreseen the growth that would be created from “profitably employing” Bush’s ideas in times of peace, both did have practical business experience. Bush’s system, in fact, came from the business world.

pages: 374 words: 113,126

The Great Economists: How Their Ideas Can Help Us Today
by Linda Yueh
Published 15 Mar 2018

The IMF had urged Britain to reconsider imposing austerity before the economy had fully recovered. And not just Britain. The initial years of the recovery saw governments from Europe to America cutting public expenditure while private demand was weak. In the UK, the recovery was tepid and output even contracted at times. In fact, 2012 saw two non-consecutive quarters of negative GDP growth, although that’s not a recession since the formal definition requires two such consecutive quarters. In Britain, the pace of austerity had slowed alongside the economy, but was such a policy necessary? Part of the rationale for cutting government spending was that investors would not want to lend to the UK if it did not show that it was reducing its budget deficit.

Financial Statement Analysis: A Practitioner's Guide
by Martin S. Fridson and Fernando Alvarez
Published 31 May 2011

If growth continues at the same rate, however, the corporation will have to generate 59 million new unit sales to achieve a 40 percent gain in Year 10. In absolute terms, it is arithmetically possible for volume to increase indefinitely. On the other hand, a growth rate far in excess of the gross domestic product's annual increase is nearly impossible to sustain over any extended period. By definition, a product that experiences higher-than-GDP growth captures a larger percentage of GDP each year. As the numbers get larger, it becomes increasingly difficult to switch consumers’ spending patterns to accommodate continued high growth of a particular product. Market Share Constraints For a time, a corporation may overcome the limits of growth in its market and the economy as a whole by expanding its sales at the expense of competitors.

pages: 342 words: 114,118

After the Fall: Being American in the World We've Made
by Ben Rhodes
Published 1 Jun 2021

The phrase summed up a lot about the world America has built since the end of the Cold War as the urgency of the postwar decades and the shadow of nuclear holocaust faded. The first American presidential campaign after the Berlin Wall came down was driven by a slogan—“It’s the economy, stupid”—whose very effectiveness became a trap. GDP growth. Deficits. Gas prices. The markets. The politics of wealth creation. The wealth that funds politics. The wealthy and the politicians appearing on panel discussions at international conferences to discuss vague concepts of global security, global supply chains, and global sustainability in a world where consumption has made life on earth unsustainable.

pages: 463 words: 115,103

Head, Hand, Heart: Why Intelligence Is Over-Rewarded, Manual Workers Matter, and Caregivers Deserve More Respect
by David Goodhart
Published 7 Sep 2020

All of these things that shrink the space of democratic accountability may be justified in their own terms, but it is invariably true that when policies are removed from the national democratic arena, they are decided according to the values and priorities of the cognitive class—namely, international openness, income maximization, individualism, diversity, and so on. It is also the case that, on a personal level, many highly educated people are comfortable relinquishing sovereignty. They think they appreciate the trade-offs and benefits in GDP growth or in greater cooperation to combat climate change, and through their own friends and networks they may have connections to power. They also tend to have a high degree of agency in their own personal and professional lives, so they feel less directly diminished by the erosion of agency in the national political sphere.

pages: 458 words: 116,832

The Costs of Connection: How Data Is Colonizing Human Life and Appropriating It for Capitalism
by Nick Couldry and Ulises A. Mejias
Published 19 Aug 2019

See also historical colonialism; poverty Dodge, Martin, 21 DoubleClick (Google), 22 Douglass, Frederick, xviii Du Bois, W. E. B., 157 Duggan, Maeve, 248n120 Dussel, Enrique, 111, 157, 163, 203 Dutch East India Company, 95–96 Dyer-Witheford, Nick, 12 East India Company (British), 97–101, 109 Echo (Amazon), 23, 133 “ecologies,” 109, 262n22 economic issues: behavioral economics, 140, 249n145; China’s GDP growth, 104; data and emerging social order of capitalism, 19; economic value extracted from data, 7–12; economic violence, 106–8; generated by connection, 7; of gig economy, 13, 59–63, 108; ICT sector and GDP, 235–36n58; market capitalization of cloud computing companies, 37–38; market societies’ creation, 116–17; neuroeconomics, 141; relations between state and, 13; social interaction embedded in, 86; unequal global distribution of economic power, 14–15; wages-for-housework argument, 230n124.

pages: 412 words: 116,685

The Metaverse: And How It Will Revolutionize Everything
by Matthew Ball
Published 18 Jul 2022

If the Metaverse is, say, 10% of digital by 2032, and digital’s share of the world economy grows from 20% to 25% over that time, and the world economy continues to grow at an average of 2.5%, then in a decade, the Metaverse economy would be worth $3.65 trillion annually. This figure would also indicate that the Metaverse constituted a quarter of the growth in the digital economy since 2022, and nearly 10% of real GDP growth over that same time (much of the rest would stem from population increases and shifting consumer habits, such as buying more cars, consuming more water, and so on). At 15% of the digital economy, the Metaverse would be $5.45 trillion annually, a third of digital’s growth, and 13% of the world economy’s growth.

pages: 401 words: 112,589

Flowers of Fire: The Inside Story of South Korea's Feminist Movement and What It Means for Women's Rights Worldwide
by Hawon Jung
Published 21 Mar 2023

As many men believed the groundless myth that a vasectomy would hurt their sexual vigor,53 women ended up receiving most of the birth control procedures54—and enduring their side effects as well. Female contraceptive devices that had not been fully approved were imported for the state campaign,55* as officials set overambitious targets on birth control, mirroring their aggressive goals for industrial output and GDP growth. A vice economic minister in 1966 once pushed for a whopping one million IUD insertions for that year alone, and South Korea ended up inserting nearly 400,000 IUDs, an annual record.56 One person later described how women in her poor neighborhood paid the price for this mad rush, as they were pushed by officials to undergo IUD insertions or tubal ligations to show their “patriotism.”57 “I suffered a lot because my stomach hurt so much, and the infection wouldn’t heal for so long,” she said at a protest in 2017.

pages: 421 words: 120,332

The World in 2050: Four Forces Shaping Civilization's Northern Future
by Laurence C. Smith
Published 22 Sep 2010

Taking an average of these percentile rankings provides the composite score in the right-most column of the table. 432 Each index has its own agenda, which is why I prefer to look at all of them. Jeffrey Sachs, for example, questions the contention in Index of Economic Freedom that trade liberalization necessarily leads to GDP growth, citing examples, like China, which have very strong economic growth despite low scores on the index. J. Sachs, The End of Poverty: Economic Possibilities for Our Time (New York: Penguin Group, 2005), 416 pp. 433 Most oil and gas outfits operating in the northern high latitudes are private multinational companies, except in the Russian Federation, where the industry is increasingly returning to state control. 434 The 2010 Economist Intelligence Unit assessed 140 countries in their global livability index.

pages: 353 words: 355

The Long Boom: A Vision for the Coming Age of Prosperity
by Peter Schwartz , Peter Leyden and Joel Hyatt
Published 18 Oct 2000

Income per person has grown by 6 percent a year. Driven by this fevered pace, China's share of the world's GDP has doubled to 10 percent. And its GDP per person has risen from a quarter to half the world average. Looking ahead, Angus Maddison, an economic historian, estimates that even if Chinese GDP growth slows to 5.5 percent a year, which seems reasonable given other Asian countries' growth at comparable stages of development, China will match the GDP of the United States by 2015. The Chinese economy will then compose 17 percent of the world's GDP, and income per person—all billion-plus of them— would match the world average.

pages: 397 words: 121,211

Coming Apart: The State of White America, 1960-2010
by Charles Murray
Published 1 Jan 2012

First-place votes for short working hours more than doubled to 9 percent. “No danger of being fired” doubled to 12 percent, with another 13 percent ranking it in second place. There is no reason to think that the 2006 results were a fluke. Unusual economic troubles don’t explain them—the national unemployment rate stood at a low 4.6 percent and GDP growth was a healthy 6.1 percent. The results are not a function of something peculiar about the 30–49 age group; they persisted when I looked at older and younger respondents. Still, it’s just one survey, and I wish we had corroborating evidence of such large changes in other recent GSS surveys. So I will leave it at this: We can’t be sure, but it looks as if during the last half of the 1990s and the first half of the 2000s, whites by their own testimony became less interested in meaningful work and more interested in secure jobs with short working hours.

pages: 481 words: 120,693

Plutocrats: The Rise of the New Global Super-Rich and the Fall of Everyone Else
by Chrystia Freeland
Published 11 Oct 2012

And it made sense that it was an airline, the business Neeleman knows. But for his third big play, Neeleman left the United States for Brazil. “Well, the U.S., like I said, it’s kind of tapped out,” Neeleman told me in the fall of 2010. “We’re growing [in Brazil], us and our competitors, 25 percent a year. That’s three times GDP growth, which in the first half of last year was almost 9 percent. And we’re growing traffic 27 percent. So that’s exciting. You know, if I was here in the U.S., we would be still trying to fight it out with other established carriers, whereas down there, I’m flying routes that had never had nonstop flights.

pages: 403 words: 125,659

It's Our Turn to Eat
by Michela Wrong
Published 9 Apr 2009

How did these organisations manage to persuade themselves the Githongo dossier was of such limited relevance to their funding programmes? By taking the long view and fixating selectively on statistics. ‘The trajectory is positive, the direction of travel is correct,’ aid officials chorused when I interviewed them in Nairobi, pointing to GDP growth averaging 6 per cent over four years, such a relief after the minus scores of the Moi administration. Of course Anglo Leasing had been very depressing, but – and here they began to sound worryingly like NARC politicians – it was important to remember that more than half the eighteen suspect contracts had been signed under the previous administration.

pages: 413 words: 119,587

Machines of Loving Grace: The Quest for Common Ground Between Humans and Robots
by John Markoff
Published 24 Aug 2015

Samsung has 270,000 employees. Comcast has 126,000. And so on.”34 And even O’Reilly’s point doesn’t begin to capture the positive economic impact of the Internet. A 2011 McKinsey study reported that globally the Internet created 2.6 new jobs for every job lost, and that it had been responsible for 21 percent of GDP growth in the five previous years in developed countries.35 The other challenge for the Kodak versus Instagram argument is that while Kodak suffered during the shift to digital technologies, its archrival FujiFilm somehow managed to prosper through the transition to digital.36 The reason for Kodak’s decline was more complex than “they missed digital” or “they failed to buy (or invent) Instagram.”

pages: 494 words: 116,739

Geek Heresy: Rescuing Social Change From the Cult of Technology
by Kentaro Toyama
Published 25 May 2015

Ironically, the “Hindu rate of growth” was once a term of derision used by Indian intellectuals to complain about the country’s 1.3 percent per year growth in per capita income, a snail’s pace that lasted from independence in 1947 through the 1980s. In the 1990s, though, the Indian economy took off. From 1992 to 2010, India’s GDP growth averaged 6 to 7 percent a year, at times hitting 8 or 9 percent even during the global recession. If Weber were born a hundred years later and 6,000 kilometers southeast, he might have overlooked Protestant worldly asceticism as the cause of rational industry, and instead pointed to a Hindu ethic to work uncomplainingly at the task at hand.

pages: 432 words: 124,635

Happy City: Transforming Our Lives Through Urban Design
by Charles Montgomery
Published 12 Nov 2013

And yet the boom decades of the late twentieth century were not accompanied by a boom in happiness. Surveys show that people’s assessment of their own well-being in the United States pretty much flatlined during that time. It was the same with citizens in Japan and the United Kingdom. Canada fared only slightly better. China, the new star of supercharged GDP growth, is providing yet more evidence of a paradox. Between 1999 and 2010, a decade in which average purchasing power in China grew more than threefold, people’s ratings of their own life satisfaction stalled, according to Gallup polls (although urbanized Chinese were happier than their rural cousins).

pages: 288 words: 16,556

Finance and the Good Society
by Robert J. Shiller
Published 1 Jan 2012

But China, India, and Russia have seen a ourishing of nancial sophistication and amazingly high economic growth rates. And it is not just these countries. According to International Monetary Fund data, the entire emerging world—including the Commonwealth of Independent States, the entire Middle East, Sub-Saharan Africa, and Latin America—has proved able to generate annual gross domestic product (GDP) growth of over 6% during the past decade, when not compromised by world financial crises.5 In addition, a host of international agreements have created institutions that work for the betterment of humankind using sophisticated nancial tools. The World Bank, founded in 1944 and today expanded into the massive World Bank Group, has engraved on its headquarters in Washington, D.C., the motto “Working for a World Free of Poverty.”

pages: 504 words: 126,835

The Innovation Illusion: How So Little Is Created by So Many Working So Hard
by Fredrik Erixon and Bjorn Weigel
Published 3 Oct 2016

For example, economists George Graetz and Guy Michaels found that industrial robots increased growth rates, wages, and total factor productivity in their study of the impact of utilizing robots in 17 countries between 1993 and 2007. The economic growth effect of robots was 0.37 percent on average, which equals about 10 percent of all GDP growth in that period. While the authors found some evidence that robots reduced the hours worked by both low-skilled and semi-skilled labor, there was no significant effect on the total number of working hours.83 President Obama famously erred on the wrong side of the economics of robots and machines in 2011 when he blamed American joblessness on automation.

pages: 416 words: 124,469

The Lords of Easy Money: How the Federal Reserve Broke the American Economy
by Christopher Leonard
Published 11 Jan 2022

In the 1990s, labor productivity in the United States increased at an annual average rate of 2.3 percent. During the decade of ZIRP, it rose by only 1.1 percent. Real median weekly earnings for wage and salary employees rose by 0.7 percent on average annually during the 1990s, but rose by only 0.26 percent during the 2010s. Average real GDP growth, a measure of the overall economy, rose an average of 3.8 percent annually during the 1990s, but by only 2.3 percent during the recent decade. The only part of the economy that seemed to benefit under ZIRP was the market for assets. The stock market more than doubled in value during the 2010s. Even after the crash of 2020, the markets continued their stellar growth and returns.

pages: 424 words: 119,679

It's Better Than It Looks: Reasons for Optimism in an Age of Fear
by Gregg Easterbrook
Published 20 Feb 2018

Surgery of the 1950s is treated by the GDP formula as the same as surgery of today, though in almost all cases today’s surgery achieves better results with less suffering. In the 1950s, a third of American retirees were impoverished. By 2013 the fraction was down to 9 percent, still too high, but a vast social improvement not reflected in GDP growth statistics. Feldstein contends that adjusting for rising quality of life and for products that are safer and more reliable—today’s cars are much less likely to kill their drivers and passengers than cars of a generation ago, while more likely to start in the morning—the rate of growth in the United States is in good shape by every measure except one: pretax income.

pages: 550 words: 124,073

Democracy and Prosperity: Reinventing Capitalism Through a Turbulent Century
by Torben Iversen and David Soskice
Published 5 Feb 2019

The problem is rather that ICT technology is not sufficiently transformative to lead to rapid productivity growth, and hence to major improvements in living standards. If the state is constrained, it is because of a crunch on public finances. We count Piketty (2014) as the ultimate pessimist. Like Gordon, he believes that the capacity of technology to produce high rates of GDP growth is low. Specifically, he argues that “global growth is likely to be [only] around 1.5 percent a year between 2050 and 2100” (355). At the same time, he believes that capital is becoming more mobile and that “fiscal competition will gradually lead to total disappearance of taxes on capital in the twenty-first century.”

pages: 437 words: 126,860

Case for Mars
by Robert Zubrin
Published 27 Jun 2011

During the decade of the 1960s, NASA spending averaged a bit more than 2.25 percent of federal spending (it peaked at nearly 4 percent of federal spending in 1964). During the same years, the U.S. economy in GDP constant dollars grew on average about 4.6 percent a year. During the early 1970s, NASA’s share of the federal budget dropped to below 1 percent of federal spending, where it has remained ever since. Simultaneously, the GDP growth rate has dropped to less than 2 percent. The J.F.K. model is a proven success; successful both at realizing an impossible dream of getting humans to the Moon and in generating the greatest period of economic growth in the United States’ post-war economic history. Today, however, the question may well be asked if the nationalistic foundations that supported Apollo exist in the current era.

pages: 516 words: 116,875

Greater: Britain After the Storm
by Penny Mordaunt and Chris Lewis
Published 19 May 2021

But although the global goods trade has flattened and cross-border capital flows have declined sharply since 2008, globalisation is not heading into reverse. Rather, it is entering a new phase defined by soaring flows of data and information. Remarkably, digital flows which were practically non-existent just fifteen years ago now exert a larger impact on GDP growth than the centuries-old trade in goods.21 The world is becoming more connected than ever. The nature of its connections, though, has changed in a fundamental way. Cross-border bandwidth has grown forty-five times since 2005. It’s projected to increase an additional nine times over the next five years as flows of information (searches, communication, video, transactions and intracompany traffic) continue to grow.

The Party: The Secret World of China's Communist Rulers
by Richard McGregor
Published 8 Jun 2010

Now that you’ve stabilized your official position and seized a lot of money, you can enjoy being flattered by appointing some kiss-asses around you. The ass-kissing is actually an art. And you’ll find yourself addicted to it. The fifth is ‘appointing on the ability to brag’. The retired official said the GDP growth in his region had all been exaggerated. Every year when it’s time to report the annual GDP, no one wants to be the first to report. Why? If you report your growth as 11%, the one that follows you to report can say 11.5%, which surpasses you on the performance. Your superior would like a fast-growing GDP, yet you can’t exaggerate too unreasonably, otherwise it’d embarrass your superior.

pages: 451 words: 125,201

What We Owe the Future: A Million-Year View
by William MacAskill
Published 31 Aug 2022

Assuming that on average a person conceives one child in their lifetime, then a conception event occurs about once every twenty-nine thousand person-days. 18. Broome 2004, Chapter 10; Greaves 2017. 19. Roberts 2021. 20. Parfit 1984, 378–441. 21. Broome 1996, Section 4. For example: “If population growth and per capita GDP growth are completely independent, higher population growth rates would clearly lead to higher economic growth rates. It would still be true that, as noted by Piketty (2014), only the growth in per capita GDP would give rise to improvements in economic wellbeing” (Peterson 2017, 6). Ord (n.d.) discusses additional examples.

pages: 385 words: 133,839

The Coke Machine: The Dirty Truth Behind the World's Favorite Soft Drink
by Michael Blanding
Published 14 Jun 2010

Page 230 water pooled by the side of the highway: Nantoo Banerjee, The Real Thing: Coke’s Bumpy Ride Through India (Kolkata, India: Frontpage, 2009), 79. Page 231 “nothing would grow”: Nandlal and Vishwakarma, interviews by the author. Page 231 water shortages in 2002: Shankkar Aiyar, “The Impact: Thirst Aid,” India Today, 2002; “Indian Economy: General Review,” Finance India, March 2003; “Drought May Undo Govt’s Plans for High GDP Growth,” Press Trust of India, July 25, 2004. Page 231 one of ninety-seven wells that Lok Samiti says: R. Chandrika, “Decreasing Water Levels: Status of Water Table in Mehdiganj and Surrounding Villages, Varanasi, U.P. (August 2006),” Lok Samiti Varanasi. Page 231 villagers staged their first rally: Nandlal, interview by the author; Mukesh Prabhan, president of Nagepur village committee, interview by the author.

pages: 515 words: 126,820

Blockchain Revolution: How the Technology Behind Bitcoin Is Changing Money, Business, and the World
by Don Tapscott and Alex Tapscott
Published 9 May 2016

Eventually sophisticated personal data query services will not even be able to read that data because it will be given to them encrypted. Still they will be able to answer questions regarding that data by asking those questions of the encrypted data itself using homomorphic encryption techniques. 26. Leading thinkers have a broad view of prosperity that goes beyond GDP growth. Harvard’s Michael Porter has created a social progress imperative http://www.socialprogressimperative.org. Economist Joseph Stiglitz and others have researched measures beyond GDP—http://www.insee.fr/fr/publications-et-services/dossiers_web/stiglitz/doc-commission/RAPPORT_anglais.pdf. There are other efforts that try to improve GDP but stay closer to home—http://www.forbes.com/sites/realspin/2013/11/29/beyond-gdp-get-ready-for-a-new-way-to-measure-the-economy/. 27.

pages: 403 words: 132,736

In Spite of the Gods: The Rise of Modern India
by Edward Luce
Published 23 Aug 2006

Already India’s savings ratio is improving—from about 18 percent of gross domestic product in 1990 to 26 percent in 2006. This is still well below China’s savings rate of more than 40 percent. But China’s rate is falling, while India’s is rising. India is also improving its economic efficiency. It has achieved between 6 and 8 percent GDP growth with a savings rate of between a fifth and a quarter of national income. Growth in China has been comparatively expensive. Furthermore, India has accomplished high growth without any of the tools of an autocratic state. No government in a democracy can impose compulsory savings on its population—as happened in much of east Asia—and hope to be reelected.

pages: 890 words: 133,829

Sardinia Travel Guide
by Lonely Planet

Ballu a Tre Passi (Three-Step Dance; 2003) Four snapshots of life in Sardinia, with some beautiful shots of the Costa del Sud. La Destinazione (The Destination; 2003) The story of a young Italian carabinieri (police officer) sent to a remote Sardinian village in Barbagia to investigate the murder of a shepherd. Population 1.67 million Area 24,090 sq km GDP Per Capita €17,162 GDP Growth -0.5% Inflation 0.8% Unemployment 17.5% History Sitting between Europe and Africa, Sardinia's strategic position and rich mineral reserves have brought tidal waves of power-hungry invaders to its shores; while its rugged, impenetrable mountains have attracted everyone from Stone Age men to 19th-century bandits in hiding.

pages: 494 words: 132,975

Keynes Hayek: The Clash That Defined Modern Economics
by Nicholas Wapshott
Published 10 Oct 2011

By Laffer’s reckoning, Reagan’s tax cuts proved every bit as effective as the Kennedy tax cuts. In the four years after Kennedy’s cuts reduced the top rate from 90 percent to 70 percent, growth in real federal income tax revenue leapt from 2.1 percent in the previous four years to 8.6 percent. Real GDP growth rose from 4.6 percent to 5.1 percent in the same period, and the unemployment rate fell from 5.8 percent in January 1962 to 3.8 percent in December 1966. Reagan’s tax cuts were deeper. He sliced income taxes 25 percent across the board, with tax rates for the highest earners slashed from 70 percent in 1981 to 28 percent in 1988.

pages: 436 words: 141,321

Reinventing Organizations: A Guide to Creating Organizations Inspired by the Next Stage of Human Consciousness
by Frederic Laloux and Ken Wilber
Published 9 Feb 2014

Due to lack of an alternative, it’s a safe bet to assume that society (and thus Teal Organizations) will have to operate near the ideal of a closed-loop economy with zero waste, zero toxicity, and 100 percent recycling. Alternative consumerism Zero economic growth does not mean no growth. The tragedy of our times is that we’ve mistaken prosperity with growth. Teal societies might have zero or even negative GDP growth but be much richer emotionally, relationally, and spiritually. In all these domains, we can pursue growth and never worry about hitting a wall. Given all we know about people operating from the Evolutionary-Teal perspective, we can safely predict that a Teal society will look back and find today’s consumerism mindless.

pages: 545 words: 137,789

How Markets Fail: The Logic of Economic Calamities
by John Cassidy
Published 10 Nov 2009

The meeting began with a presentation by the Fed’s economic staff about the possibility of a Japanese-style deflation, in which prices would fall and the economy would stagnate for a prolonged period despite extremely low interest rates. In the previous few months, the annual rate of consumer price inflation had dipped toward 2 percent, payrolls had fallen, and GDP growth had been weak, partly because of fears of a war in Iraq, which had duly arrived in March. The stuttering economy had left the Fed in a bind. With the funds rate already at its lowest level since the 1960s, there were doubts about how much further the central bank could go to stimulate spending.

pages: 448 words: 142,946

Sacred Economics: Money, Gift, and Society in the Age of Transition
by Charles Eisenstein
Published 11 Jul 2011

Of course, as advertising has become cheaper, it has also become more ubiquitous; even so, the total size of the ad industry has peaked. Yes, we are passing through the time of “peak advertising” as the commons of the public attention has been saturated. I hope you aren’t too sad about the end of growth in advertising, which has been a major contributor to GDP growth. Meanwhile, many of the traditional functions of advertising and marketing which were once paid services are now being met for free through social networking. Similarly, the blogosphere has taken over many of the functions of traditional news distribution, but again at much less cost. The same is true of travel agency, stock brokerage, and many other industries where brokers and agents are no longer necessary.

pages: 501 words: 134,867

A Line in the Tar Sands: Struggles for Environmental Justice
by Tony Weis and Joshua Kahn Russell
Published 14 Oct 2014

Yet even as TNCs pour billions of dollars into attempts to discover new sources of fossil fuels, the reality is that global climate stability cannot withstand the CO2 emissions this would entail. Just as capitalist economic growth has mirrored fossil fuel consumption, so too have world CO2 emissions mirrored world GDP growth.11 However, climate scientists are warning in ever-stronger terms that the window to radically reduce annual CO2 emissions to a level that might mitigate dangerous levels of climate instability is fast closing. The result is that petro-capitalism on a world scale is currently running out of cheap and easy oil supplies at the same time that it is running up against its climatic limits.

pages: 433 words: 127,171

The Grid: The Fraying Wires Between Americans and Our Energy Future
by Gretchen Bakke
Published 25 Jul 2016

With such systemic “shock absorbers,” as Amin calls them, in place, no day was ever too hot, no peak load too pointy, for the grid’s infrastructure to absorb. Granted, there were fewer people in the United States twenty-five years ago, fewer air conditioners, and even fewer disastrously hot days. But even given these changes, had utility investment in infrastructure kept pace with population growth and GDP growth, peak-load days would simply not be the sort of panic-inducing and blackout-causing affairs that they are today. In a way the utilities are right in paring back. Having 30 percent of one’s power plants just sitting there 359 or so days a year, and 30 percent of the carrying capacity of one’s lines equally left unused “just in case,” is wasteful in all kinds of ways.

Making Globalization Work
by Joseph E. Stiglitz
Published 16 Sep 2006

I do not believe it is tenable to pretend that everything will be fine if we just leave the markets alone. Nor is it tenable to ask workers to have faith that, with enough patience, globalization will make them all better off, even though now they must accept lower wages and decreased job security. Even if they were to accept on faith the proposition that globalization will lead to faster GDP growth, why should they believe that it would lead to faster growth in their incomes or an overall increase in their well-being? While politicians may refer obliquely to lessons of economics to reassure their constituents, both standard economic theory and a wealth of data is consistent with workers’ own intuitions: without strong government redistributive policies, unskilled workers may well be worse off.

How I Became a Quant: Insights From 25 of Wall Street's Elite
by Richard R. Lindsey and Barry Schachter
Published 30 Jun 2007

Back in New York, my first job was as an economist at the Federal Reserve Bank of New York, in a department quaintly named the Industrial Economies Division, in contrast to the Developing Economies Division. Today, I suppose, I would be working in the Service Economies Division and the emerging markets area would be Industrial Economies Division. The group’s responsibility was to forecast GDP growth, inflation, and macroeconomic conditions generally in Western Europe. At the same time, I enrolled, again, in a doctoral program in economics, this time at Columbia University. Even against my history of poor choices, the decision to simultaneously begin a PhD program and a professional career stands out.

Science Fictions: How Fraud, Bias, Negligence, and Hype Undermine the Search for Truth
by Stuart Ritchie
Published 20 Jul 2020

When this was corrected, along with amendments to another couple of debatable analytic choices Reinhart and Rogoff had made, the relation between the debt ratio and growth changed dramatically.6 The paper had said average growth above the 90 per cent ratio was −0.1 per cent; after the corrections it was +2.2 per cent. There was nothing magic about that 90 per cent number after all; growth didn’t suddenly turn negative after that threshold. In reality, there was ‘a wide range of GDP growth performances at every level of public debt’.7 If it had always had a more circumspect claim like this, one much more complicated than the original stylised fact, it’s hard to imagine the paper would have received so much attention. So, did a typo change the world economy? Not exactly. Although the paper, and its stylised ‘fact’, had an unusually wide influence, the case for keeping the debt-to-GDP ratio low doesn’t hinge on a single study.8 The discovery of the typo just weakened, rather than completely invalidated, Reinhart and Rogoff’s conclusions.

Apocalypse Never: Why Environmental Alarmism Hurts Us All
by Michael Shellenberger
Published 28 Jun 2020

“Most countries of Africa are too poor to be experiencing de-industrialisation,” writes Rodrik, “but that is precisely what seems to be taking place.”78 One exception is Ethiopia, which has attracted Calvin Klein, Tommy Hilfiger, and fast-fashion leader H&M,79 both because of its low wages compared to places like China and Indonesia, where they have risen, as well as to its investments in hydroelectric dams, the electricity grid, and roads.80 “Ethiopia has experienced GDP growth of more than 10 percent per annum over the last decade,” notes Rodrik, “due in large part to the increase in public investment, from 5 percent to 19 percent of GDP.”81 Ethiopia had to end and recover from a bloody seventeen-year civil war, which resulted in at least 1.4 million deaths, including one million from famine, before its government could invest in infrastructure.

pages: 462 words: 129,022

People, Power, and Profits: Progressive Capitalism for an Age of Discontent
by Joseph E. Stiglitz
Published 22 Apr 2019

Indeed, in 2016, Canada’s growth was little different from that of the US. If anyone had cause to trumpet their success, it was Canada’s Prime Minister Justin Trudeau, not Trump. In 2018, America experienced a “sugar high” as a result of a massive increase in the fiscal deficit, resulting in real GDP growth of around 3 percent. But the spurt was not anticipated to be sustainable; 2019 growth is expected to be markedly lower. 17.And almost since the time the country was founded, many American leaders have considered the struggle against inequality essential for creating a thriving democracy. Sean Wilentz has written the definitive history of inequality and politics in the US.

pages: 496 words: 131,938

The Future Is Asian
by Parag Khanna
Published 5 Feb 2019

As in India, Singapore leads all foreign investors in Indonesia, where high-quality industrial parks make the country more attractive for global investors looking to diversify production away from China. Indonesia is also forcing foreign investors to transfer technology to its mining companies. Foreign investment raises labor productivity in both industrial and services sectors, such as telecoms and hospitality, that employ more than 60 million people and represent half the country’s GDP growth. Taking advantage of Jakarta’s 500,000 informal motorcycle taxis, Go-Jek leveraged Singaporean and US investment to professionalize into a full-scale logistics operation with integrated mobile payments (GoPay). Not only did the company beat its five-year growth forecast in less than a year, but a half-million drivers joined the formal economy and tax base.

pages: 371 words: 137,268

Vulture Capitalism: Corporate Crimes, Backdoor Bailouts, and the Death of Freedom
by Grace Blakeley
Published 11 Mar 2024

The neoliberals sought to figure out how political power could be modeled on the idea of the market—how the principles of economics could be used to judge how a government was performing.125 At this point the market becomes what Foucault calls “a site of truth”—we begin to judge political outcomes according to the principles of economics. For example, if GDP growth is high, we assume the government is doing well—despite the fact that most people have no idea what GDP actually is, or whether it’s a good measure of social progress. (It’s not.)126 The neoliberals were some of the first to realize that the capitalist state’s challenge is not figuring out when and when not to govern, but how to govern everything in exactly the right way.

pages: 488 words: 144,145

Inflated: How Money and Debt Built the American Dream
by R. Christopher Whalen
Published 7 Dec 2010

The weakness of the dollar and the sharp increase in energy costs imposed a heavy tax on the global economy in terms of lowered growth prospects. But equally harmful to many exporting nations was the steady decline in the value of the dollar, which had become unstable as early as 1967–1968 when gold flows from the United States increased. GDP growth in the U.S. was cut in half, unemployment rose, and the visible level of inflation also surged from low single-digits to twice those levels and more. David Gordon described the chaos and uncertainty caused by the final interment of Bretton Woods in 1994: When Bretton Woods was formally buried in 1973, the dollar was still apparently overvalued, resulting in a continuing decline of 2.9 percent per year in 1973–1979.

pages: 535 words: 158,863

Superclass: The Global Power Elite and the World They Are Making
by David Rothkopf
Published 18 Mar 2008

The World Bank’s Branko Milanovic has argued that measuring intracountry income gaps is a useful metric when testing the effectiveness of policies. By this measure, inequality has been on the rise for almost seven decades, with a period of “steady and sharp” increase between 1982 and 1994. Some of the lower-income countries, like those in sub-Saharan Africa, have struggled with negative per capita GDP growth for a quarter century, while the developed, free-trading countries of the Organisation for Economic Cooperation and Development have seen their fortunes rise over the same period. However, as Milanovic notes, if you look at this metric and weight the increases by population size, global inequality can be seen to have declined.

India's Long Road
by Vijay Joshi
Published 21 Feb 2017

In the second phase, 1980–​ 2015, economic strategy moved towards greater marketization, at first hesitantly, then more explicitly. The change in policy orientation was quite pronounced but it was also incomplete and lop-​sided. As a result, [ 16 ] Setting the Stage 17 Table 2.2 SELECTED PHASES OF GDP GROWTH (1) (2) (3) Growth Rate (% per annum) Investment (% GDP) Capital-​Output Ratio (col. 2 /​col. 1) 1951/​52–​1964/​65 3.9 12.5 3.2 1965/​66–​1979/​80 2.9 16.6 5.7 1980/​81–​1992/​93 5.2 20.5 3.9 1993/​94–​2002/​03 6.0 24.6 4.1 2003/​04–​2010/​11 8.5 34.5 4.1 2011/​12–​2014/​15 5.4 33.0 6.1 Notes: In columns (1) and (2), the figures for 1951/​52 to 2013/​14 are from the 2004/​5 national accounts series.

pages: 467 words: 154,960

Trend Following: How Great Traders Make Millions in Up or Down Markets
by Michael W. Covel
Published 19 Mar 2007

Henry7 8 Trend Following (Updated Edition): Learn to Make Millions in Up or Down Markets presidency, somebody asked me about the stock market, and I thought I was a financial genius, and it was a mistake (laughter). The fundamentals of this nation are strong. One of the interesting developments has been the role of exports in overall GDP growth. When you open up markets for goods and services, and we’re treated fairly, we can compete just about with anybody, anywhere. And exports have been an integral part, at least of the 3rd quarter growth. But far be it for me—I apologize—for not being in the position to answer your question. But I don’t think you want your President opining on whether the Dow Jones is going to—(laughter)—be going up or down.”

pages: 632 words: 159,454

War and Gold: A Five-Hundred-Year History of Empires, Adventures, and Debt
by Kwasi Kwarteng
Published 12 May 2014

It was unrealistic to expect China to pay for much of Europe’s bloated state spending. Even by early 2014 the Western world had not fully overcome the events of 2008, though there were signs of recovery in some countries, notably Britain and the United States. Britain had, between 2008 and 2013, experienced its worst downturn ever, longer, when measured in terms of GDP growth, than its depression in the 1930s. In nearly all Western countries, the appetite for what Alan Greenspan called ‘politically toxic cuts’ remained muted as centre-left governments won power in France in 2012 and in Italy in 2013.16 President Obama, a Democrat whom many saw as being on the left of his party, won an easy re-election battle for the US presidency in 2012.

Investment: A History
by Norton Reamer and Jesse Downing
Published 19 Feb 2016

See Uniform Management of Institutional Funds Act ummianum (financier), 51–52 unemployment, rise in, 198 Uniform Management of Institutional Funds Act (UMIFA), 124 Uniform Prudent Management of Institutional Funds Act (UPMIFA), 124 Union Army pensions, 105 United Auto Workers (UAW), 111–12 United Kingdom: GDP growth and, 75; mergers in, 182; stock Index 435 ownership in, 96; venture capital in, 279. United States: capital in, 80–82; public markets and, 88–89, 97; stock ownership in, 90–94, 97 university endowments, 257, 271, 296, 328 UPMIFA. See Uniform Prudent Management of Institutional Funds Act Ur dynasty, 16 usurer (kusidin), 39 usury: Asian societies and, 38–39; attitudes about, 8; in China, 39; Christianity and, 34–37; contemporary views of, 39; in Greece, 33; historical and religious views of, 33–34, 60; in India, 38–39; Islamic societies and, 37–38; Jews and, 34–35; in Mesopotamia, 33; in Rome, 33–34; world views on, 32–33 valuation, 228 value managers, 140 Vanderbilt, Cornelius, 178–79 Vanderbilt, William, 161 Vanguard, 284–85, 299 van Ketwich, Abraham, 140 Varian, 279 vedia (capital), 55 venture capital, 277–80, 278, 279 Vereenigde Oostindische Compagnie (VOC).

Lonely Planet Panama (Travel Guide)
by Lonely Planet and Carolyn McCarthy
Published 30 Jun 2013

The rest of the country joined Colón in solidarity marches and protests. When chaos hit a fever pitch with riots and looting in the capital, the controversial plans were scrapped. For Panama, it’s time to put more focus on community interests. Population: 3.5 million Area: 75,420 km2 GDP: 55.8 billion GDP Growth: 8.5% Inflation: 6.1% Unemployment: 4.4% History The crossroads of the Americas, the narrow isthmus of Panama has always played a central and even strategic role in the history of the Western Hemisphere, from hosting the biological exchange of species to periodic encounters – and clashes – between many cultures.

pages: 543 words: 147,357

Them And Us: Politics, Greed And Inequality - Why We Need A Fair Society
by Will Hutton
Published 30 Sep 2010

Meanwhile, the option of default would wreck the country’s international financial standing (and it has not been adopted as a strategy in Britain since the fourteenth century). Thus only two options remain: inflation and belt-tightening. Unless the Bank of England’s 2 per cent inflation target is abandoned, the decade therefore begins with the economy facing a prolonged six–seven-year period of belt-tightening, dramatically lower credit growth and subdued GDP growth. The institute cites Japan as a warning of what might happen – as does Richard Koo, chief economist of Japan’s Nomura Research Institute.7 For more than a decade of his professional life, Koo has been exploring the fallout of Japan’s 1989–92 credit crunch on the $5 trillion Japanese economy. His prognosis is alarming, and confirms the McKinsey analysis: the Americans, the British and especially the mainland Europeans are far too complacent, Koo thinks.

pages: 529 words: 150,263

The Pandemic Century: One Hundred Years of Panic, Hysteria, and Hubris
by Mark Honigsbaum
Published 8 Apr 2019

From an economic perspective, SARS could not have come at a worse time for Hong Kong as the territory was only just beginning to recover from the 1998 Asian financial crisis. The previous year Hong Kong had seen its real GDP grow by 2 percent, and in 2003 the government had been forecasting 3 percent real GDP growth. Within weeks of the WHO’s travel advisory, those forecasts were revised downward as shops reported a halving of retail sales and hotels saw their occupancy rates plunge by 60 percent. As malls emptied and banks like HSBC ordered bond traders to stay home, the only people seen to be doing a brisk trade on the formerly packed streets were salesmen of N95 masks.

The State and the Stork: The Population Debate and Policy Making in US History
by Derek S. Hoff
Published 30 May 2012

Daly, “A Marxian-Malthusian View of Population and Development,” Population Studies 25 (March 1971): 25–37. Environmental economists increasingly insisted upon the necessity of economic redistribution—especially from the developed to the developing nations—in contrast to the new classical economics’ stress on aggregate GDP growth. 175. See National Research Council, Resources and Man, 38, which suggested that the market unsatisfactorily arbitrates the development of technologies. 176. E. F. Schumacher, Small Is Beautiful: Economics as if People Mattered (New York: Harper & Row, 1973), 138 and 147. Also see his “Buddhist Economics,” in Economics, Ecology, Ethics, ed.

pages: 653 words: 155,847

Energy: A Human History
by Richard Rhodes
Published 28 May 2018

When they examined the relationship between the level of air pollution and increasing income in a cross section of urban areas in forty-two countries, they found that for two pollutants—sulfur dioxide and “smoke”—concentrations increased with per capita gross domestic product (GDP) at low national income levels but decreased with GDP growth at higher levels of income.35 The graph of the SO2 finding in their influential 1991 paper looks like this: Smog obscuring the George Washington Bridge, New York City, 1973. The curve on the Princeton economists’ graph happened to resemble a Kuznets curve, a visualization of a controversial economic theory named after the twentieth-century Belarussian American economist Simon Kuznets.

pages: 519 words: 155,332

Tailspin: The People and Forces Behind America's Fifty-Year Fall--And Those Fighting to Reverse It
by Steven Brill
Published 28 May 2018

At the school where Jensen ended up becoming a marquee professor, the Harvard Business Review weighed in with a 2014 article by Dominic Barton, the managing director of consulting powerhouse McKinsey, and Canadian Pension Board investment manager Mark Wiseman, warning that “short-termism is undermining the ability of companies to invest and grow, and those missed investments, in turn, have far-reaching consequences, including slower GDP growth, higher unemployment, and lower return on investment for savers.” Barton, who was among the business leaders who had signed on to the Aspen American Prosperity Project “framework,” told me that when he moved from working for McKinsey in Asia in 2009 to London he was struck by the difference in how business leaders in Europe and the West focused “only on the short term.

pages: 477 words: 144,329

How Money Became Dangerous
by Christopher Varelas
Published 15 Oct 2019

In almost every case, Citron was betting that the rates would continue to decline, which would positively affect the value of the derivatives—if interest rates went down, the value of the county’s assets went up, and vice versa. But to believe that he actually knew what would happen with interest rates is pure hubris. There are too many factors that are entirely out of anyone’s ability to predict—such as inflation, employment, GDP growth, manufacturing capacity, and foreign exchange rates, to name just a few—for this to be a prudent investment strategy. In fact, it would be fair to call it a blatant guess, like making a wager on the Super Bowl—not on the actual game, because one team would be favored over the other, but instead betting on whether the next commercial would feature humans or animals.

The New Map: Energy, Climate, and the Clash of Nations
by Daniel Yergin
Published 14 Sep 2020

Look at a hospital operating room—gloves, tubing, the bags for intravenous liquids, instruments, and the tools that insert stents into ailing heart patients. Moreover, “[Ninety-nine percent] of pharmaceutical feedstocks and reagents are derived from petrochemicals.” As for the N95 face masks that became the emblem of the coronavirus epidemic, they are made with petrochemicals.6 Petrochemical demand rises faster than GDP growth, sometimes twice as fast, and that means rising demand in that sector will offset the slack elsewhere. * * * — So when will oil demand reach its peak? IHS Markit’s Rivalry scenario, which is the planning case, points to the mid-2030s. In the alternative Autonomy scenario, the peak comes much earlier, as a result of strong government policies, a more rapid switch to electric cars, and the economic wounds of the 2020 coronavirus crisis.

pages: 542 words: 145,022

In Pursuit of the Perfect Portfolio: The Stories, Voices, and Key Insights of the Pioneers Who Shaped the Way We Invest
by Andrew W. Lo and Stephen R. Foerster
Published 16 Aug 2021

The problem with investing innovation is that you don’t see the outcome right away, and people are mistrustful of financial innovations.”105 Despite that, he has seen expressed interest in the trill concept from central bankers in Turkey and England. Countries such as Bulgaria, Bosnia, Costa Rica, Singapore, and Argentina have issued securities that are at least partially connected to GDP growth, although not precisely like trills.106 There is even the possibility that trills could be privately issued, such as Shiller’s MacroShares. As an eclectic thinker who doesn’t follow the herd, Shiller has one last take on what the best investment might be. He thinks that in order to progress, society should invest in something other than houses.

pages: 534 words: 157,700

Politics on the Edge: The Instant #1 Sunday Times Bestseller From the Host of Hit Podcast the Rest Is Politics
by Rory Stewart
Published 13 Sep 2023

Public money had been used to bail out the banks, and no action had been taken against the bankers. The economy had contracted by 7 per cent. The deficit was high, debt was growing. The financial services sector – which had been allowed to dominate much of the economy under Conservatives and Labour – had collapsed and might never fully recover. After decades in which UK per capita GDP growth and productivity had been the best in the developed world, productivity had collapsed – semi-permanently. Incomes were frozen. The only two options seemed to be to borrow more and spend more, or cut. The first was likely to cause debt problems in the medium term, and the other to choke growth in the short term.

Lonely Planet Mongolia (Travel Guide)
by Lonely Planet , Trent Holden , Adam Karlin , Michael Kohn , Adam Skolnick and Thomas O'Malley
Published 1 Jul 2018

Dateline Mongolia (Michael Kohn; 2006) An American journalist crosses the country, recounting misadventures and bizarre news events. Sky Shamans of Mongolia (Kevin Turner; 2016) Eye-opening and well-researched account by a practising shaman describing his encounters with a Mongolian counterpart. Population 3,140,000 GDP US$3870 per capita (2015) GDP Growth 1% (2016) Literacy Rate 98% Number of Livestock 73,000,000 Inflation 2.5% History Throughout history, hordes of warriors rode their horses down from the Mongolian plateau to challenge and transform the world. The steppe warriors not only conquered nations, they swept up whole civilisations and reassembled them into intercontinental empires of a scale never seen before.

pages: 493 words: 155,660

The Rough Guide to Finland
by Rough Guides
Published 31 May 2010

The Finnish economy has been growing steadily to become one of the wealthiest, heathiest and most competitive in the world – it’s regularly rated as the most competitive by the Global Competitiveness Report – with an estimated 2008 GDP of €192 billion. And all of this despite the general global economic downturn and a slowdown in GDP growth from 4.9 percent in 2006 to 2.5 percent in 2008. But business-wise the Finnish capital is thriving: Helsinki serves as headquarters to thousands of businesses, the largest of which trade in paper manufacturing (there’s a good chance that the paper these words are printed on was made in Finland), shipbuilding (every fourth cruise-ship in the world sails out of a Finnish port on its maiden voyage) and information technology (make a phone call from Dublin to Delhi and you’re likely to ring through Finnish networks, hubs and routers).

pages: 552 words: 168,518

MacroWikinomics: Rebooting Business and the World
by Don Tapscott and Anthony D. Williams
Published 28 Sep 2010

While the historical trajectory points to more freedom and more democracy in the future, the battle is far from over and freedom could use more allies. In the new global interdependent world, human development, political openness, and economic success can and should go hand-in-hand. Not only are higher levels of economic freedom associated with higher per capita incomes and higher GDP growth rates, those higher growth rates create fertile ground for better governance and greater business investment and innovation.5 Companies should anticipate and even encourage these transformations. Those that do will unleash powerful forces of choice and opportunity, help nourish other liberties, and improve their own competitiveness by gaining unique insights into the needs and aspirations of freedom-seeking peoples around the world.

pages: 442 words: 39,064

Why Stock Markets Crash: Critical Events in Complex Financial Systems
by Didier Sornette
Published 18 Nov 2002

From the beginning of 1992 until 1999, GDP rose 3.3% per annum, while the net balance of influx funds rose only 0.6% per annum. The net spending from the government and net exports since 1992, which had been much weaker than in any other period since 1960, cannot be the cause of the large growth of the GDP. Godley [162] suggested that the GDP growth was fueled by an increasing private financial deficit, that is, excess of personal consumption and housing investment over personal disposable income, which became much larger than ever before. This increase of private deficit can be derived from two sets of evidence. First, the deficit of private households can be inferred from the fact that it must mechanically be equal to the government surplus plus the balance-of-payment deficit.

pages: 726 words: 172,988

The Bankers' New Clothes: What's Wrong With Banking and What to Do About It
by Anat Admati and Martin Hellwig
Published 15 Feb 2013

According to the United Nations, in 2009 global output contracted by 2 percent and global unemployment rose from 178 million persons in 2007 to 205 million in 2009. Furthermore, in that same year 52 countries experienced declines in per capita income (UNDESA 2011). The World Bank Group reported a decline in average GDP growth from 6 percent in 2005–2007 to 1 percent in 2009 (Independent Evaluation Group 2012). See also IMF (2009, 2010a). Haldane (2010, 102–103) estimated that the total loss of output worldwide as a result of the financial crisis would eventually amount to between $60 trillion and $200 trillion and that the loss of output in the United Kingdom would be between £1.8 and £7.4 trillion.

Lonely Planet Nicaragua (Travel Guide)
by Lonely Planet , Alex Egerton and Greg Benchwick
Published 30 Jun 2013

Many analysts suggest the Nicaraguan economy is overly dependent on Venezuelan handouts and changes in policy by a new government in Caracas could have a devastating impact on the country’s economy. This uncertainty has left ordinary Nicaraguans following the political situation in the South American country almost as closely as Venezuelans themselves. Area: 129,494 sq km Population: 5,869,859 GDP: US$7.18 billion GDP Growth: 4.7% Inflation: 8.1% Unemployment: 7.3% History For such a small country, Nicaragua has played a disproportionate role in modern history. In the midst of cold-war tensions, the young Sandinista revolutionaries’ reforms captured the attention of the most powerful governments on earth and unleashed scandals in the corridors of power.

pages: 526 words: 160,601

A Generation of Sociopaths: How the Baby Boomers Betrayed America
by Bruce Cannon Gibney
Published 7 Mar 2017

Meanwhile, per the Obama administration’s rhetoric, the economic repair job had been mostly completed as Obama left office—one more coat of paint, and the economic house would be as good as new. None of these stories are true: What we have now is a very fragile new normal of very low growth, hollow employment, mounting inequality and, on the present course, far too little to look forward to. Income, Growth, and Intergenerational Transfers GDP growth has been decelerating under the Boomers, as the next chart shows. For the period 2000–2015, the economy managed real annual average growth of 1.9 percent versus over 2.9 percent in years between 1970 and 1980 (which were viewed at the time as something of an economic horror show). The economy of the 1980s and 1990s performed somewhat better than the 1970s, though not by as much as commonly believed—and the ’90s, presently felt to be an era of prosperity, underperformed most of the postwar/pre-Boomer period.

pages: 693 words: 169,849

The Aristocracy of Talent: How Meritocracy Made the Modern World
by Adrian Wooldridge
Published 2 Jun 2021

Rich-world laggards such as Portugal and Greece, and big emerging-market countries such as India, have a long tail of unmeritocratic and therefore badly managed firms.4 Two recent studies are particularly telling. Four economists at the University of Chicago’s Booth School of Business have examined America’s GDP growth per person in 1960–2010 in the light of the distribution of talent. They claim that roughly a fifth of that growth can be explained by the improved allocation of talent, particularly the opening of highly skilled professions to new talent pools. In 1960, 94 per cent of America’s doctors and lawyers were white men.

pages: 589 words: 167,680

The Red and the Blue: The 1990s and the Birth of Political Tribalism
by Steve Kornacki
Published 1 Oct 2018

The Internet, a fuzzy, futuristic concept until recently, was now a mainstream reality, and the source of a tech-sector explosion that was propelling the NASDAQ to one record high after another. The effects went far beyond the dot-com world, though. Unemployment was down to 4.6 percent. The annual rate of GDP growth, which had fallen into negative territory early in the decade, reached a staggering 4.5 percent in 1997. The Dow Jones average had been just over three thousand at Clinton’s swearing-in; in the summer of ’97, it crossed eight thousand. Everyday Americans were dabbling in the markets and getting rich.

pages: 614 words: 174,226

The Economists' Hour: How the False Prophets of Free Markets Fractured Our Society
by Binyamin Appelbaum
Published 4 Sep 2019

Illicit Tobacco Market: Characteristics, Policy Context, and Lessons from International Experiences,” 2015, National Academies Press; available at https://doi.org/10.17226/19016. 72. Friedman and Friedman, Two Lucky People, 171. 73. Phillips-Fein, Invisible Hands, 261. 74. The 1980s look a little worse without an adjustment for population. Average annual GDP growth was 3.2 percent in the 1970s and 3.1 percent in the 1980s. As the Congressional Research Service concluded in 2012, “Changes over the past 65 years in the top marginal tax rate and the top capital gains tax rate do not appear correlated with economic growth.” Thomas L. Hungerford, “Taxes and the Economy: An Economic Analysis of the Top Tax Rates Since 1945,” December 2012, Congressional Research Service. 75.

pages: 625 words: 167,349

The Alignment Problem: Machine Learning and Human Values
by Brian Christian
Published 5 Oct 2020

Or perhaps the environment is the stock market, your actions are buying and selling, and your reward is measured in the dollar value of your portfolio. There is virtually no limit to the complexity of these scenarios—the environment could be a national economy, the actions could be issuing words of legislation or diplomacy, and the reward could be long-term GDP growth—as long as the rewards are what is known as scalar: they are commensurate, fungible, of a common currency. The reinforcement-learning framework has proven to be so general, in fact, that it has led to an idea known as the “reward hypothesis”: “That all of what we mean by goals and purposes can be well thought of as the maximization of the cumulative sum of a received scalar reward.”26 “This is almost a philosophical thing,” says Richard Sutton.

pages: 564 words: 168,696

Horizons: The Global Origins of Modern Science
by James Poskett
Published 22 Mar 2022

Bonavolonta Announcing Charges against Harvard University Professor and Two Chinese Nationals’, Federal Bureau of Investigation, accessed 20 September 2020, https://www.fbi.gov/contact-us/field-offices/boston/news/press-releases/remarks-delivered-by-fbi-boston-special-agent-in-charge-joseph-r-bonavolonta-announcing-charges-against-harvard-university-professor-and-two-chinese-nationals, Elizabeth Gibney, ‘UC Berkeley Bans New Research Funding from Huawei’, Nature 566 (2019), Andrew Silver, Jeff Tollefson, and Elizabeth Gibney, ‘How US–China Political Tensions are Affecting Science’, Nature 568 (2019), Mihir Zaveri, ‘Wary of Chinese Espionage, Houston Cancer Center Chose to Fire 3 Scientists’, The New York Times, accessed 7 December 2020, https://www.nytimes.com/2019/04/22/health/md-anderson-chinese-scientists.html, and ‘Meng Wanzhou: Questions over Huawei Executive’s Arrest as Legal Battle Continues’, BBC News, accessed 16 December 2020, https://www.bbc.co.uk/news/world-us-canada-54756044. 4World Bank National Accounts Data, and OECD National Accounts Data Files, accessed 16 February 2021, https://data.worldbank.org. See comparative data for China and the United States, 1982–2019, for ‘GDP growth (annual %)’, ‘GDP (current US$)’, and ‘GDP, PPP (current international $)’. ‘China Overtakes Japan as World’s Second-Biggest Economy’, BBC News, accessed 20 February 2021, https://www.bbc.co.uk/news/business-12427321. See also Thomas Piketty, Capital in the Twenty-First Century (Cambridge, MA: Harvard University Press, 2014), 78 and 585, and Jude Woodward, The US vs China: Asia’s New Cold War?

pages: 578 words: 170,758

Gaza: An Inquest Into Its Martyrdom
by Norman Finkelstein
Published 9 Jan 2018

Its ideological bedfellow, the Muslim Brotherhood, had won Egypt’s first democratic election in June 2012. The emir of Qatar had journeyed to Gaza in October 2012 carrying the promise of $400 million in aid, while Turkish prime minister Recep Tayyip Erdoğan was scheduled to arrive soon.6 In the meantime, Gaza had witnessed “an enormous building boom”; it “boasted a stunning 23 percent GDP growth rate in 2011 alone,” “unemployment fell rapidly,” and Saudi Arabia had promised to double its investment in Gaza.7 On still another front, Gaza’s Islamic University had pulled off a diplomatic coup of its own in October 2012, as it convened an academic conference attended by renowned linguist Noam Chomsky.8 Hamas’s star was slowly but surely on the rise, at the expense of the hapless PA.

pages: 708 words: 176,708

The WikiLeaks Files: The World According to US Empire
by Wikileaks
Published 24 Aug 2015

In Chapter 14, investigative journalist Tim Shorrock examines the geopolitical triangle created by US relations with both countries, including its attempts to play one off against the other, as part of long-term efforts to undermine left-wing governments and policies within the region. Of global GDP growth over the last decade, over 50 percent has been in Southeast Asia. This understanding has led to an explicit reassignment of military, diplomatic, and surveillance assets to Southeast Asia, epitomized by Secretary of State Hillary Clinton as a strategy of “forward deployed diplomacy.”14 In Chapter 15, Richard Heydarian examines the cables on Southeast Asia and situates his findings within a broader historical critique of US influence in the region.

pages: 819 words: 181,185

Derivatives Markets
by David Goldenberg
Published 2 Mar 2016

Diversifiable risks are also called idiosyncratic risks which means that they are specific to the company. An example would be the quality of the firm’s management. Finally, there is the market risk which is not diversifiable. Non-diversifiable risks are related to economy-wide factors such as inflation or GDP growth which affect all firms in varying degrees. No matter how many stocks you hold in your portfolio, the market risk remains. All of this is part and parcel of standard portfolio analysis which is usually covered in investments courses. The first step in understanding S&P 500 stock index futures is to examine the spot S&P 500 stock index which is a product of Standard & Poor’s corporation.

Lonely Planet Colombia (Travel Guide)
by Lonely Planet , Alex Egerton , Tom Masters and Kevin Raub
Published 30 Jun 2015

The dismissal was approved by President Santos, a move that came back to haunt the president in April 2014, when Petro was reinstated as mayor of Bogotá following one of many legal challenges Petro's team launched against his dismissal. Despite the acrimony between the two, political necessity saw Santos and Petro subsequently burying the hatchet, with the latter endorsing the president in the 2014 elections. Only in Colombia… Population 48.32 million Area 1.14 million sq km GDP Growth 4.2% Unemployment 9.7% Life Expectancy 73 years (men), 79 years (women) Best Salsa Songs El Preso (Fruko Y Sus Tesos) La Pantera Mambo (La 33) Rebelion (Joe Arroyo) Oiga, Mira Vea (Orquesta Guayacan) Gotas De Lluvia (Grupo Niche) Etiquette Fare haggling You can haggle gently on almost all intercity bus fares – you can often get a discount of up to 20%.

Lonely Planet Iceland (Travel Guide)
by Lonely Planet , Carolyn Bain and Alexis Averbuck
Published 31 Mar 2015

Devil's Island (Einar Kárason; 1983) American culture clashes with rural tradition in postwar Reykjavík. Burial Rites (Hannah Kent; 2012) Haunting novel based on the true story of the last public execution in Iceland. Population 325,671 Area 103,000 sq km Tourists 807,300 (2013) Electricity production from renewables 100% GDP growth 3.5% Sheep 476,000 History Geologically young, staunchly independent and frequently rocked by natural (and more recently financial) disaster, Iceland has a turbulent and absorbing history of Norse settlement, literary genius, bitter feuding and foreign oppression. Life in this harsh and unforgiving landscape was never going to be easy, but the everyday challenges and hardships have cultivated a modern Icelandic spirit that’s highly aware of its stormy past, yet remarkably resilient, fiercely individualistic, quietly innovative and justifiably proud.

pages: 816 words: 191,889

The Long Game: China's Grand Strategy to Displace American Order
by Rush Doshi
Published 24 Jun 2021

Research in psychology suggests that “people do not readily alter their beliefs about the world and do not easily confront their own mistakes,” and that “once they are committed to a particular perspective, judgment, or course of action, it is difficult to get them to change their mind.”9 Organizational research finds that “resource constraints, transaction costs, internal politics, and the domestic environment in which organizations operate,” combined with formal rules and standard-operating-procedures, together help explain “why decision makers will typically feel pressure not to deviate radically from the status quo.”10 Together, these factors lock in grand strategy. If grand strategies are “sticky,” what then causes them to shift? This book argues that grand strategies rest on perceptions of power and threat, and that shifts in these perceptions “are driven more by events, especially shocks, than statistical measures” like gradually changing GDP growth rates or fleet sizes.11 By comparing descriptions of power and threat in Chinese texts before and after foreign policy shocks—such as the Tiananmen Square Massacre, the Gulf War, the Soviet collapse, and the Global Financial Crisis, among others—one can determine whether perceptions of power and threat changed and produced strategic adjustment too.

pages: 840 words: 202,245

Age of Greed: The Triumph of Finance and the Decline of America, 1970 to the Present
by Jeff Madrick
Published 11 Jun 2012

Reagan’s economists estimated that the budget deficit in his first fiscal year (ended September 1982) would be $45 billion; it turned out to be nearly $130 billion. Meanwhile, Volcker had pushed interest rates to record levels, not only to reduce money supply growth but also in response to the much higher budget deficit. It was shock therapy. The rate of GDP growth slowed significantly in 1981, but reported inflation fell only moderately, so Volcker kept up his tight policy. The bank prime lending rate exceeded 20 percent in the spring of 1981 and remained well above 15 percent until the fall of 1982. The interest rate on conventional mortgages hit 18 percent by the end of 1981 and hovered around 17 percent until mid-1982.

pages: 700 words: 201,953

The Social Life of Money
by Nigel Dodd
Published 14 May 2014

The total public debt in the world’s 20 largest economies is more than $36 trillion, equivalent on average to more than 80 percent of their GDP. 5 In both the Eurozone and in the United States, real economic growth has been declining steadily throughout the past half century, making the prospect of reducing the debt burden through economic expansion look increasingly remote. In the United States, real GDP growth has fallen from 49.4 percent in the 1960s to 17.3 percent in the 2000s; in Britain, the fall is between 33.9 and 19.7 percent; in Germany, from 53.5 to 8.4 percent (OECD) (see “Growth Problem,” The Economist, December 17, 2012). 6 In attitude surveys in the United States, national debt frequently emerges as a major area of concern, as troubling for many people as a major geopolitical crisis.

Switzerland
by Damien Simonis , Sarah Johnstone and Nicola Williams
Published 31 May 2006

In the Engadine valley is Castelgrande, Castello Castello Montebello Visconteo Schloss Tarasp (p279), just outside Scuol. & Castello di Sasso Corbaro A curious cylindrical defensive castle in the north is the Munot (p249) in Schaffhausen. 26 Snapshot FAST FACTS Population: 7.42 million Non-Swiss nationals: 20% of population Area: 41,285 sq km GDP: €449 billion GDP per person: Sfr54,000 GDP growth: 2.6% Inflation: 1% Unemployment rate: 3.7% Average life expectancy: 78.6 (men), 83.7 (women) Highest point: Dufourspitze at 4634m ‘This couldn’t be happening to us!’ many an unsettled Swiss commuter cried when, on a warm June day in 2005, the Helvetic image of seamless efficiency took a dramatic hammering.

pages: 741 words: 199,502

Human Diversity: The Biology of Gender, Race, and Class
by Charles Murray
Published 28 Jan 2020

14 That’s the opening sentence of Blueprint: How DNA Makes Us Who We Are, which Plomin published in 2018. He is referring to the advent of the polygenic score. Polygenic scores are the most exciting and also the most controversial use of GWA data. They work like many other indexes—quarterback performance ratings, fielding averages in baseball, economic indexes predicting GDP growth, and IQ scores—that represent the aggregated score on several indicators. Specifically, a polygenic score is the sum of the number of copies of the alleles that promote or intensify a given trait in an individual. In Blueprint, Robert Plomin offered a table of 10 hypothetical SNPs associated with a given trait to illustrate how the calculation works: THE RAW MATERIAL FOR CALCULATING A POLYGENIC SCORE SNP 1 Target allele: T Allele 1: A Allele 2: T Genotypic score: 1 Correlation with trait: 0.005 Weighted genotypic score: 0.005 SNP 2 Target allele: C Allele 1: G Allele 2: G Genotypic score: 0 Correlation with trait: 0.004 Weighted genotypic score: 0.000 SNP 3 Target allele: A Allele 1: A Allele 2: A Genotypic score: 2 Correlation with trait: 0.003 Weighted genotypic score: 0.006 SNP 4 Target allele: G Allele 1: C Allele 2: G Genotypic score: 1 Correlation with trait: 0.003 Weighted genotypic score: 0.003 SNP 5 Target allele: G Allele 1: C Allele 2: C Genotypic score: 0 Correlation with trait: 0.003 Weighted genotypic score: 0.000 SNP 6 Target allele: T Allele 1: A Allele 2: T Genotypic score: 1 Correlation with trait: 0.002 Weighted genotypic score: 0.002 SNP 7 Target allele: C Allele 1: C Allele 2: G Genotypic score: 1 Correlation with trait: 0.002 Weighted genotypic score: 0.002 SNP 8 Target allele: A Allele 1: A Allele 2: A Genotypic score: 2 Correlation with trait: 0.002 Weighted genotypic score: 0.004 SNP 9 Target allele: A Allele 1: T Allele 2: T Genotypic score: 0 Correlation with trait: 0.001 Weighted genotypic score: 0.000 SNP 10 Target allele: C Allele 1: C Allele 2: G Genotypic score: 1 Correlation with trait: 0.001 Weighted genotypic score: 0.001 Polygenic score Target allele: Allele 1: Allele 2: Genotypic score: 9 Weighted genotypic score: 0.023 Source: Adapted from Plomin (2018): Table 12.1.

pages: 789 words: 207,744

The Patterning Instinct: A Cultural History of Humanity's Search for Meaning
by Jeremy Lent
Published 22 May 2017

Because of this, activities that put more burden on the environment tend to contribute more to GDP. Driving to work in a car is GDP-enhancing, whereas cycling to work has no effect; turning on the air conditioning increases GDP, whereas opening a window does nothing for it. In this bizarre system of accounting, toxic pollution can be triply beneficial for GDP growth: once when a chemical company produces hazardous by-products, twice when the pollutants need to be cleaned up, and a third time if they cause harm to people that requires medical treatment.71 The measure of GDP goes from being merely bizarre to dangerous for humanity's future because of the fact that metrics have a profound impact on what society tries to achieve.

Energy and Civilization: A History
by Vaclav Smil
Published 11 May 2017

At the same time, energy flow is a poor measure of intellectual activity: education certainly embodies a great deal of energy expended on its infrastructures and employees, but brilliant ideas (which are by no means directly related to the intensity of schooling) do not require large increases of the brain’s metabolic rate. This obvious fact explains much of the recent decoupling of GDP growth from overall energy demand: we impute much higher monetary values to the nonphysical endeavors that now constitute the largest share of the economic product. In any case, energy has been of marginal concern in modern economic studies; only ecological economists have seen it as their primary focus (Ayres, Ayres, and Warr 2003; Stern 2010).

pages: 1,510 words: 218,417

Lonely Planet Norway (Travel Guide)
by Lonely Planet and Donna Wheeler
Published 1 Apr 2015

While most countries in the world would give anything to have to confront such problems, and Norway continues to face the future from a position of formidable strength, the fact that Norwegians are having this conversation at all suggests that the country's economic miracle may have finally peaked. Population 5.15 million GDP US$55,400 Unemployment 3.6% GDP Growth 1.6% (2013) Life Expectancy 81.6 years Area 386,224 sq km History Norway may have become the epitome of a modern, peaceful country, but its history is soaked in blood. It is a story peopled with picaresque characters that revolves around recurring grand themes, from the Vikings to the battle for supremacy in Scandinavia, from the struggles of the Sami to the dark days of World War II, from extreme poverty to previously unimaginable riches.

pages: 913 words: 219,078

The Marshall Plan: Dawn of the Cold War
by Benn Steil
Published 13 Feb 2018

[Originally published in Survival, Vol. 38, No. 3 (Autumn 1996): 5–26.] Asmus, Ronald D., and F. Stephen Larrabee. “NATO and the Have-Nots: Reassurance After Enlargement.” Foreign Affairs. November/December 1996. Augusta Chronicle. “Grave Decision.” March 13, 1947. Bacha, Edmar L. “A Three-Gap Model of Foreign Transfers and the GDP Growth Rate in Developing Countries.” Journal of Development Economics. Vol. 32, No. 2 (April 1990): 279–96. Barber, Chris. “The Herter Committee: Forging RN’s Foreign Policy.” April 9, 2014. Nixon Library. https://www.nixonfoundation.org/2014/04/herter-committee-forging-rns-foreign-policy/. Barnes, Bart.

pages: 767 words: 208,933

Liberalism at Large: The World According to the Economist
by Alex Zevin
Published 12 Nov 2019

But, Dornbusch interjected, ‘that thinking surely is not dead, as any chancellor of the exchequer, six months from an election, can attest.’128 Neither outside reviewer – Davies, future deputy governor of the Bank of England; Dornbusch, a Chicago-trained economist – were particularly leftwing. No matter: with regulatory bonfires ablaze, the Thatcher Revolution was said to be delivering at last. GDP growth rose to 4 per cent in 1986 and 4.5 in 1987 and 1988, as inflation dropped to 2.5 per cent. Unemployment remained high at 11 per cent, but rising real income for those still in work, as well as ‘gains’ from privatization – more homeowners, given the chance to buy council flats by taking out mortgages; more shareholders (5.5 million), offered shares as the state sold off profitable public utilities like British Telecom – meant ‘more money, more security, more independence for ordinary Britons’.129 In 1992, the Economist backed Thatcher’s handpicked successor on this record, after a party revolt over Europe toppled her as leader.

The Rise and Fall of the British Nation: A Twentieth-Century History
by David Edgerton
Published 27 Jun 2018

The high point of ‘growthmanship’ was 1964, when both the Conservative manifesto and Labour’s National Plan of 1964 called for 4 per cent per annum growth, which was never achieved on a sustained basis. There were spurts lasting a year in the 1960s when growth reached 6 per cent; the record was and is 1973, with 7.4 per cent annual GDP growth. Still, the size of the national cake measured by real GDP more than doubled between 1950 and 1975 (a greater growth than between 1975 and 2000). Furthermore, the population was growing as the result of baby booms in the late 1940s and early 1960s – due to couples marrying younger than ever. Not for nothing were the terms ‘affluent society’ and ‘consumer society’ applied to these years of transformative growth.

pages: 801 words: 229,742

The Israel Lobby and U.S. Foreign Policy
by John J. Mearsheimer and Stephen M. Walt
Published 3 Sep 2007

Israel’s economy suffered a downturn in 2001–02, after the start of the Second Intifada in October 2000. Most experts believe, however, that the global economic meltdown was largely responsible for that downturn. An article in Forbes in late May 2002 summarizes the conventional wisdom: “The Israeli government and private economists estimate that two-thirds of the savage tumble in Israel’s GDP growth, from 6.4% in 2000 to a current rate of zero, was due not to terrorism but to the worldwide slump led by high-tech.” David Simons, “Cold Calculation of Terror,” Forbes, May 28, 2002. The economy rebounded in 2003–05, even though the Palestinian uprising continued. Also see Emma Clark, “Israel’s Neglected Economy,” BBC News (online), September 2, 2002; Nadav Morag, “The Economic and Social Effects of Intensive Terrorism: Israel, 2000–2004,” Middle East Review of International Affairs 10, no. 3 (September 2006); Neal Sandler, “Israel’s Economy: As if the Intifada Weren’t Enough,” BusinessWeek, June 18, 2001; and Linda Sharaby, “Israel’s Economic Growth: Success Without Security,” Middle East Review of International Affairs 6, no. 3 (September 2002). 17.

pages: 976 words: 235,576

The Meritocracy Trap: How America's Foundational Myth Feeds Inequality, Dismantles the Middle Class, and Devours the Elite
by Daniel Markovits
Published 14 Sep 2019

The economy as a whole grew at an average annual rate of just under 2.5 percent between 1990 and 2016, and average annual economic growth is forecast to be just 2 percent in the coming decade. Kevin Dubina, “Projections of the U.S. Economy, 2016–26: Slow Growth Continues,” Career Outlook, U.S. Bureau of Labor Statistics, November 2017, www.bls.gov/careeroutlook/2017/data-on-display/economic-growth.htm?view_full; and “GDP Growth (Annual %): United States,” World Bank Open Data, World Bank, https://data.worldbank.org/indicator/NY.GDP.MKTP.KD.ZG?locations=US. doubling in the next decade: Dominique Muret, “Luxury Goods: Goldman Sachs Forecasts 4% Average Growth for Next 10 Years,” Fashion Network, September 30, 2016, accessed November 19, 2018, https://us.fashionnetwork.com/news/Luxury-goods-Goldman-Sachs-forecasts-4-average-growth-for-next-10-years,737938.html.

pages: 809 words: 237,921

The Narrow Corridor: States, Societies, and the Fate of Liberty
by Daron Acemoglu and James A. Robinson
Published 23 Sep 2019

The story of Zhao Hua is from Dan Levin (2012), “A Chinese Education, for a Price,” https://www.nytimes.com/2012/11/22/world/asia/in-china-schools-a-culture-of-bribery-spreads.html. Pei (2016) contains detailed information about the sale of offices. On uncertainty and possible exaggeration about Chinese GDP growth, see https://www.cnbc.com/2016/01/19/what-is-chinas-actual-gdp-experts-weigh-in.html, and also https://www.stlouisfed.org/publications/regional-economist/second-quarter-2017/chinas-economic-data-an-accurate-reflection-or-just-smoke-and-mirrors for an overview. For a survey of business economists on the accuracy of China’s GDP statistics, see https://www.wsj.com/articles/wsj-survey-chinas-growth-statements-make-u-s-economists-skeptical-1441980001.

Lonely Planet Norway
by Lonely Planet

The Fremskrittspartiet (Progress Party) has been the most vocal in asking these questions. Although the party's leader, Siv Jensen, has been Finance Minister since 2013, the long-standing policy remains in place. But the time when these questions move to the centre of the political debate may be drawing closer. Population 5.2 million Area 386,224 sq km GDP growth 0.8% (2016) GDP per capita US$69,300 Life Expectancy 81.8 years Unemployment Rate 4.4% History Norway may have become the epitome of a modern, peaceful country, but its history is soaked in blood. It is a story peopled with picaresque characters that revolves around recurring grand themes, from the Vikings to the battle for supremacy in Scandinavia, from the struggles of the Sami to the dark days of World War II, from extreme poverty to previously unimaginable riches.

pages: 898 words: 236,779

Digital Empires: The Global Battle to Regulate Technology
by Anu Bradford
Published 25 Sep 2023

The Washington, DC–based think tank Brookings declared in a 2020 paper that “whoever leads in artificial intelligence in 2030 will rule the world until 2100.”164 The significance of AI is supported by various studies predicting how AI will affect the global economy. While projections regarding the gains from AI innovations differ somewhat, the McKinsey Global Institute predicts that by 2030, AI could add $13 trillion to the global economy, delivering an additional 1.2 percent of annual GDP growth.165 The World Bank similarly predicts “significant gains in overall productivity and economic growth” globally from AI-related products and improved supply chains. It relies on a 2019 Deloitte study, which estimates that the global AI market will be worth $6.4 trillion by 2025, and a 2017 PwC study, which estimates that global GDP will have grown 14 percent by 2030 due to AI adoption.166 To put these numbers in context, the PwC study notes how “AI could contribute up to $15.7 trillion to the global economy in 2030, more than the current output of China and India combined.”167 Given these projections, it is therefore not surprising that the global tech race is particularly intense in AI, with every major player eager to claim its share of that projected growth.

pages: 1,309 words: 300,991

Vanished Kingdoms: The Rise and Fall of States and Nations
by Norman Davies
Published 30 Sep 2009

The previous year, 2010, had witnessed a major sovereign debt crisis in which the future of the euro was repeatedly called into question. Two countries in the zone, Greece and Ireland, had been forced to accept painful bail-outs, and several others were thought to be teetering on the same brink. It was not a moment of confidence in the euro, yet Estonia did not falter. It had recovered from the global recession, returning to GDP growth at +2.4 per cent after 12 months of headlong fall in 2009 of -13.9 per cent. On New Year’s Day, therefore, it became the seventeenth member of the Eurozone; the kroon ceased to circulate, being exchanged for euros at the rate of 1E = 15.6466 krooni. ‘Estonia is too small’, said the finance minister, ‘to allow itself the luxury of full independence.’22 The flea, it seemed, was seeking safety in numbers against the unwelcome attentions of the bear.

Vanished Kingdoms: The History of Half-Forgotten Europe
by Norman Davies
Published 27 Sep 2011

The previous year, 2010, had witnessed a major sovereign debt crisis in which the future of the euro was repeatedly called into question. Two countries in the zone, Greece and Ireland, had been forced to accept painful bail-outs, and several others were thought to be teetering on the same brink. It was not a moment of confidence in the euro, yet Estonia did not falter. It had recovered from the global recession, returning to GDP growth at +2.4 per cent after 12 months of headlong fall in 2009 of -13.9 per cent. On New Year’s Day, therefore, it became the seventeenth member of the Eurozone; the kroon ceased to circulate, being exchanged for euros at the rate of 1E = 15.6466 krooni. ‘Estonia is too small’, said the finance minister, ‘to allow itself the luxury of full independence.’22 The flea, it seemed, was seeking safety in numbers against the unwelcome attentions of the bear.

pages: 1,242 words: 317,903

The Man Who Knew: The Life and Times of Alan Greenspan
by Sebastian Mallaby
Published 10 Oct 2016

Thanks to the financial industry’s eagerness to hand out new mortgages, consumer purchasing power had expanded by almost 5 percent during the quarter; and although Greenspan did not drive home this point, total spending in the economy (counting in spending by government and companies as well as consumers) might have been boosted by almost 3 percent.5 The implication was that GDP growth in the second quarter, which had come in at an annualized rate of 8.1 percent, might have come in nearer to 5 percent without the miraculous boost from housing. The flip side was that if the housing boom came to an end, the economy would slow. There was a “danger that the rise in home prices could take on a speculative hue,” Greenspan observed.

pages: 1,123 words: 328,357

Post Wall: Rebuilding the World After 1989
by Kristina Spohr
Published 23 Sep 2019

He wanted to restructure the traditional Soviet sociopolitical order ‘within the system’, which is why under glasnost he also advocated ‘socialist pluralism’ ahead of full ‘political pluralism’ – all this to reinvigorate the Soviet Union.[7] To achieve reform and rejuvenation, Gorbachev had to reduce the burden of the military-industrial complex on the Soviet economy, intensified during the 1980s by the war in Afghanistan and the spiralling arms race with America. To be sure, the Soviet command economy was performing poorly simply for structural reasons – a fact masked by the global oil price rise of the 1970s and the country’s vast Siberian reserves which fuelled a GDP growth rate of 2–3.5% between 1971 and 1980. But when the oil price dropped in the next decade, national income fell sharply. Indeed, in 1980–5 the USSR found itself at near zero growth. The increasing dissatisfaction of Soviet consumers was exacerbated by declining living standards and limited access to high-tech civilian goods.

pages: 1,213 words: 376,284

Empire of Things: How We Became a World of Consumers, From the Fifteenth Century to the Twenty-First
by Frank Trentmann
Published 1 Dec 2015

In Britain, France and the United States, the rise of consumption was tied up with the rise of civil society, citizenship and social democracy. What kind of political animal is consumption outside a liberal and republican habitat, in regimes characterized by strong states and weak individual rights? CRESCENDO For any story, the starting point shapes the moral. GDP growth of over 10 per cent a year in Japan (1955–73), in China (1979–2011) and close to it in India (8.7 per cent in 2003–8) has been so extraordinary that it is no surprise that most commentators take their respective starting points as the Japanese miracle, Deng Xiaoping’s opening of China and India’s liberal reforms in 1991.

Betrayal of Trust: The Collapse of Global Public Health
by Laurie Garrett
Published 15 Feb 2000

Riding the crest of that newfound national pride was Yeltsin’s designated heir, former KGB operative Vladimir Putin, who was elected president of Russia in March 2000. By then Russia’s economy, along with that of its allied neighbors Ukraine and Belarus, was generating only 1 percent of global merchandise trade, and domestic inflation was running ahead of the nation’s GDP growth rate. One man, Boris Berezovsky, controlled the bulk of the region’s wealth and assets. And the once-feared Russian superpower was ranked by the influential Swiss International Institute for Management Development in 2000 as the least competitive large economy in the world, well behind such troubled economies as the Czech Republic, South Africa, Slovenia, Mexico, and India.79 Possibilities for the near future regionally included civil war, widespread anarchy, painfully slow stabilization of market economies, the splintering of Russia into as many as ten different nations, military coups, a regionwide return of Stalin-style Sovietism, and a sort of endless period of “muddling through.”80 What all of this boded for public health was, of course, agony.

pages: 1,410 words: 363,093

Lonely Planet Brazil
by Lonely Planet

Yet even before this scandal erupted, Rousseff’s popularity was tanking, owing in part to anger over the obscene amount of money being spent on the 2014 FIFA World Cup – money that critics said would be better spent on health, education and poverty reduction. To make matters worse, the burgeoning Brazilian economy stalled, with GDP growth averaging a mere 2% per year during her first term, and outright shrinking in her second term (by a staggering 3.6% in 2016). With huge protests rocking major cities, and the country in the grip of its largest recession in history, Rousseff was headed for a fall, and in 2016 she was impeached and removed from office for budgetary violations.

pages: 1,202 words: 424,886

Stigum's Money Market, 4E
by Marcia Stigum and Anthony Crescenzi
Published 9 Feb 2007

Estrella and Mishkin’s study (1996) conducted for the period from 1960 to 1995 found values of the yield curve spread that correspond to estimated probabilities of recession four quarters in the future. They found that the yield curve spread between the 10-year Treasury note and the 3-month T-bill was one of the most successful models of recession FIGURE 14.9 Real GDP growth and lagged yield spread four quarters in the future. Table 14.7 shows their findings. As the table shows, an inverted spread of 2.4 percentage points implies a 90% probability of recession four quarters into the future. The main message is that the more inverted the yield curve is, the greater the probability of recession in the future.

Southeast Asia on a Shoestring Travel Guide
by Lonely Planet
Published 30 May 2012

Thailand’s baht was the first currency to crash (falling from 50B/US$1 to 25B/US$1); neighbouring currencies soon followed. A period of economic retraction and financial austerity restored these developing economies to a more sustainable footing. More than a decade since the economic crash of 1997, many of the former tigers have become house cats, enjoying respectable GDP growth, economic opportunity, foreign investment and an increasingly affluent and educated population. The formerly cloistered countries of Vietnam, Laos and Cambodia began to open up in the mid- to late 1990s and have experienced various degrees of economic success and industrialisation. Vietnam continues to be the success story of former Indochina with an ever-expanding economy and a youthful optimism that counteracts government inefficiencies.

Principles of Corporate Finance
by Richard A. Brealey , Stewart C. Myers and Franklin Allen
Published 15 Feb 2014

TABLE 4.3 Cost-of-equity estimates for local gas distribution companies at the start of 2012. The long-term growth rate is based on security analysts’ forecasts. In the multistage DCF model, growth after five years is assumed to adjust gradually to the estimated long-term growth rate of Gross Domestic Product (GDP). a Annualized last quarterly dividend. b Long-term GDP growth forecasted at 4.7%. Source: The Brattle Group, Inc. Estimates of this kind are only as good as the long-term forecasts on which they are based. For example, several studies have observed that security analysts are subject to behavioral biases and their forecasts tend to be over-optimistic. If so, such DCF estimates of the cost of equity should be regarded as upper estimates of the true figure.

Reaganland: America's Right Turn 1976-1980
by Rick Perlstein
Published 17 Aug 2020

A 1977 Harris Poll revealed that by a margin of 64 to 13 percent, the public believed that union leaders were connected to criminal elements. Some were, of course, but the data hardly bore out the prejudice. During the 1970–78 period, company complaints of union malfeasance deemed meritorious by the NLRB increased at precisely the rate of GDP growth—but meritorious complaints of lawbreaking by companies more than doubled. NLRB data also suggested why companies were becoming more willing to fight unions: the number of big strikes they called kept going up, during the same period in which corporate profits kept going down. Business began fighting back in Washington.

Spain
by Lonely Planet Publications and Damien Simonis
Published 14 May 1997

Most cities also promise a daytime feast of exceptional sites, from world-class art galleries to graceful Islamic-era monuments, from barrios (districts) overflowing with medieval charm to zany Gaudí flights of fancy. * * * Fast Facts Population: 45 million Area: 504,782 sq km GDP: €1348 billion (world’s eighth-largest economy) GDP per head: €19,226 GDP growth: 1.8% Inflation: 4.6% Unemployment rate: 9.63% Average life expectancy: 79.92 years Highest point in peninsular Spain: Mulhacén (3479m) Biggest paella: made in Valencia in 1992 in a pan 20m in diameter; it was eaten by 100,000 people * * * Speaking of feasts, food and wine are what Spaniards really get excited about.

Italy
by Damien Simonis
Published 31 Jul 2010

Italy only reunited and regained independence in the late 19th century. Since then, what is today Europe’s fourth largest economy has been a country of enormous contradictions. * * * FAST FACTS Population: 59.6 million Area: 301,230 sq km GDP: €1273 billion (€21,359 per head) GDP growth: -1% Tourism contribution to GDP: 11.5% Inflation: 0.2% Unemployment rate: 7.8% (10-13.5% in the south) Average life expectancy: 77.6 years (men), 83.2 years (women) Highest point: Mont Blanc (Monte Bianco) at 4807m Coffee consumption: Italians drink 600 cups per head a year, according to one study!

France (Lonely Planet, 8th Edition)
by Nicola Williams
Published 14 Oct 2010

He says the lunch-loving play-hard French, many of whom until recently only worked a 35-hour week (Click here), must change if their country is to move forward economically. Naturally, they don’t all agree. Non fumeur, yes, but still plenty of sparks ahead. * * * FAST FACTS Population: 63.4 million Area: 551,000 sq km GDP (end second quarter 2008): €411.93 billion GDP per capita (2007): US$33,470 GDP growth (2007): 2.1% Annual inflation (2007): 1.5% Unemployment (end second quarter 2008): 7.9% Highest point: Mont Blanc (4807m) Internet domain: fr Annual alcohol consumption (per person): wine 78.9L, beer 41L, cider 6.9L, spirits 9.1L * * * Return to beginning of chapter Getting Started * * * WHEN TO GO COSTS & MONEY TRAVELLING RESPONSIBLY TRAVEL LITERATURE INTERNET RESOURCES * * * Some parts of France are tried-and-tested, bona fide ‘dream destinations’ and as such require planning weeks, if not months, in advance in order to snag the best room in the house: be it a castle, a tree house or a golden stone mas (farmhouse).

Lonely Planet France
by Lonely Planet Publications
Published 31 Mar 2013

Look for the signpost indicating a short, gentle path that meanders down through a superb forest to Cascades des Anglais , a sequence of gleaming waterfalls. Understand France FRANCE TODAY HISTORY THE FRENCH BON APPÉTIT FRENCH WINE THE ARTS ARCHITECTURE LYRICAL LANDSCAPES Top of section France Today Fast Facts » Population: 64.3 million » Area: 551,000 sq km » GDP: US$2.214 trillion » GDP growth: 1.7% » Inflation: 2% » Unemployment: 10.2% A New French President Presidential elections in spring 2012 ushered in France’s first socialist president since François Mitterand left office in 1995. The presidential campaign saw incumbent right-wing president Nicolas Sarkozy vie for a second term in office against left-wing candidate François Hollande (b 1954) of the Socialist party.