Ralph Nelson Elliott

back to index

description: American accountant (1871-1948)

11 results

pages: 295 words: 66,824

A Mathematician Plays the Stock Market
by John Allen Paulos
Published 1 Jan 2003

To the extent there is one, it most likely derives from psychology, perhaps in part from the Keynesian idea of conventionally anticipating the conventional response, or perhaps from some as yet unarticulated systemic interactions. “Unarticulated” is the key word here: The quasi-mathematical jargon of technical analysis seldom hangs together as a coherent theory. I’ll begin my discussion of it with one of its less plausible manifestations, the so-called Elliott wave theory. Ralph Nelson Elliott famously believed that the market moved in waves that enabled investors to predict the behavior of stocks. Outlining his theory in 1939, Elliott wrote that stock prices move in cycles based upon the Fibonacci numbers (1, 2, 3, 5, 8, 13, 21, 34, 55, 89, . . . , each successive number in the sequence being the sum of the two previous ones).

The Golden Ratio: The Story of Phi, the World's Most Astonishing Number
by Mario Livio
Published 23 Sep 2003

Some of the modern applications of the Golden Ratio, Fibonacci numbers, and fractals reach into areas that are much more down to earth than the inflationary model of the universe. In fact, some say that the applications can reach even all the way into our pockets. A GOLDEN TOUR OF WALL STREET One of the best-known attempts to use the Fibonacci sequence and the Golden Ratio in the analysis of stock prices is associated with the name of Ralph Nelson Elliott (1871–1948). An accountant by profession, Elliott held various executive positions with railroad companies, primarily in Central America. A serious alimentary tract illness that left him bedridden forced him into retirement in 1929. To occupy his mind, Elliott started to analyze in great detail the rallies and plunges of the Dow Jones Industrial Average.

pages: 268 words: 81,811

Flash Crash: A Trading Savant, a Global Manhunt, and the Most Mysterious Market Crash in History
by Liam Vaughan
Published 11 May 2020

When Nav created his online alter ego, he was a newcomer to trading, twenty-four years old and still buying and selling individual stocks rather than the index futures that would make him rich. His idiosyncratic way of seeing the world and preternatural confidence, though, were evident from the start. Indeed, his opening gambit on the site was a repudiation of two of the godfathers of trading theory. Ralph Nelson Elliott was a Kansas-born accountant who, in 1938, published a book called The Wave Principle that posited that markets move in discernible and therefore predictable wave formations based on the ebb and flow of crowd sentiment from optimism to pessimism. According to Elliott, while markets might appear to be random, they are in fact governed by recurring patterns grounded, like much in nature, on the Fibonacci sequence.

pages: 303 words: 84,023

Heads I Win, Tails I Win
by Spencer Jakab
Published 21 Jun 2016

Robert Prechter earned his claim to fame in the late 1970s, predicting a top for gold prices, which had been red-hot throughout the decade, almost to the exact month. More significantly, he also said a roaring equity bull market would begin in 1982, missing the date by only a few months. He claims to have made these predictions using an arcane technique called the Elliott Wave Theory developed by accountant and amateur social theorist Ralph Nelson Elliott in the 1920s. Subscribers to Prechter’s paid newsletter swelled to twenty thousand, with an annual subscription price of over $200, in the mid-1980s. Then he made a very optimistic and tantalizingly specific call on stocks, predicting that the Dow Jones Industrials would hit 3,686 in 1987 or 1988.

pages: 323 words: 95,939

Present Shock: When Everything Happens Now
by Douglas Rushkoff
Published 21 Mar 2013

More recently, in early 2010, the world’s leading forecaster applying fractals to markets, Robert Prechter, called for the market to enter a decline of such staggering proportions that it would dwarf anything that has happened in the past three hundred years.16 Prechter bases his methodology on the insights of a 1930s economist, Ralph Nelson Elliott, who isolated a number of the patterns that seem to recur in market price data. They didn’t always occur over the same timescale or amplitude, but they did have the same shape. And they combined to form larger and larger versions of themselves at higher levels, in a highly structured progression.

pages: 364 words: 101,286

The Misbehavior of Markets: A Fractal View of Financial Turbulence
by Benoit Mandelbrot and Richard L. Hudson
Published 7 Mar 2006

The sophistication of these techniques varies greatly. Some are mere eyeball hunches: A pattern in an index or price chart looks like one that has happened before, and so you bet the chart will keep moving in the same way. Others are more elaborate. The best-known example is the Elliott Wave. Ralph Nelson Elliott was a Kansas-born accountant who spent much of his working life reorganizing railroads and state finances in Central America and who, during a debilitating illness, devised a new charting methodology. Investor psychology, he felt, moves in waves of optimism and pessimism; and these waves can be seen in the stock market again and again, at different times and at different time-scales.

pages: 289 words: 95,046

Chaos Kings: How Wall Street Traders Make Billions in the New Age of Crisis
by Scott Patterson
Published 5 Jun 2023

Referring to the dot-com bubble, he said in an August 2002 speech in Jackson Hole, Wyoming: “As events evolved, we recognized that, despite our suspicions, it was very difficult to definitely identify a bubble until after the fact—that is, when its bursting confirmed its existence.” Wall Street has always been rife with visionaries claiming to have discovered hidden patterns in the market’s warp and weft. The Elliott wave principle, propagated in the early twentieth century by accountant Ralph Nelson Elliott, claimed to predict market cycles and trends by pinpointing extremes in prices and investor psychology. Such cycles, the theory goes, move in discernible waves that slosh up and down—bubbles and crashes. Sornette himself has said that his model in ways parallels Elliott waves. But while technical analysis had at times enjoyed short-term success, over the long run there was little evidence investors could use it to accurately predict the market.

pages: 499 words: 148,160

Market Wizards: Interviews With Top Traders
by Jack D. Schwager
Published 7 Feb 2012

The maximum drawdown is the largest difference between a relative equity peak and any subsequent equity low. Low drawdowns are a desirable performance feature for a trader or a trading system. Earnings per share (EPS). A company’s total after-tax profits divided by the number of common shares outstanding. Elliott Wave analysis. A method of market analysis based on the theories of Ralph Nelson Elliott. Although relatively complex, the basic theory is based on the concept that markets move in waves, forming a general pattern of five waves (or market legs) in the direction of the main trend, followed by three corrective waves in the opposite direction. One aspect of the theory is that each of these waves can be broken down into five or three smaller waves and is itself a segment of a still larger wave.

pages: 512 words: 162,977

New Market Wizards: Conversations With America's Top Traders
by Jack D. Schwager
Published 28 Jan 1994

The maximum drawdown is the largest difference between a relative equity peak and any subsequent equity low. Low drawdowns are a desirable performance feature for a trader or a trading system. Earnings per share (EPS). A company’s total after-tax profits divided by the number of common shares outstanding. Elliott Wave analysis. A method of market analysis based on the theories of Ralph Nelson Elliott. Although relatively complex, the basic theory is based on the concept that markets move in waves, forming a general pattern of five waves (or market legs) in the direction of the main trend, followed by three corrective waves in the opposite direction. One aspect of the theory is that each of these waves can be broken down into five or three smaller waves and is itself a segment of a still larger wave.

pages: 665 words: 159,350

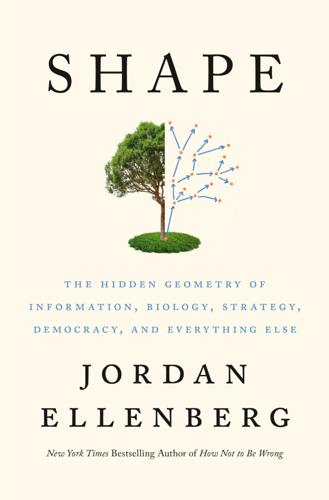
Shape: The Hidden Geometry of Information, Biology, Strategy, Democracy, and Everything Else
by Jordan Ellenberg
Published 14 May 2021

On subsequent pages we find “Pepsi Energy Fields” and their relation to the Earth’s magnetosphere, and this diagram illustrating the relevance of Einstein’s take on gravitation to the brand’s attractiveness on the grocery aisle: As absurd as all this is, Arnell’s Pepsi globe is still on the cans a decade later. So maybe the golden ratio really is the true natural arbiter of what’s beautiful and good! Or maybe people just like Pepsi. Ralph Nelson Elliott was an accountant from Kansas who, for the first three decades of the twentieth century, bounced back and forth between the United States and Central America, working for railroad companies in Mexico and financial reorganization in U.S.-occupied Nicaragua. In 1926 he fell ill from a nasty infestation of parasitic amoebas, and he had to move back to the United States.

Evidence-Based Technical Analysis: Applying the Scientific Method and Statistical Inference to Trading Signals
by David Aronson
Published 1 Nov 2006

Even with such clear discrediting evidence, the subjects continued to believe, to a considerable degree, that they were able to discriminate real from fake suicide notes. Other experiments conducted along similar lines have found the same effect: a belief can survive a total discrediting of its original basis.93 These findings predict how believers might react if Ralph Elliott, W.D. Gann, or Charles Dow were to return from the grave and announce that their methods had been intentional scams. It is likely that many currentday practitioners would continue to believe. Given that Elliott wave analysis, or at least one version of it, has now been reduced to an objective algorithm, it will be interesting to see the reactions of EWP believers if objective tests fail.94 Subjective Methods Most Likely to Suffer the Confirmation Bias Some subjective TA methods are more likely to encourage the confirmation bias than others.