data storytelling
description: translating complex data analyses into understandable, engaging narratives, often involving visual elements like charts or graphs, to effectively communicate insights and findings to a broader audience
6 results
Becoming Data Literate: Building a great business, culture and leadership through data and analytics
by
David Reed
Published 31 Aug 2021
Habit 2 – Communicating Data can appear to its internal customers as something of a ‘black box’ which generates models through an invisible, quasi-magical process. Often, this is a direct consequence of limited communication by the data team with its stakeholders. Effective communication means adopting the terms and language of the business, rather than expecting business executives to understand the technical language of data. Data storytelling and data visualisation are key tools in this process to translate the numerical process of data analysis into a language-based narrative which stakeholders can understand. A further step is essential – making the link between what the data team has done and successful business outcomes. It is often assumed that simply doing good work will lead to recognition by internal customers.
…
Chapter 7: Data teams Roadmap – in this chapter: Photobox tackled performance and retention issues by creating a data squad. Guilds, squads and tribes create an agile, working structure but can be challenging for stakeholders, leaders and practitioners. Communication is critical both within teams and between teams and stakeholders. Principles exist that make data storytelling and data visualisation more effective. Creating a data brand gives the data team better visibility and engagement levels. Automating routine tasks frees data teams to tackle higher value projects. Democratisation of data has a similar benefit. Data teams need to constantly scan the horizon for the next opportunity, technique or technology.
…
As a driver of data literacy and building data culture, the more widely data teams have casual interaction with the business, the more likely the organisation is to absorb core concepts and behaviours. Communicate DataIQ Way Marker Show the destination, not the journey How data storytelling and data visualisation work It is easy to view soft skills as being the preserve of the humanities and of little use to the sciences. That is true only if the audience for what scientists produce is only other scientists and then only if they specialise in the same domain. For data scientists – indeed, for all analysts and everybody working in data – the audience will most often be non-technical, business-oriented.
Data-Ism: The Revolution Transforming Decision Making, Consumer Behavior, and Almost Everything Else
by
Steve Lohr
Published 10 Mar 2015
Finally, thanks to Terry and Nikki for understanding about work and the missed vacations, and to Nickie Trucco for my missing the Christmas holidays in 2013. But then, as I told them at the time, this book was a good problem to have. CONTENTS Dedication Acknowledgments 1 How Big Is Big Data? 2 Potential. Potential. Potential. 3 Bet the Company 4 Sight and Insight 5 The Rise of the Data Scientist 6 Data Storytelling: Correlation and Context 7 Data Gets Physical 8 The Yin and Yang of Behavior and Data 9 The Long Game 10 The Prying Eyes of Big Data 11 The Future: Data Capitalism Notes Index About the Author Also by Steve Lohr Credits Copyright About the Publisher 1 HOW BIG IS BIG DATA?
…
In health care, the stakes could not be higher; people’s quality of living and their very lives are the outcomes. The question was how much good data skills could do. How much difference could they make in medicine? A big question, but Hammerbacher found the challenge appealing, and he remembers thinking to himself, “This is the best problem.” 6 DATA STORYTELLING: CORRELATION AND CONTEXT You’re given one data point: 39. What does it tell you? Not much. It’s a number greater than 38 and less than 40. Anything beyond that would be speculation and conjecture. Next, you’re presented an additional piece of information, 39 degrees. It could be the measure of an angle or a temperature.
…
called an “action plan”: William Cleveland’s paper, titled “Data Science: An Action Plan for Expanding the Technical Areas of the Field of Statistics,” was published in the International Statistical Review 69, no. 1 (April 2001): 21–26. It is available online: http://www.stat.purdue.edu/~wsc/papers/datascience.pdf. “the great unifier”: Interview on Nov. 7, 2013, with Edward Lazowska. “What we lovingly call a data scientist today”: Philip Zeyliger’s descriptions and quotes come from an interview on Aug. 13, 2013. 6: Data Storytelling “Everything you added”: Interview on Sept. 17, 2013, with Sam Adams. Consider start-up ZestFinance: Douglas Merrill’s descriptions and quotes come from an interview on Oct. 30, 2013. fees paid by payday borrowers: For the average borrowers and amounts outstanding, Merrill did his own current estimates as of late 2013.
Data Action: Using Data for Public Good
by
Sarah Williams
Published 14 Sep 2020
Louis, Missouri 31–34, 33 Stop, Question, Frisk (SQF) 177 Stop-and-Frisk 2011, pie chart from the New York City Civil Liberties Union (NYCLU) 178 Stop-and-frisk data 183, 216 racial disparity and 177 removal of policy and 180–181, 183 stop-and-frisk map 181 Stop-and-Frisk: Number of Stops Over Time (NYCLU) 178 Stop-and-frisk policy 180–181, 183, 216. See also Stop-and-frisk data Storytelling with data 113–114 graphic 175 interactive “data stories,” 173–174 Surveys. See also specific surveys cadastral maps and 10, 156, 165 ethical xii political phone surveys xii property surveys 36 urban planning and 42 Swissnex San Francisco 85 Taddeo, Mariarosaria 210 Tangshan, China 57 “Technological redlining,” xiii Tele Atlas 54–55 Temple of Heaven 61 “Ten Simple Rules for Responsible Big Data Research” (Zook et al.) 92, 93–94 “Terms of service,” 90 Tesla 190 Texas 174 Constitution and Voting Act in 9 redistricting in 8 Thatcher, Jim 191 thisisyourdigitallife (app) 91 Thornburg v.

We Are All Fast-Food Workers Now: The Global Uprising Against Poverty Wages
by
Annelise Orleck
Published 27 Feb 2018
It is not a conventional work of scholarship, though it is based on abundant research: 140 interviews; government documents; foundation reports; news coverage; organizational websites and records; insights from scholars of labor, globalization, transnational capitalism, and agribusiness. I make no pretense of objectivity. This is an uneasy hybrid: data, storytelling and analysis, politics, polemics and poetry. And it is a history of sorts, I have come to realize—an urgent history of now. I began this work because I felt called on in a time of globalization, as an ever-spreading flood of capital transforms our world, to better understand how low-wage workers are starting to resist, to think and act globally as well as locally.
Mind in Motion: How Action Shapes Thought
by
Barbara Tversky
Published 20 May 2019
Collins (Eds.), Representation and understanding: Studies in cognitive science (pp. 211–237). New York, NY: Academic Press. Schiffrin, D., Tannen, D., & Hamilton, H. E. (Eds.). (2008). The handbook of discourse analysis. New York, NY: Wiley. Tversky, B. (2018). Story-telling in the wild: Implications for data storytelling. In S. Carpendale, N. Diakopoulos, N. Henri-Riche, & C. Hurter (Eds.), Data-driven storytelling. New York, NY: CRC Press. Tversky, B., Heiser, J., & Morrison, J. (2013). Space, time, and story. In B. H. Ross (Ed.), The psychology of learning and motivation (pp. 47–76). San Diego, CA: Elsevier Academic Press. https://doi.org/10.1016/B978-0-12-407237-4.12001-8 Comics can be effective for learning Aleixo, P.
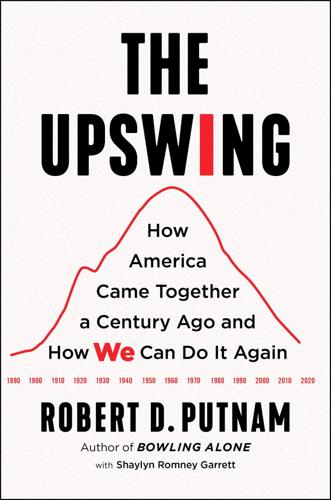
The Upswing: How America Came Together a Century Ago and How We Can Do It Again
by
Robert D. Putnam
Published 12 Oct 2020
The Upswing is a must-read for those who wonder how we can once again reclaim our nation’s promise.” —William Julius Wilson, Lewis P. and Linda L. Geyser University Professor Emeritus, Harvard University “No one understands the United States better than Bob Putnam, and no one else could have written this essential book. The Upswing brings together his vast knowledge, love of data, storytelling ability, and passion. It’s an astonishing work that reminds Americans we are a great people, shows us what we can accomplish when we come together, and makes clear that we need to do so again. Now.” —Andrew McAfee, MIT scientist, author of More from Less, and coauthor of The Second Machine Age “The Upswing is a revelation—tailor-made for this polarized age and destined to be a central reference point for urgent debates and determined activism.