labor-force participation

back to index

description: the percentage of working-age people who are either employed or actively seeking work

163 results

pages: 126 words: 37,081

Men Without Work
by Nicholas Eberstadt
Published 4 Sep 2016

A number of research papers find that increases in the number of people receiving SSDI led to lower labor force participation among the general population . . . and to lower earnings . . . However, from 1967 until 2014, the percentage of prime-age men receiving disability insurance rose from 1 percent to 3 percent, not nearly enough to explain the 7.5-percentage-point decline in the labor force participation rate over that period . . . So while SSDI receipt’s impact on prime-age male labor force participation is negative, under reasonable assumptions it is small and cannot explain more than a portion of the overall decline in participation.7 The CEA’s conclusion hinges on the assumption that SSDI is the only source of disability support available to un-workers today.

Kory Kroft et al., “Long-Term Unemployment and the Great Recession: The Role of Composition, Duration Dependence, and Non-Participation” (working paper, National Bureau of Economc Research, Washington, DC). http://www.nber.org/papers/w20273. 17.Rand Ghayad, “The Jobless Trap,” http://citeseerx.ist.psu.edu/viewdoc/download?doi=10.1.1.692.6736&rep=rep1&type=pdf. CHAPTER 7 1.“The Long-Term Decline in Prime-Age Male Labor Force Participation,” whitehouse.gov, last modified June 2016, https://www.whitehouse.gov/sites/default/files/page/files/20160620_cea_primeage_male_lfp.pdf. 2.Ibid., 26–27. 3.Donald O. Parsons, “The Decline in Male Labor Force Participation,” The Journal of Political Economy, Vol. 88, No. 1. (February 1980), pp. 117–34; Chinhui Juhn “Decline of Male Labor Market Participation: The Role of Declining Market Opportunities,” The Quarterly Journal of Economics, Vol. 107, No. 1 (Feb., 1992), pp. 79–121, Published by Oxford University Press, Stable URL: http://www.jstor.org/stable/211832. 4.Ravi Balakrishnan et al., “Recent U.S.

For men twenty-to-sixty-four, for example, the numbers not in the labor force more than quintupled between 1965 and 2015, soaring from 3 million to 16 million. While the overall male twenty-to-sixty-four labor force grew by about 1 percent a year over these decades, the ranks of their economically inactive counterparts were swelling more than three times that fast. The labor force participation rate (LFPR)—job holders and job seekers relative to the population from which they are drawn—for prime-age men fell from a monthly average of 96.6 percent in 1965 to just 88.2 percent in 2015. Expressed another way, the proportion of economically inactive men of prime working age leapt from 3.4 percent in 1965 to 11.8 percent in 2015.

pages: 105 words: 25,871

A Nation of Takers: America’s Entitlement Epidemic
by Nicholas Eberstadt and Nick Eberstadt
Published 18 Oct 2012

Figure 22 frames the dynamic by outlining trends in the labor force participation rate—the ratio of persons working or seeking work in relation to the total reference population. From 1948 to 2011 the overall labor force participation rate for American adults age twenty and over rose—from about 59 percent to about 66 percent, despite the 2008 crash. But this arithmetic average is the confluence—really, a convergence—of two very different trends. Since 1948 the U.S. female labor force participation rate has soared: from about 32 percent to almost 60 percent. But over those same years, the male labor force participation rate plummeted: from about 89 percent to just 73 percent.

Americans with jobs work much longer nowadays than their continental European counterparts: by the reckoning of Harvard’s Alberto Alesina and his colleagues, in the early years of the 2000s, employed Americans were working an average of more than eighteen hundred hours per year—20 to 25 percent longer than the average German or French worker, 35 percent longer than the average for Sweden, and almost 50 percent longer than counterparts in the Netherlands.36 But these averages are for people actually at work. Paradoxically, labor force participation ratios for men in the prime of life are demonstrably lower in America than in Europe today. The paradox is highlighted in Figure 24, which contrasts labor force participation rates for men in their late thirties in the United States and Greece. In the United States, as in most modern societies, men in their late thirties are the demographic group within society with the very highest rates of labor force participation. And Greece, given its ongoing public debt and finance travails, is at the moment a sort of poster child for the over-bloated, unsustainable European welfare state.

For American men twenty years of age and older, Figure 23 depicts both the employment to population ratio and the labor force participation rate. The gap between these two lines represents the unemployed; those in the workforce, seeking employment, but without jobs. As may be seen, a terrible gap between these two lines opened up in 2008, with the paroxysms of the Great Recession. At its widest level in postwar history—that is, in the year 2010—that gap amounted to 6.5 percent of the total male population ages twenty and older. On the other hand, in the sixty years between 1948 and 2008—that is to say, before the subsequent crash—the male labor force participation rate fell by nearly 13 percentage points.

pages: 445 words: 122,877

Career and Family: Women’s Century-Long Journey Toward Equity
by Claudia Goldin
Published 11 Oct 2021

Those in Group Four sensed, as young women, that they could be in the labor force for much of their lives. They prepared themselves for longer and more continuous employment. But greater labor force participation was not, in fact, a central outcome of the Quiet Revolution. Changes in occupations and a career orientation were the real changes. In fact, there was no great break in the employment trends. The one exception is that the labor force participation for women with infants soared from the early 1970s to the 1990s. Women with young children, even many with infants, worked because they had well-paying careers that rewarded continuity on the job.

Comparing fall/winter 2020 to the same for 2019, the labor force participation rate among college-graduate women aged twenty-five to thirty-four with preschool children (younger than five years old) fell by just 1.2 percentage points (from a base of 75 percent). But the rate for mothers aged thirty-five to forty-four with elementary and middle school–aged children (five to thirteen years old) fell by 4.9 percentage points (from a base of 86 percent)—a lot more. The noncollege group, either with or without children, had large decreases in labor force participation since they had been employed in the most vulnerable industries.

Rather, it enabled couples to control the timing of births. 121  others could afford to wait    Goldin and Katz (2002) describe the model that generates an increased age at first marriage with the diffusion of the Pill, and provide evidence concerning the timing of the Pill’s spread among young women. 122  compelled Betty to write an e-mail to DeLong    E-mail from Betty Clark, a petroleum geologist, written to Brad DeLong (September 2010), when she “accidently stumbled into [his] introductory economics class having found the Berkeley webcasts.” Personal correspondence from Brad DeLong. Emphasis in original. 122  This was not a coup d’état    Collins (2009), in her sweeping and engaging volume, comes to the same conclusion. 124  greater labor force participation was not    See Goldin and Mitchell (2017) for changes in the labor force participation of women since the 1960s. 124  participation for women with infants soared    March Current Population Survey, for white non-Hispanic women. The participation rate of women with an infant increased from 0.20 in 1973 to 0.62 by 2000 and has been at about that level ever since. 126  increase from 33 percent to 80 percent    The actual employment rate for a thirty-five-year-old woman in 1978 was 56 percent.

pages: 397 words: 121,211

Coming Apart: The State of White America, 1960-2010
by Charles Murray
Published 1 Jan 2012

But the rest of the trendline reflects in part an increase in the number of people seeking to get benefits who aren’t really unable to work—an increase in Americans for whom the founding virtue of industriousness is not a big deal anymore. Labor Force Participation More evidence for the weakening of the work ethic among males comes from the data on labor force participation—the economist’s term for being available for work if anyone offers you a job. When the average labor force participation rate in 1960–64 is compared with the rate from 2004 through 2008 (before the recession began), as shown in Figure 9.2, white male labor-force participation fell across the entire age range.1 FIGURE 9.2. WHITE MALES NOT IN THE LABOR FORCE: 1960–64 COMPARED TO 2004–8 Source: IPUMS.

I begin with married women, shown in Figure 9.8. FIGURE 9.8. LABOR FORCE PARTICIPATION AMONG MARRIED WOMEN BY EDUCATION Source: IPUMS. Sample limited to married white women ages 30–49. The short story is that married women in Belmont and Fishtown behaved similarly, starting out within 6 percentage points of each other in 1960 and ending up within 7 percentage points of each other in 2008. Married women in both neighborhoods roughly doubled their labor force participation. It was a revolution indeed, transforming the labor force participation of married women. Creaming had a trivial effect. Now turn to single women, who exhibit the different pattern shown in Figure 9.9.

The main story line is that the baseline figures in 1960 were 95 percent and 95 percent, respectively, and that the disaster has struck Fishtown no matter which racial aggregation is used—and that the intact family remained strong in Belmont, no matter which racial aggregation is used. Industriousness Figure 16.3 shows the story for labor force participation among males ages 30–49. FIGURE 16.3. MALE LABOR FORCE PARTICIPATION BY EDUCATION FOR ALL PRIME-AGE MEN Source: IPUMS CPS. Samples limited to persons ages 30–49. As you may recall from chapter 9, the Belmont-Fishtown breakdown for analyzing labor force participation isn’t feasible because so many people who are out of the labor force have no occupation. Figure 16.3 therefore compares men with no more than twelve years of education with those who have at least sixteen years of education.

pages: 555 words: 80,635

Open: The Progressive Case for Free Trade, Immigration, and Global Capital
by Kimberly Clausing
Published 4 Mar 2019

One factor that does not, however, appear to be a meaningful driver of labor force participation is international trade.4 In years of rapid import growth, labor force participation has often grown, whereas labor force participation has fallen most in years of flatter import trends. Thus, considering our low unemployment rate as well as the insensitivity of labor force participation to trade, even draconian reductions in imports would be unlikely to increase the number of jobs in the economy by more than a percent or two. Yet it would take far more labor than one or two percent of the labor force to produce the goods that we currently import.

Historical data support this idea; there are few years in the United States (or elsewhere) where unemployment has been lower than 4 percent.3 Therefore, there is probably not much room to lower the unemployment rate further. Some argue that labor force participation could be changed. Many people who are not in the labor force, however, have reasons for their nonparticipation. They are in school, or have retired early, or have chosen to stay home with children. These workers are unlikely to be lured into the labor force by the prospect of jobs making T-shirts or home furnishings. Still, labor force participation is not constant over time. Over the period of 1980 to 1995, it rose about 2.5 percent in the United States (from about 64 percent to about 66.5 percent), in part due to women’s increasing participation in the labor force.

Over the period of 1980 to 1995, it rose about 2.5 percent in the United States (from about 64 percent to about 66.5 percent), in part due to women’s increasing participation in the labor force. Since 2000, labor force participation has dropped by more than 4 percent (from about 67 percent to under 63 percent), with the steepest part of that decline happening during the Great Recession, and a more level trend in recent years (fig. 3.1). It is clear that the Great Recession drove some workers out of the labor force, but demographic factors also contributed. Much of the recent decline in labor force participation is due to the aging of the population, since older workers are more likely to retire early. One factor that does not, however, appear to be a meaningful driver of labor force participation is international trade.4 In years of rapid import growth, labor force participation has often grown, whereas labor force participation has fallen most in years of flatter import trends.

pages: 484 words: 104,873

Rise of the Robots: Technology and the Threat of a Jobless Future
by Martin Ford
Published 4 May 2015

Karabarbounis and Neiman concluded that these global declines in labor’s share resulted from “efficiency gains in capital producing sectors, often attributed to advances in information technology and the computer age.”23 The authors also noted that a stable labor share of income continues to be “a fundamental feature of macro-economic models.”24 In other words, just as economists do not seem to have fully assimilated the implications of the circa-1973 divergence of productivity and wage growth, they are apparently still quite happy to build Bowley’s Law into the equations they use to model the economy. Declining Labor Force Participation A separate trend has been the decline in labor force participation. In the wake of the 2008–9 economic crisis, it was often the case that the unemployment rate fell not because large numbers of new jobs were being created, but because discouraged workers exited the workforce. Unlike the unemployment rate, which counts only those people actively seeking jobs, labor-force participation offers a graphic illustration that captures workers who have given up. As Figure 2.5 shows, the labor force participation rate rose sharply between 1970 and 1990 as women flooded into the workforce.

The participation rate for women peaked at 60 percent in 2000; the overall labor force participation rate peaked at about 67 percent that same year.26 Figure 2.5. Labor Force Participation Rate SOURCE: US Bureau of Labor Statistics and Federal Reserve Bank of St. Louis (FRED).25 Labor force participation has been falling ever since, and although this is due in part to the retirement of the baby boom generation, and in part because younger workers are pursuing more education, those demographic trends do not fully explain the decline. The labor force participation rate for adults between the ages of twenty-five and fifty-four—those old enough to have completed college and even graduate school, yet too young to retire—has declined from about 84.5 percent in 2000 to just over 81 percent in 2013.27 In other words, both the overall labor force participation rate and the participation rate for prime working-age adults have fallen by about three percentage points since 2000—and about half of that decline came before the onset of the 2008 financial crisis.

Ibid. 25. Labor Force Participation Rate Graph, Data Source: FRED, Federal Reserve Economic Data, Federal Reserve Bank of St. Louis: Civilian Labor Force Participation Rate, Percent, Seasonally Adjusted [CIVPART]; http://research.stlouisfed.org/fred2/graph/?id=CIVPART; accessed April 29, 2014. 26. Graphs showing the participation rates for men and women can be found at the Federal Reserve Economic Data website; see http://research.stlouisfed.org/fred2/series/LNS11300001 and http://research.stlouisfed.org/fred2/series/LNS11300002, respectively. 27. A graph of the labor force participation rate for adults twenty-five to fifty-four years of age can be found at http://research.stlouisfed.org/fred2/graph/?

pages: 1,104 words: 302,176

The Rise and Fall of American Growth: The U.S. Standard of Living Since the Civil War (The Princeton Economic History of the Western World)
by Robert J. Gordon
Published 12 Jan 2016

Although more than half of federal government employees were women, they made up 1.4 percent of civil-service workers in the top four pay grades.17 Starting in the mid-1960s, the end of the baby boom resulted in a prolonged period of growth in female labor force participation, as shown in figure 15–2. Despite the baby boom the labor force participation rate (LFPR) for “prime-age” females (aged 25–54) had already inched up from 34.9 percent in 1948 to 44.5 percent in 1964. Then began the period of most rapid growth to 69.6 percent in 1985 and then to a peak of 76.8 percent in 1999, followed by a slow decline to 73.9 percent in 2014. Figure 15–2. Labor Force Participation Rate by Gender, Ages 25 to 54, 1950–2015 Source: Bureau of Labor Statistics, LNS11300061 and LNS 11300062.

Schooling in 1870 was generally limited to elementary school, with few young people extending their education beyond age 12, and even then often dependent on parental willingness to pay for private schooling. Labor-force participation was high for males aged 16–19. The difference between male and female teenagers should be underlined, with 1870 participation rates for ages 16–19 at 76.1 percent for male teenagers but only 29 percent for females. Furthermore, female participation was relatively short-lived and was terminated by the first pregnancy, whereas male participation was continuous from age 15, or even age 12, to the end of the working life. High labor force participation of male teenagers was a matter of necessity. The nuclear family had to provide all the labor needed to raise the crops and maintain the household.

And those working hours steadily declined, from a typical sixty-hour work week in 1900 to a typical forty-hour week after 1940. The chapter begins by describing changes in the average work experience of Americans. Labor force participation of adult males declined even as that of females increased. As more people lived beyond age 65 thanks to increasing life expectancy, the concept of retirement was invented.3 For the few males who survived past age 65 in 1870, the male labor force participation rate in the age group 65–75 was an astonishing 88 percent. And as life expectancy was extended, the transformation of life at ages older than 65 took on new importance.

pages: 976 words: 235,576

The Meritocracy Trap: How America's Foundational Myth Feeds Inequality, Dismantles the Middle Class, and Devours the Elite
by Daniel Markovits
Published 14 Sep 2019

See Bureau of Labor Statistics, “Labor Force Projections to 2022: The Labor Force Participation Rate Continues to Fall,” Monthly Labor Review (December 2013), www.bls.gov/opub/mlr/2013/article/labor-force-projections-to-2022-the-labor-force-participation-rate-continues-to-fall.htm; Bureau of Labor Statistics, The Recession of 2007–2009 (February 2012), www.bls.gov/spotlight/2012/recession/; and Executive Office of the President of the United States, The Labor Force Participation Rate Since 2007: Causes and Policy Implications (July 2014), https://scholar.harvard.edu/files/stock/files/labor_force_participation.pdf. with a BA only: Carnevale, Rose, and Cheah, “The College Payoff,” 6.

See Bureau of Labor Statistics, “Labor Force Projections to 2022: The Labor Force Participation Rate Continues to Fall,” Monthly Labor Review (December 2013), www.bls.gov/opub/mlr/2013/article/labor-force-projections-to-2022-the-labor-force-participation-rate-continues-to-fall.htm. Melinda Pitts, John Robertson, and Ellyn Terry, “Reasons for the Decline in Prime-Age Labor Force Participation,” Federal Reserve Bank of Atlanta Macroblog, April 10, 2014, http://macroblog.typepad.com/macroblog/2014/04/reasons-for-the-decline-in-prime-age-labor-force-participation-.html. See also Martin Wolf, “America’s Labor Market Is Not Working,” Financial Times, November 3, 2015.

imposed on women at midcentury: For prime-aged men, the labor force participation rate has fallen substantially, from roughly 96 percent in 1970 to roughly 88 percent today (the second-lowest rate of any advanced industrialized country, ahead only of Italy). See Melinda Pitts, John Robertson, and Ellyn Terry, “Reasons for the Decline in Prime-Age Labor Force Participation,” Federal Reserve Bank of Atlanta Macroblog, April 10, 2014, http://macroblog.typepad.com/macroblog/2014/04/reasons-for-the-decline-in-prime-age-labor-force-participation-.html; Nicholas Eberstadt, “Where Did All the Men Go?,” Milken Institute Review, April 28, 2017, www.milkenreview.org/articles/where-did-all-the-men-go.

The Singularity Is Nearer: When We Merge with AI
by Ray Kurzweil
Published 25 Jun 2024

Louis, updated April 20, 2023, https://fred.stlouisfed.org/series/LFWA25TTUSM647N. BACK TO NOTE REFERENCE 112 US Bureau of Labor Statistics, “Civilian Labor Force Participation Rate: 25 to 54 years (LNU01300060).” BACK TO NOTE REFERENCE 113 Note that although labor force participation among Americans fifty-five and older has been increasing, the net effect is lower overall labor force participation because the fifty-five-plus demographic has a much lower overall participation rate than younger adults, and because the size of that demographic is growing due to the baby boomers’ being a much larger cohort than the generation they are replacing.

The government statistics on this do not perfectly capture economic reality, as they do not include several categories—including agricultural workers, military personnel, and federal government employees—but they are still useful for showing the direction and approximate magnitude of these trends. US Labor Force Participation Rate[108] Shaded areas indicate US recessions Source: US Bureau of Labor Statistics Yet while some of this decline is likely due to automation, there are two major confounding factors. First, as Americans become more educated, fewer teenagers are working, and many people are staying in college and graduate school well into their twenties.[109] Also, as the large baby boomer generation increasingly ages into retirement, the proportion of Americans of working age is decreasing.[110] If instead we look at the labor force participation rate among prime working-age adults aged twenty-five to fifty-four, the decline almost disappears—as of early 2023, the participation rate is 83.4 percent, as compared with 84.5 percent at its peak in 2000.[111] This is still a difference of around 1.7 million people in today’s population, but much less than the previous chart makes it appear.[112] US Labor Force Participation Rate, Ages 25–54[113] Shaded areas indicate US recessions Source: US Bureau of Labor Statistics In addition, since 2001 there has been a significant increase in participation by people fifty-five and over.

BACK TO NOTE REFERENCE 64 US Bureau of Labor Statistics, “Labor Force Participation Rate (CIVPART),” retrieved from FRED, Federal Reserve Bank of St. Louis, updated September 3, 2021, https://fred.stlouisfed.org/series/CIVPART; US Bureau of Labor Statistics, “Civilian Labor Force Level (CLF16OV).” BACK TO NOTE REFERENCE 65 International Labour Organization, “Labor Force, Female (% of Total Labor Force)—United States,” retrieved from Worldbank.org, September 2019, https://data.worldbank.org/indicator/SL.TLF.TOTL.FE.ZS?locations=US; US Bureau of Labor Statistics, “Labor Force Participation Rate (CIVPART)”; US Bureau of Labor Statistics, “Civilian Labor Force Participation Rate: Women (LNS11300002),” retrieved from FRED, Federal Reserve Bank of St.

Social Capital and Civil Society
by Francis Fukuyama
Published 1 Mar 2000

Chart 22 plots changes in female labor force participation 422 The Tanner Lectures on Human Values [FUKUYAMA] Social Capital 42 3 against changes in the divorce rate between approximately 1970 and 1990 for eight selected OECD countries. The chart indicates that there is a broad correlation between women moving into the labor force and changes in divorce rates. Chart 23 plots changes in female labor force participation against the 1993 illegitimacy rate for nine OECD countries. The fit here is a bit less good than for divorces, but once again there is a broad correlation between female labor force participation and change in family structure.

The weakening norm of male responsibility reinforced, in turn, the need for women to arm themselves with job skills so as not to be dependent on decreasingly reliable husbands. There is considerable empirical evidence that Becker is right about the importance, to put it crudely, of husbands as economic commodities in marriage markets. Chart 18 shows the changing rate of male v. female labor force participation in the United 57Becker, A Treatise on the Family, pp . 347–61. 4420 2 The Tanner Lectures on Human Values States 1960 and 1995. Not only does female participation jump from 35 to 55 percent in this 35-year period, but male participation actually drops from 7 9 to 71 percent. Chart 19 shows changes in male and female median incomes in the United States between 1947 and 1995.

Crime rates, low to begin with by OECD standards, have also fallen over the same period, as have other social deviance indicators. 424 The Tanner Lectures on Human Values Why the Japanese have escaped the disruptions experienced by other developed countries emerges clearly from the data. While Japanese rates of female labor force participation are not unusually low for an OECD country, they mask a much greater economic disparity between men and women. A woman’s decision either to remain unmarried or to raise a family without the benefit of a husband depends not simply on her having a job, but also on her prospects for being self-supporting over a lifetime.

pages: 440 words: 108,137

The Meritocracy Myth
by Stephen J. McNamee
Published 17 Jul 2013

Delaying Retirement Not only are Americans working more, but they are also working longer over a lifetime. Demographer Murray Gendall (2008) documents that rates of labor-force participation for Americans over sixty-five have sharply increased since the mid-1980s, especially for women. Between 1985 and 2007, Gendall shows that rates of labor-force participation increased among men aged sixty-five to sixty-nine (25 to 34 percent), seventy to seventy-four (15 to 21 percent), and seventy-five and older (7 to 10 percent).[3] Labor-force participation increased among women aged sixty to sixty-four (33 to 48 percent), sixty-five to sixty-nine (14 to 26 percent), seventy to seventy-four (8 to 14 percent), and seventy-five and older (2 to 5 percent).

There are many reasons for the dramatic increase in female labor-force participation, including declining fertility; increasing divorce rates; growth of the service sector, in which women have been historically overrepresented; increasing levels of educational attainment among women; and the changing role of women in society. Another generally acknowledged factor is that women work for the same reason men do: to make ends meet. As prices have increased and wages have remained stagnant, more women have been drawn into the labor force to help make ends meet. Besides a sharp rise in female labor-force participation, there has also been a sharp increase in dual-income families.

But as societies shift to industrial economies, children become net economic liabilities instead of potential economic assets. In a reinforcing pattern, reduced fertility is also associated with increased labor-force participation among women. That is, as more women work outside the home, they tend to have fewer children, and as women have fewer children, they tend to increase their rates of labor-force participation. While reduced fertility rates have many potential causes, demographers generally agree that economic factors are paramount. According to the U.S. Department of Agriculture (2012, 23), the estimated cost of raising one child to age eighteen without college in 2011 for middle-income husband-wife families was $234,900.[1] Adding the average cost of a four-year public college education for in-state residents in the 2011–2012 academic year of $68,544[2] (College Board 2012) brings the total tab per child to slightly over $303,444.

pages: 211 words: 57,759

Why Women Have Better Sex Under Socialism: And Other Arguments for Economic Independence
by Kristen R. Ghodsee
Published 20 Nov 2018

Socialists, such as the German theorists Clara Zetkin and August Bebel, believed women’s liberation required their full incorporation into the labor force in societies in which the working classes collectively owned the factories and productive infrastructure. This was a much more audacious and perhaps utopian goal, but all subsequent experiments with socialism would include women’s labor force participation as part of their program to refashion the economy on a more just and equitable basis. The perception that a woman’s labor is less valuable than a man’s persists to this day. In a capitalist system, labor power (or the units of time we sell to our employers) is a commodity traded in the free market.

And as women withdraw from the labor force to care for the young, the sick, or elderly relatives, discrimination against women workers becomes more entrenched, since employers view them as less reliable (more on this in the next chapter), and the cycle of women’s economic dependence on men continues. To counter the effects of discrimination and the wage gap, socialist countries devised policies to encourage or require women’s formal labor force participation. To a greater or lesser degree, all state socialist countries in Eastern Europe demanded the full incorporation of women into paid employment. In the Soviet Union and particularly in Eastern Europe after World War II, labor shortages drove this policy. Women have always been used as a reserve army of labor when the men are off at war (just like American women’s employment during the World War II era of Rosie the Riveter).

They benefitted from free health care, public education, and a generous social safety net that subsidized shelter, utilities, public transportation, and basic foodstuffs. In some countries, women could retire from formal employment up to five years earlier than men. Despite the shortcomings of the command economy, the socialist system also promoted a culture in which women’s formal labor force participation was accepted and even celebrated. Before World War II, Eastern Bloc countries were deeply patriarchal, peasant societies with conservative gender relations emerging from both religion and traditional culture. Socialist ideologies challenged centuries of women’s subjugation. Because the state required girls’ education and compelled women into the labor force, their fathers and husbands couldn’t force them to stay home.

pages: 424 words: 119,679

It's Better Than It Looks: Reasons for Optimism in an Age of Fear
by Gregg Easterbrook
Published 20 Feb 2018

The numbers, this conspiracy theory goes, are manipulated to mask labor-force participation, the fraction of prime-aged, healthy adults with jobs. In December 2016, just before Barack Obama left office, radio host Rush Limbaugh told listeners that labor-force participation “is at an all-time low.” The actual postwar low for labor-force participation came in 1966, when 60 percent of prime-aged, healthy Americans held jobs. In January 2017, 63 percent of prime-aged, healthy Americans held jobs. Adjusting for population growth, had the labor-force participation rate of 1966 been in effect in 2017, there would have been 117 million Americans employed; instead, the number for 2017 was 152 million with jobs.

According to the Federal Reserve Bank of St. Louis, the labor-force participation rate for men has indeed fallen in recent decades, from 86 percent in 1950 to 69 percent in 2015. Simultaneously, labor-force participation for women has risen sharply, from 33 percent in 1950 to 57 percent in 2015. Summing these trends—moderate decline in laboring men, a larger increase in women working for wages—results in a solid employment picture for the United States, though of course improvement is needed. When commentators say that US labor-force participation is some kind of economic disaster, what they are saying in effect is that men having jobs is more important than women having jobs.

When commentators say that US labor-force participation is some kind of economic disaster, what they are saying in effect is that men having jobs is more important than women having jobs. Or that white men having jobs is more important than African American and Hispanic men working. Since about 2000, white male labor-force participation is down while African American and Hispanic male labor-force participation is up. As the social scientist Charles Murray showed in his 2010 book Coming Apart, most movement in labor-force participation for men traces to unmarried white males dropping out of the working world. Some prime-aged white men stop working, Murray writes, not because they cannot find a job but because they do not want or need one.

pages: 566 words: 160,453

Not Working: Where Have All the Good Jobs Gone?
by David G. Blanchflower
Published 12 Apr 2021

The most obvious example of that relates to young people who turn to education when job opportunities are not available. As labor market slack has fallen since 2009 the participation rates of prime-age and young workers have risen. At the same time the continuing upward trend of more labor force participation of those 55 and older has continued. The very different post-recession trends in the United States versus those of other advanced countries can be shown in another way via the labor force participation rate (LFPR), or activity rate. The LFPR rose steadily from the end of World War II in the United States and elsewhere postwar as an increasing proportion of women joined the labor force.

The number of people who reported being NILF because they were ill or disabled rose over this period by just under 4 million (+32%). There is scant evidence of any pickup in the U.S. prime-age male rate of labor force participation. For women, LFPRs have risen in every country except the United States. Notable is the rise in the LFPR in Japan, which was targeted in Abenomics to get women back into the labor force. Krueger has claimed that “the labor force participation rate has stopped rising for cohorts of women born after 1960”; but that doesn’t seem to be right.18 The latest data from the BLS suggest that isn’t the case and show a rise for the younger two prime-age groups since the start of 2012.

They found a slight decline in the incidence of alternative work arrangements from 10.7 percent in 2005 to 10.1 percent in 2017. Rising Inequality: Let Them Eat Cake The CEA (2016a) concludes that the trends in the labor force participation rate for prime-age men are associated with other economic trends such as rising inequality. They modeled the association between a $1,000 increase in annual wages at different percentiles of the wage distribution in a state and its prime-age male labor force participation rate, controlling for time-invariant state differences as well as national time trends. The correlation they found was strongest at the bottom of the wage distribution: at the 10th percentile, a $1,000 increase in annual wages, or a roughly $0.50 increase in hourly wages for a full-time, full-year worker, is associated with a 0.17-percentage-point increase in the state labor force participation rate for prime-age men.

pages: 462 words: 129,022

People, Power, and Profits: Progressive Capitalism for an Age of Discontent
by Joseph E. Stiglitz
Published 22 Apr 2019

Of course, what matters is not just growth in national output, but in living standards of ordinary Americans,2 and that requires not just increases in productivity, but that ordinary citizens get a fair share of that increase. The trouble in recent decades is that neither labor force participation nor productivity have been doing well—and the benefits of what gains have occurred have gone to the top. Labor force growth and participation Labor force growth is related in part to demographics about which government can’t do much: the aging of the baby boomers and the decline in birthrates.3 But the government can do something about immigration and labor force participation. Trump is set to lower the former—thus slowing growth—and has no agenda for the latter even though there are some attractive options.

Obviously, a country where there is such despair, where so many are on drugs or drinking too much alcohol, won’t have a healthy labor force. A good measure of how well society does in creating good jobs and healthy workers is the fraction of working-age population that is participating in the labor force and working. Here, the US does far worse than many other countries. At least some of our poor labor force participation can be directly linked to our poor health statistics. A recent study by Alan Krueger, former chair of the Council of Economic Advisers, found that nearly half of “prime-age men” not in the labor force suffer from a serious health condition, and two-thirds of those are also taking some prescription pain medication.36 But America’s poor health is not the result of an unhealthy climate, nor is it because sickly people have migrated to these shores.

Again, unfortunately, these are reforms that the market won’t make on its own. The power of corporations over workers is just too great; they don’t need to do these things; and they don’t care about the greater benefits to our society. That’s why government will have to take an active role in pushing these changes. Our labor force participation would be higher too if we had a healthier population. It’s not the climate, and it’s not the air we breathe or the water we drink that has led America to have a less healthy population living shorter lives than in other advanced countries, less able and willing to be active participants in the labor force.

pages: 204 words: 67,922

Elsewhere, U.S.A: How We Got From the Company Man, Family Dinners, and the Affluent Society to the Home Office, BlackBerry Moms,and Economic Anxiety
by Dalton Conley
Published 27 Dec 2008

Jeffrey Timberlake, for example, about a quarter of American children experience two or more mothers’ partners by the time they are fifteen!7 Over 8 percent experience three or more maternal domestic partners! That’s a lot of earning power coming and going (not to mention emotional turmoil). Over and above the part that female labor force participation plays in family income fluctuation, the increasingly important role that women play in the economic life of a family forms the bedrock of the real story of middle-class anxiety. That’s because household labor—most notably child care—has not gotten any easier in the meantime. Blending work and home responsibilities is no easy feat, especially in a 24/7 service economy that allows many of us to work from home at all hours.

And as we all know, it’s hard to put something back together once it has shattered into a million pieces. The next chapter details the concrete changes that led us little by little from the social ethic of the 1950s to the Elsewhere Ethic of intravidualism today. As we shall see, there is no one trend— the rise of computers, increasing female labor force participation, suburbanization—that can get us from there to here. Just as it is the intersection of the economic red shift, the portable workshop, and the price society—and not any of these alone— that creates this new social landscape, so it is a series of parallel and interrelated historical steps that has fundamentally altered the everyday experience of many professionals in America over the last fifty years.

Today, almost two thirds of women with children under six years of age work (63 percent); by contrast, the figure was just over one third (39 percent) in 1975.39 Instead of cooking for their families, many low-wage women now reheat preprocessed food for other families in the restaurant industry. Instead of waiting on their own husband and kids, many women without college degrees wait on your kids. (Waitressing is, in fact, the number one profession for women without a college education.)40 This story of women’s rising labor force participation has the potential to increase economic inequality when it combines with what demographers call assortative mating—otherwise known as like-marrying-like. That is, since 1967, the demographer Christine Schwartz demonstrates that among two-earner couples, the similarity in their wages has risen by about threefold.

pages: 98 words: 27,609

The American Dream Is Not Dead: (But Populism Could Kill It)
by Michael R. Strain
Published 25 Feb 2020

It is how we contribute to society—and, importantly, how we can (correctly) be made to feel that we are contributing. It is a cure for boredom, which is one of the worst parts of life in a safe, modern, comfortable society. Work creates community. It emancipates us from our passions by directing them to productive ends. FIGURE 1. PRIME-AGE LABOR FORCE PARTICIPATION RATE. Properly understood, work is deeply spiritual. Pope John Paul II wrote that man is “called to work.” “Man is the image of God,” wrote the late Pope, “partly through the mandate received from his Creator to subdue, to dominate, the earth. In carrying out this mandate, man, every human being, reflects the very action of the Creator of the universe.”

Whether Americans today earn more in the labor market than their parents did is critical if you believe that earnings are a uniquely important source of income to a sense of contribution and personal dignity. To examine this, I compare the earnings of fathers and sons. It is common not to include females in this type of analysis, because their patterns of labor supply are less steady than for men, and because the effects of the significant increase in female labor force participation over this time period would be difficult to separate from earnings mobility. I also do not size-adjust these comparisons, as they are one to one. Finally, the earnings number includes wages, salaries, commissions, tips, bonuses, and the like—earnings from the labor market. Other than those items, the analysis here is the same as for income.

Policy should encourage entrepreneurship and economic dynamism, advance free trade and the efficiencies and productivity gains (and thus wage gains) it brings over time, increase high-skilled immigration, and put the national debt on a downward trajectory by reforming middle-class entitlement programs. Economic opportunity and earned success are critical to the American Dream, so public policy should work aggressively to increase labor force participation. More generous earnings subsidies can pull more people into the workforce and can lift the incomes of the working poor and working class. Relocation assistance targeted to long-term unemployed workers in struggling local labor markets can offer those workers a hand up to better employment opportunities.

pages: 291 words: 81,703

Average Is Over: Powering America Beyond the Age of the Great Stagnation
by Tyler Cowen
Published 11 Sep 2013

On these and other factors behind labor force participation, see Willem Van Zandweghe, “Interpreting the Recent Decline in Labor Force Participation,” Federal Reserve Bank of Kansas City, 2012. On Belle, see Joe Condon and Ken Thompson, “Belle Chess Hardware,” reprinted in, Computer Chess Compendium (New York: Ishi Press International, 2009), 286–92, David Levy, editor. On nonhuman DJs, see John Roach, “Non-Human DJ Gets Radio Gig,” NBC News,www.today.com/tech/non-human-dj-gets-radio-gig-121286. On various points concerning unemployment and labor force participation, see David Wessel, “What’s Wrong with America’s Job Engine,” The Wall Street Journal, July 27, 2011.

We may have accepted that machines won’t put everyone out of work, and that the rise of intelligent machines will benefit a lot of us greatly, but there can be little doubt that they will also put a few percent of us out of work for some time to come. Consider what economists call the “labor force participation rate.” It refers to the percentage of people—other than the very young and old—who in fact have jobs. You can see clearly in the chart that it has been going down for some time. Human labor suddenly doesn’t appear so indispensable, does it? Labor force participation depends on numerous factors, including the business cycle, savings, availability of benefits, and lifecycle and gender considerations. But let’s focus on how intelligent machines are likely to make a big difference across the next few decades.

Just how rewarding is work these days? The single best number to look at is the labor force participation rate, which circa 2012 showed that around 63 percent of the labor force was looking for work. Yet not all of these individuals have jobs, so the percentage of individuals in the labor force with jobs stands at around 58 percent. That figure hasn’t been so low since the early 1980s. (In those days the number was so low because fewer women wanted to work or had the opportunity to work.) Those numbers on labor force participation are telling us that, for whatever reason, over 40 percent of adult, non-senior Americans don’t consider it worthwhile to have a job.

pages: 566 words: 163,322

The Rise and Fall of Nations: Forces of Change in the Post-Crisis World
by Ruchir Sharma
Published 5 Jun 2016

Free the Forced Retirees In recent decades the widening impact of population decline has been magnified by a worldwide decline in the labor force participation rate—or the share of working-age adults who are in a job or looking for one. There are some major exceptions to this drop-off in workers, including Germany, France, Japan, and the United Kingdom, but the United States is seeing one of the more dramatic declines. In the last fifteen years, the labor force participation rate in the United States has fallen from 67 to 62 percent, much of it coming after the global financial crisis. Without that decline in participation, the U.S. labor force would have had twelve million more workers in 2015.

Profamilia took on the powerful Catholic Church and lobbied for wider access to contraception, so that women could choose to delay childbirth in favor of a career. The fertility rate has dropped sharply, while the female labor force participation rate has skyrocketed. In many countries, all the leaders need to do to reap the economic boost from working women is to lift existing restrictions, which is a lot easier than providing costly new childcare services or generous parental leave. Cultures don’t change overnight, but laws can. The IMF says that when countries grant women the right to open a bank account, female labor force participation rises substantially over the next seven years.8 Yet the pool of untapped female talent is still huge.

Without that decline in participation, the U.S. labor force would have had twelve million more workers in 2015. Though some of this shift may be a passing phenomenon, reflecting the millions of unemployed workers who gave up on looking for a job in the frustrating depths of the great recession, the decline in participation would have happened anyway because of aging. In the United States, the labor force participation rate drops from a little over 80 percent for 45-year-olds to less than 30 percent for 65-year-olds, and it is expected to continue falling in most countries as the world ages. Smarter countries are rethinking the whole idea of a “retirement age,” a concept that was unknown before the 1870s.

pages: 678 words: 160,676

The Upswing: How America Came Together a Century Ago and How We Can Do It Again
by Robert D. Putnam
Published 12 Oct 2020

However, powerful as this image has been in shaping twentieth-century gender narratives, in fact, women had been on a steady march into the workplace beginning as early as 1860, as charted in Figure 7.4.24 We see that women’s labor force participation actually grew steadily from 1920 to 1990 (with some acceleration after 1950), progressively closing the gender gap in employment over the span of the entire century. Interestingly, this measure shows no sign of any effect of the 1965–1975 women’s movement on overall female labor force participation.25 FIGURE 7.4: FEMALE LABOR FORCE PARTICIPATION RATE, 1860–2016 Source: Matthew Sobek, “New Statistics on the U.S. Labor Force, 1850–1990,” Historical Methods 34 (2001): 71–87; Current Population Survey.

And though much has been written about the cost to women and the economy of this particular slowdown, it did not actually reflect a retrenchment in gender parity, because the male labor force participation rate was also in decline at this time. In fact, when charting male and female participation in paid work side by side over the full century (Figure 7.5), we see a clear and more or less steady closing of the gender gap, with almost no interruptions. This trend toward growing parity holds for all ethnic groups and ages, with the important exception of women over 55. However, exactly when and how women of different races entered the workforce varies somewhat.27 The trend also holds at every level of family income—however, labor force participation in the twentieth century increased much more rapidly in high-income than low-income households.

Significantly, the trend also holds within all marital statuses, with the largest increase in employment rates among married women.28 The shape of these trends seems to tell the story of a steady march toward equality in the workforce between men and women, a phenomenon which started before America’s larger climb toward a more capacious “we,” and continued long afterward. However, data about labor force participation is merely a measure of quantity—how many women had jobs—not quality—how women were being compensated, treated, and fulfilled in their work. Indeed, a crucial component of Friedan’s call to arms was the demand for meaningful work outside the home. One thought-provoking question when looking at steadily increasing female labor force participation is why more and more women have entered the workplace. Is it indeed to seek fulfillment and meaning, or is it out of growing economic necessity?

pages: 241 words: 78,508

Lean In: Women, Work, and the Will to Lead
by Sheryl Sandberg
Published 11 Mar 2013

This pattern of opting out maps broadly onto trends in women’s employment rates since the 1960s. From the 1960s to the 1990s, there was a dramatic increase in women’s labor force participation, which peaked in 1999 when 60 percent of women were working. Since 1999, there has been a slow decline in women’s employment rates (Bureau of Labor Statistics 2007 and 2011). Mirroring these historical employment patterns among women, opting out reached a low in 1993, the decade that recorded the highest rates of women’s labor force participation, and saw its sharpest increase from 1999 to 2002, the same years that marked the beginning of the decline in women’s overall employment rates (Stone and Hernandez 2012).

Thus, the recent decrease in the employment rates of highly educated mothers needs to be reconciled with employment declines among other groups, including declines for nonmothers and men. All are likely linked in part to a weak labor market (Boushey 2008). Despite this dip in employment, college-educated women have the highest labor force participation rates of all mothers (Stone and Hernandez 2012). According to recent research from the U.S. Census Bureau, young, less-educated, and Hispanic women are more likely to be stay-at-home mothers (Kreider and Elliott 2010). For studies on opting out and women’s labor force participation rates, see Pamela Stone and Lisa Ackerly Hernandez, “The Rhetoric and Reality of ‘Opting Out,’ ” in Women Who Opt Out: The Debate over Working Mothers and Work-Family Balance, ed.

Other research has found that the employment participation rates of women vary across professions. A study of women from the Harvard graduating classes of 1988 to 1991 found that fifteen years after graduation, married women with children who had become M.D.s had the highest labor force participation rate (94.2%), while married women with children who went on to get other degrees had much lower labor force participation rates: Ph.D.s (85.5%), J.D.s (77.6%), MBAs (71.7%). These findings suggest professional cultures play a role in women’s rates of employment. See Jane Leber Herr and Catherine Wolfram, “Work Environment and ‘Opt-Out’ Rates at Motherhood Across Higher-Education Career Paths” (November 2011), http://​faculty.​haas.​berkeley.​edu/​wolfram/​Papers/​OptOut_​ILRRNov11.​pdf. 12.

Crisis and Dollarization in Ecuador: Stability, Growth, and Social Equity
by Paul Ely Beckerman and Andrés Solimano
Published 30 Apr 2002

During periods of insecurity and uncertainty, important household coping strategies include increasing family members’ labor-force participation either by working longer hours at the same job or by mobilizing new household members—mostly women and boys—to enter the paid labor force. Economically Active Population In Ecuador, women’s participation in the labor force remains lower than that of men, even though female participation has increased over the decades. From 1970 to 1990, the female proportion of the economically active population (EAP) increased from 14 to 19 percent, whereas the male proportion decreased from 74 percent to 69 percent. Women’s labor-force participation is greater in urban areas.

Of all children age 12 to 14 years in the bottom quintile, 34 percent work and attend CRISIS AND DOLLARIZATION IN ECUADOR 144 Figure 4.7 Ecuador: Gender Gap in Education Years of school attainment 14 12 10 8 6 4 2 0 Q1 Q2 Q3 Q4 Per-capita expenditure quintiles Female Q5 Male Note: Refers to years of school attainment of population 24 years and older. Source: ECV 1999. school, and another 26 percent only work, resulting in an overall labor force participation rate of 60 percent (as shown in figure 4.9), up from 54 percent in 1998. Child labor undoubtedly contributes to the high rate of school absenteeism for children in the bottom quintile. Even before the most recent crisis, children age 12 to 14 years reported missing classes more than half the time, and even children age 6 to 11 years reported missing classes about one-third of the time.

According to Cunningham’s analysis of the Mexican labor force, single mothers begin to work in response to realized negative shocks to income, but their entry is less elastic than that of wives. On the other hand, similar to husbands, single women’s labor-force entry is not subject to economic fluctuations. In the case of Argentina, Gill and Pessino (1998) used aggregate data to show that labor-force participation rates of Argentine women, especially young women, are counter-cyclical, that is, women are more likely to be in the labor market when male unemployment rates are higher (cited in World Bank 2000c).27 Ecuadoran households unable to mobilize wives’ labor tend to be poorer (World Bank 1996).

pages: 236 words: 77,546

The Cult of Smart: How Our Broken Education System Perpetuates Social Injustice
by Fredrik Deboer
Published 3 Aug 2020

A college-educated worker could expect to make $1.2 million, half again what their high school–educated peer would make.21 Another way to measure the declining fortunes of those without a college education lies in the labor force participation rate. The traditional unemployment rate only measures those who have jobs and those who are actively looking for them. Those who have stopped looking, for whatever reason, are excluded from the figure. This can potentially lead us to underestimate the negative conditions of those without jobs, as those who are no longer pursuing work are often among the most desperate. (There are now several complementary statistics used to represent unemployment, and the more comprehensive ones are slowly replacing the traditional rate.) The labor force participation rate excludes those who are neither in jobs nor actively pursuing them.

In 1964, about 97 percent of those without a college degree were participating in the labor force; by 2015, that number had fallen to 83 percent, a decline of 14 percent.22 In contrast, a little more than 97 percent of those with college degrees were participating in the labor force in 1964, with the number falling only to 94 percent in 2015. In other words, 55 years ago those who had college degrees and those with no college were essentially at parity in labor force participation, but now the college educated have opened up an 11 percent gap, even years into the recovery from the Great Recession. And since a clear majority of Americans still do not have a college degree, this represents millions more people who are not working and not looking for work. The most likely culprit for these declines lies in a sea change in which skills and abilities are valued in our economy.

“The Education Wage Premium Contributes to Wage Inequality,” Hamilton Project, September 26, 2017, http://www.hamiltonproject.org/charts/the_education_wage_premium_contributes_to_wage_inequality, accessed January 31, 2019. 21. Jennifer Ma, Matea Pender, and Meredith Welch, “Education Pays 2016: The Benefits of Higher Education for Individuals and Society. Trends in Higher Education Series,” College Board, 2016, 18. 22. White House Council of Economic Advisors, “The Long-Term Decline in Prime-Age Male Labor Force Participation,” June 2016, https://obamawhitehouse.archives.gov/sites/default/files/page/files/20160620_cea_primeage_male_lfp.pdf, accessed January 30, 2019. NINE: A WORLD TO WIN 1. James J. Lee, Robbee Wedow, Aysu Okbay, Edward Kong, Omeed Maghzian, Meghan Zacher, Tuan Anh Nguyen-Viet et al., “Gene Discovery and Polygenic Prediction from a Genome-Wide Association Study of Educational Attainment in 1.1 Million Individuals,” Nature Genetics 50, no. 8 (2018): 1112. 2.

pages: 295 words: 90,821

Fully Grown: Why a Stagnant Economy Is a Sign of Success
by Dietrich Vollrath
Published 6 Jan 2020

By the 1990s, there was basically zero growth in the ratio of workers to population, and then in the twenty-first century this turned negative, to −0.35%. That twenty-first-century effect is not just a remnant of the financial crisis. Harris Eppsteiner, Jason Furman, and Wilson Powell calculated that population aging alone accounts for four-fifths of the decline in the labor force participation rate from 2007 to 2017, just since the crisis. A different study by Nicole Maestas, Kathleen Mullen, and David Powell identified the effect of population aging by comparing US states with relatively old populations to those with relatively young populations. Their results imply an effect of aging on growth of about 1 percentage point, in line with my numbers here.

Over either period, trade with China had a significant effect on manufacturing employment. In addition, these direct losses also led to indirect losses of employment in these commuting zones. Across the United States, increased trade from 1990 to 2007 lowered the percentage of people in the labor force, regardless of industry, by about 1 percentage point. The labor force participation rate was about 66% in 2007, so it would have been 67% without trade. Rather than 153 million workers in the labor force in 2007, there would have been 155 million. Trade with China also raised the unemployment rate by about 0.37 percentage points. In 2007, the unemployment rate was 5.0%, so it would have been 4.63% without that trade.

In general, lower fertility rates are associated with higher living standards. Would you sacrifice the level of living standards and go back to the real GDP per capita of 1930 or 1920 to generate more rapid population growth? Remember, associated with the drop in family size was an increase in the age of marriage, higher female labor force participation, higher education levels, better household technologies, and improved reproductive rights for women. Which of those would you be willing to sacrifice to jump-start growth? Would you restrict the ability of women to work or roll back access to contraception? Would you accept thousands of unplanned births every year to add a few tenths of a percentage point to the growth rate of real GDP per capita?

pages: 460 words: 107,454

Stakeholder Capitalism: A Global Economy That Works for Progress, People and Planet
by Klaus Schwab
Published 7 Jan 2021

Klein, Financial Times, December 2016, https://ftalphaville.ft.com/2016/12/06/2180771/how-many-us-manufacturing-jobs-were-lost-to-globalisation/. 15 Trading Economics, United States Labor Force Participation Rate, with numbers supplied by the US Bureau of Labor Statistics, https://tradingeconomics.com/united-states/labor-force-participation-rate. 16 Trading Economics, Denmark Labor Force Participation Rate, https://tradingeconomics.com/denmark/labor-force-participation-rate. 17 Interview with Thomas Søby by Peter Vanham, Copenhagen, November 2019. 18 OECD, Directorate for Employment, Labour and Social Affairs, Employment Policies and Data, Skills and Work dashboard, http://www.oecd.org/els/emp/skills-and-work/xkljljosedifjsldfk.htm. 19 Interview with Heather Long by Peter Vanham, Washington, DC, April 2019. 20 Ibidem. 21 Interview with Thomas Søby by Peter Vanham, Copenhagen, November 2019. 22 “How Today's Union Help Working People: Giving Workers the Power to Improve Their Jobs and Unrig the Economy,” Josh Bivens et al., Economic Policy Institute, August 2017, https://www.epi.org/publication/how-todays-unions-help-working-people-giving-workers-the-power-to-improve-their-jobs-and-unrig-the-economy/. 23 “Singapore Society Still Largely Conservative but Becoming More Liberal on Gay Rights: IPS Survey,” The Straits Times, May 2019, https://www.straitstimes.com/politics/singapore-society-still-largely-conservative-but-becoming-more-liberal-on-gay-rights-ips. 24 “Singapore: Crazy Rich but Still Behind on Gay Rights,” The Diplomat, October 2018, https://thediplomat.com/2018/10/singapore-crazy-rich-but-still-behind-on-gay-rights/. 25 Interview with Senior Minister Tharman Shanmugaratnam by Peter Vanham, Singapore, July 2019. 26 “Singapore's Economic Transformation,” Gundy Cahyadi, Barbara Kursten, Dr.

At worst, no new jobs became available at all, at least not for workers without a college degree. Inflation-adjusted wages since 1980 have barely risen in certain sectors. And, despite having very low official unemployment numbers until the pandemic hit, the US labor force participation dropped from an all-time high of over 67 percent in 2000, to around 62 percent in 2020,15 meaning many people stopped looking for work altogether. In Denmark, by contrast, the labor force participation continued to hover around 70 percent even after the pandemic hit in early 2020.16 Why did this happen? “One of the major problems in the American economy,” Søby said, “is a lack of education of the workforce.”17 Unlike in Denmark, there is no widespread system for upskilling workers.

More women went to college, entered and stayed in the workforce, and made more conscious decisions about their work-life balance. The booming economy had plenty of room for them, but they were also supported by advancements in medical contraception, the increased accessibility of household appliances, and, of course, the emancipation movement. In the United States, for example, female labor-force participation jumped by 15 percent between 1950 and 1970, from about 28 to 43 percent.11 In Germany, the percent of female students at university rose from 12 percent in 1948 to 32 percent in 1972.12 At the Ravensburger company, women came to the forefront, too. Starting in 1952, Dorothee Hess-Maier, a granddaughter of the company's founder, became the first woman at the helm of the company, alongside her cousin Otto Julius.

pages: 460 words: 107,454

Stakeholder Capitalism: A Global Economy That Works for Progress, People and Planet
by Klaus Schwab and Peter Vanham
Published 27 Jan 2021

Klein, Financial Times, December 2016, https://ftalphaville.ft.com/2016/12/06/2180771/how-many-us-manufacturing-jobs-were-lost-to-globalisation/. 15 Trading Economics, United States Labor Force Participation Rate, with numbers supplied by the US Bureau of Labor Statistics, https://tradingeconomics.com/united-states/labor-force-participation-rate. 16 Trading Economics, Denmark Labor Force Participation Rate, https://tradingeconomics.com/denmark/labor-force-participation-rate. 17 Interview with Thomas Søby by Peter Vanham, Copenhagen, November 2019. 18 OECD, Directorate for Employment, Labour and Social Affairs, Employment Policies and Data, Skills and Work dashboard, http://www.oecd.org/els/emp/skills-and-work/xkljljosedifjsldfk.htm. 19 Interview with Heather Long by Peter Vanham, Washington, DC, April 2019. 20 Ibidem. 21 Interview with Thomas Søby by Peter Vanham, Copenhagen, November 2019. 22 “How Today's Union Help Working People: Giving Workers the Power to Improve Their Jobs and Unrig the Economy,” Josh Bivens et al., Economic Policy Institute, August 2017, https://www.epi.org/publication/how-todays-unions-help-working-people-giving-workers-the-power-to-improve-their-jobs-and-unrig-the-economy/. 23 “Singapore Society Still Largely Conservative but Becoming More Liberal on Gay Rights: IPS Survey,” The Straits Times, May 2019, https://www.straitstimes.com/politics/singapore-society-still-largely-conservative-but-becoming-more-liberal-on-gay-rights-ips. 24 “Singapore: Crazy Rich but Still Behind on Gay Rights,” The Diplomat, October 2018, https://thediplomat.com/2018/10/singapore-crazy-rich-but-still-behind-on-gay-rights/. 25 Interview with Senior Minister Tharman Shanmugaratnam by Peter Vanham, Singapore, July 2019. 26 “Singapore's Economic Transformation,” Gundy Cahyadi, Barbara Kursten, Dr.

At worst, no new jobs became available at all, at least not for workers without a college degree. Inflation-adjusted wages since 1980 have barely risen in certain sectors. And, despite having very low official unemployment numbers until the pandemic hit, the US labor force participation dropped from an all-time high of over 67 percent in 2000, to around 62 percent in 2020,15 meaning many people stopped looking for work altogether. In Denmark, by contrast, the labor force participation continued to hover around 70 percent even after the pandemic hit in early 2020.16 Why did this happen? “One of the major problems in the American economy,” Søby said, “is a lack of education of the workforce.”17 Unlike in Denmark, there is no widespread system for upskilling workers.

More women went to college, entered and stayed in the workforce, and made more conscious decisions about their work-life balance. The booming economy had plenty of room for them, but they were also supported by advancements in medical contraception, the increased accessibility of household appliances, and, of course, the emancipation movement. In the United States, for example, female labor-force participation jumped by 15 percent between 1950 and 1970, from about 28 to 43 percent.11 In Germany, the percent of female students at university rose from 12 percent in 1948 to 32 percent in 1972.12 At the Ravensburger company, women came to the forefront, too. Starting in 1952, Dorothee Hess-Maier, a granddaughter of the company's founder, became the first woman at the helm of the company, alongside her cousin Otto Julius.

pages: 336 words: 95,773

The Theft of a Decade: How the Baby Boomers Stole the Millennials' Economic Future
by Joseph C. Sternberg
Published 13 May 2019

And yet this rosy picture is only half of the story. For too many Millennials, the wide array of job opportunities that exists in theory is just that, a theory. The Bureau of Labor Statistics again offers some insight into what’s going on, by looking at two key indicators: the unemployment rate and the labor-force participation rate. The unemployment rate shows the percentage of people who want to find a job but can’t, and throughout the post-2008 decade the unemployment rate for young workers has been higher than for the population as a whole. In October 2009, when the overall unemployment rate reached its Great Recession peak of 10 percent, the unemployment rate for people ages twenty-five to thirty-four (born 1975–1984, so the youngest Gen Xers and oldest Millennials) was 10.6 percent, and the unemployment rate for the bulk of Millennials then in the workforce (ages twenty to twenty-four, with birth years from 1985 to 1989) was 15.8 percent.

Only in mid-2018, a decade after the Great Recession, did the unemployment rate for those ages twenty-five to thirty-four approach parity with the unemployment rate for the overall labor force. And that unemployment situation is actually worse than it looks, because fewer young adults are trying their luck with job hunting at all. The other key piece of data is the labor-force participation rate: the percentage of people of a given age who either are working or have made some effort to find work in the recent past, excluding those who are in school (or prison). The long-term trend since the mid-1980s has been a decline in labor participation for people ages twenty to twenty-four as college attendance has become more common, and an increase in the labor participation rate for people ages twenty-five to fifty-four as economic growth recovered from its 1970s malaise and more women entered the workforce.

At most supermarkets I’ve ever shopped in, in the United States or in Britain, the lines for registers staffed by human cashiers are generally as long as the lines for self-checkout machines. Clearly a nontrivial number of consumers are still prepared to sacrifice some time in exchange for interacting with a live person. § Focusing on men makes it easier to compare changes over time since their labor-force participation has been higher over the twentieth and twenty-first centuries, whereas women’s labor participation only started to increase significantly in the last quarter of the twentieth century. ¶ The researchers found that the median age of workers at the very smallest companies, with one to nineteen employees, was forty-two years, a fact they attributed to the higher likelihood that this group of companies would include sole proprietorships established by older entrepreneurs.

pages: 257 words: 64,285

The End of Traffic and the Future of Transport: Second Edition
by David Levinson and Kevin Krizek
Published 17 Aug 2015

Many employees have dropped out of the labor market as their skills have been devalued by the economy; older workers are choosing, or having imposed on them, early retirement, while younger workers are deferring entry into the workforce, choosing to accumulate more education. The rise in female labor force participation from the 1930s through the 1990s has also run its course; labor force participation is roughly equal by gender.56 The percentage of women in the workforce has plateaued since the turn of the century. The percentage of men has dropped.57 There is no indicator suggesting that this is likely to reverse significantly, and certainly not pass the previous peak.

But there are a number of important trends and developments relevant for understanding the changes in participation of different subgroups of the population: • Increased participation by older Americans, which may be attributable to an increase in skills among this population and also to changes in Social Security retirement benefits; • Reduced participation by younger Americans as they stay in school longer; • Continuation of an at least 65-year long trend of declining male labor force participation, which is especially stark for young minority men; and • Tapering of the long-term trend of increasing female labor force participation, which dates back to before World War II." http://www.whitehouse.gov/sites/default/files/docs/cea_2015_erp.pdf 55 Figure 3.2 Source; US Department of Labor - Bureau of Labor Statistics (2015) Labor Force Statistics from the Current Population Survey http://data.bls.gov/timeseries/LNS11300000. 56 Women and the US workforce, see: US Department of Labor - Women's Bureau (n.d.)

Even when multiple years of data are available, such models are typically only estimated on the most recent survey, rather than on trends or changes. The underlying behavior is not permitted to change, only what it responds to. Yet we now have evidence that some underlying preferences do change over time. It is not simply a matter of getting the demographics or incomes correct. For instance from the 1960s to the 1990s female labor force participation increased. Thus the number of work trips and non-work trips (substituting out-of-home for in-home production) both increased in that period. But that increase has played itself out. Thus the increases it was associated with have peaked. This reflected changing preferences. While hindsight is 20/20, we don't know if underlying preferences can be modeled accurately prospectively (we are doubtful), but we do know failure to account for them will lead to model inaccuracies.

pages: 196 words: 53,627

Let Them In: The Case for Open Borders
by Jason L. Riley
Published 14 May 2008

“To what extent did the influx of immigrants entering Southern California in the 1970s reduce the jobs available to nonimmigrant workers?” wrote Thomas Muller, the study’s author. “The answer for the 1970s is little if at all,” he concluded. “Despite mass immigration to Southern California, unemployment rates rose less rapidly than in the remainder of the nation.” Muller also found that labor-force participation rates among natives seemed to be unaffected, and “the participation rate for both blacks and whites was higher in Southern California [where the bulk of immigrants settled] than elsewhere in the state and the nation.” In 1994 economist Richard Vedder of Ohio University, working with Lowell Gallaway and Stephen Moore, conducted a historical analysis of immigration’s impact on the entire U.S. labor force.

Even so, it would be foolhardy to argue that 60 percent of Americans are fiscally expendable and that the United States would be better off without them because they don’t “pay their way.” Such reductionism ignores the propensity of foreign workers to save and start new businesses at higher rates than natives, which contributes to the economic welfare of the nation. Low-skill immigrants also have a higher labor-force participation rate than natives and a lower rate of unemployment. Lower-income workers, whether foreign-born or American, enable large sectors of the economy—farming, construction, manufacturing, health care—to function and grow. And in the process they create job opportunities for the rest of us. SNOUTS AT THE TROUGH?

After all, says Jacoby, “if you’re going to be unemployed, it’s much better to be unemployed at home than in the United States. It’s usually warmer at home and less expensive to live, and you are likely to be surrounded by a network of supportive family and friends.” Jacoby is spot-on, according to the economic data used to gauge an immigrant’s intentions. The labor force participation rate, which measures the percent of the working-age population that is employed or seeking employment, is the strongest indication that immigrants come here to work and not to idle. Among foreign nationals generally, labor participation rates are higher than that of natives (69 percent versus 66 percent in 2006) and jobless rates are lower (4.0 percent versus 4.7 percent in 2006).

Investment: A History
by Norton Reamer and Jesse Downing
Published 19 Feb 2016

Perhaps it is that urban labor caused more distinct physical strain than that faced in agriculture, or perhaps it is a greater breadth of opportunities available to an older individual in urban environments. Whatever the reason, it is true that the labor force participation rates for those on farms were higher than for those not on farms. As the number of individuals involved in the agricultural sector declined over this period, there was a resultant aggregate level increase in retirement. Estimating the degree to which declines in the agricultural sector were responsible essentially involves comparing the actual aggregate labor force participation rate to the theoretical value if the proportions of men in agriculture and nonagriculture had not changed from 1880 to 1940.

This, too, is a worthwhile trend to study, as it is the length of retirement that determines what one needs to have saved. What has driven the elongation of retirement? Is it a drop in labor force participation rate at ever-earlier ages, or is it the decreases in mortality? To begin to answer this question, there are two noteworthy points to consider: average total life expectancy for those who had reached twenty years of age grew from less than sixty-two years in 1900 to more than seventy-three years in 1990. Over this same interval, there was a drastic drop in the labor force participation rate of older Americans, from 65 percent to just 15 percent of men over the age of sixtyfive by 1993.

The seeds were sown in large part by a series of changes, both economic and demographic. There is no clear consensus on precisely what drove the large increases in retirement rates observed from 1880 to 1940, though a variety of explanations have been offered. What is known is that the rate of retirement increased quite materially over this time period. In 1880, the labor force participation rate for males between sixty and seventy-nine years of age was 86.7 percent, and by 1940 this declined to 59.4 percent.11 We offer two possible explanations for this important shift. One trend that is partly responsible is the decline in the agricultural sector over this period. The argument in support of the importance of this explanation is that retirement is, on average, more of an urban industrial phenomenon than a rural farming phenomenon.

pages: 90 words: 27,452

No More Work: Why Full Employment Is a Bad Idea
by James Livingston
Published 15 Feb 2016

Once upon a time, in the nineteenth century, economic growth was driven by net additions to the capital stock and to the labor force. In other words, growth was built on more machines—“physical plant and equipment,” they call it—and more workers operating those machines. In the parlance of economists, net private investment rose, capital stock per worker increased, and both employment and labor force participation rates did, too. Much of that investment took the material form of labor-saving machinery—plant and equipment that displaced workers—but somebody had to build the machinery, so overall demand for labor kept rising. Since 1919, growth has worked differently. Thereafter, net private investment declined, and employment in goods production did, too, but growth didn’t stop, not even in the 1930s.

In the New Jersey Experiment, for example, the husbands cut their work week by slightly less than an hour (and the proportional reductions were the same for Gary, Seattle, and Denver). The wives cut five hours off their work week, but they spent that “free” time with their many children—the average family size in the New Jersey study was 5.8—particularly, it seems, to help them with homework after school. The women reduced their labor force participation rates as nominal family income rose, in other words, choosing more time over more income, in an exact inversion of what has happened in the workplace since the 1980s. When given a choice, the working mothers leaned in to spend time with their children, probably because their husbands weren’t going to pitch in with household chores anyway.

If our labor time has become worthless—it can’t be “monetized,” in the parlance of our time—then how do we explain or justify working for a living? VI Hanna Rosin has recently predicted the “end of men” as a result of the Great Recession. The phrase is playful hyperbole, of course, but the empirical groundwork of her argument is the significant decline of labor-force participation by men since 2008. What happens when men become useless because they don’t work? Are women taking over the world because jobs of the traditional, masculine kind—you know, in factories, in manufacturing—are disappearing? Does the world turn upside down when the absence of work makes men superfluous?

Forward: Notes on the Future of Our Democracy
by Andrew Yang
Published 15 Nov 2021

Amazon famously paid zero Jesse Pound, “These 91 Companies Paid No Federal Taxes in 2018,” CNBC, Dec. 16, 2019. a policy that’s currently “VAT,” International Monetary Fund, accessed March 1, 2021, www.imf.org/​external/​np/​fad/​tpaf/​pages/​vat.htm. During the pandemic, unemployment “Civilian Labor Force Participation Rate,” U.S. Bureau of Labor Statistics, accessed March 1, 2021, www.bls.gov/​charts/​employment-situation/​civilian-labor-force-participation-rate.htm. Our infrastructure is crumbling Norma Jean Mattei, “2017 Infrastructure Report Card: A Comprehensive Assessment of America’s Infrastructure,” American Society of Civil Engineers, 2017. We can expand broadband access John Busby and Julia Tanberk, “FCC Reports Broadband Unavailable to 21.3 Million Americans, BroadbandNow Study Indicates 42 Million Do Not Have Access,” BroadbandNow, Feb. 3, 2020.

If we install a value-added tax, we will close all of the tank-sized loopholes that our biggest companies run through and generate trillions in new revenue from the organizations that are benefiting most from new technologies. WE’RE SHORT MILLIONS OF JOBS, BUT NOT SHORT OF WORK During the pandemic, unemployment spiked, but our labor force participation rate remained at historically low levels. We simply have too many people out of work, which is ridiculous considering all of the important work we have to do. Our infrastructure is crumbling. We received a D-plus from the American Society of Civil Engineers, with $4.6 trillion of work needed to be done by 2025 in order to get it up to an acceptable B.

Outside the economic costs of having such outdated infrastructure, everyone knows that fixing something once it breaks is significantly more expensive than maintaining it. We’re well past the point where we can actually save money by investing and building. Infrastructure projects have the opportunity to solve so many of our problems at once. A massive jobs program to rebuild our country would increase labor force participation and get people back to work. We can use this opportunity to improve our environmental sustainability, which would set us up for the future while also alleviating the health impact of pollution. We can expand broadband access and affordability to more Americans, a necessity for functioning in modern life that is currently inaccessible to eighteen million Americans and unaffordable for another twenty-four million.

pages: 409 words: 125,611

The Great Divide: Unequal Societies and What We Can Do About Them
by Joseph E. Stiglitz
Published 15 Mar 2015

Though the structural policies have not been fully fleshed out, they are likely to include measures aimed at increasing labor-force participation, especially among women, and hopefully by facilitating employment for the large number of healthy elderly. Some have suggested encouraging immigration as well. These are areas in which the United States has done well in the past, and are crucial for Japan to address, for the sake of both growth and inequality. Though Japan has long prioritized equal access to education for women—with a result that Japanese girls score higher in science than boys, and are not as far behind boys in math as American girls are—it still has a relatively low labor-force participation rate for women (49 percent, according to the World Bank, compared with 58 percent for the United States).

And if we had better public transportation systems that made it easier and more affordable for working-class people to commute to where jobs are available, then a higher percentage of our population would be working and paying taxes. If, like the Scandinavian countries, we provided better child care and had more active labor market policies that assisted workers in moving from one job to another, we would have a higher labor-force participation rate—and the enhanced growth would yield more tax revenues. It pays to invest in people. This brings me to the final point: we could impose a fair tax system, raising more revenue, improving equity, and boosting economic growth while reducing distortions in our economy and our society. (That was the central finding of my 2014 Roosevelt Institute white paper, “Reforming Taxation to Promote Growth and Equity.”)

—where the typical family has seen its income stagnate for a quarter-century, even as the rich get richer. Independence may have its costs, although these have yet to be demonstrated convincingly, but it will also have its benefits. Scotland can make investments in tidal energy, or in its young people; it can strive to increase female labor-force participation and provide for early-years education—both essential for creating a fairer society. It can make these investments, knowing that the country will recapture more of the benefits from them through taxation. Under current arrangements, while Scotland bears the cost of these social investments, the extra tax revenue resulting from the additional growth from these investments will go overwhelming south of the border.

pages: 306 words: 78,893

After the New Economy: The Binge . . . And the Hangover That Won't Go Away
by Doug Henwood
Published 9 May 2005

Of course, it's not just individual workers who are putting in longer hours; an ever-larger share of the adult population has entered the paid workforce—mainly women, who aren't getting much relief in their household labors to compensate for their increased presence in factories and offices. labor force participation rates, 1890 1 007or 0% 1 907o 857o 1890 1910 1930 1950 1970 1990 r men, 1955-2003 707o«— >■ 1955 1965 1975 1985 1995 1955 1965 1975 1985 1995 The labor force participation rate is the share of the population either at work or actively looking for work—the sum of the employed and officially unemployed. Dots and broken lines in the first chart signify that the readings were only taken at long intervals and that pre-1950 readings are not strictly comparable to post-1 950.

See GDP Grubman,Jack, 197-198 happiness, 168 Hardt, Michael, 180-186 Harris, Jerry, 175—176 Hayek, Friedrich, 174 hedonic pricing, 44 Henderson, David, 179 Hilferding, Rudolf, 181 HITEK2, 52-54 household structures and poverty, 112 household vs. family, 237 Huws, Ursula, 28 idealab, 201 imperialism Lenin on, 181 privatized, 169 import-substitution industrialization, 170, 220 income household, median, 87-88 and productivity, 45, 56 income distribution discrimination and, 94-101 educational attainment and, 99—100 global, 127-133 health consequences, 81—82 historical perspective, 82-90 long view, 82—84 recent view, 84—90 increasing returns to skill, 86—87 international comparisons, 133—141 in New Economy hotbeds, 103 productivity and, 46 race and, 90-91, 93,98-99 race and sex together, 93—94 sex and, 91-93,95-97 voting and, 81 see also poverty income mobility, 80,114-118 international comparisons of, 136-138 inequality globahzation and, 152—155 increase in, ubiquity of, 116—117 as poUtical issue, 79-81 265 see also income distribution; wealth distribution inflation, 42 pobticaJ analysis, 204—206 initial pubUc offerings (IPOs), 187-188 fees, 201 innovation, 17 historical perspective, 54—55 intangibles, 204 accounting for, 17—22,232 intellectual property, 229, 231 interest, source of, 203 International Fonim on Globalization, 160-162 Internet bubble, natural history, 188-189 and New Economy, 24—26 public subsidy, 6 IQ, corporate America's, 21-22 irrational exuberance, 7 Jameson, Fredric, 27-28 Jencks, Christopher, 75 Jensen, Michael, 203 Jessop, Bob, 147 jobs of the future, 71—74 job skills, 73-77 Jorgenson, Dale, 51, 57 Kahn, Lawrence, 97 Kaldor paradox, 158 Kalecki, Michal, 206 KeUy Kevin, 24, 79 Kemp, Jack, 230 Kennedy Ted, 208 Kennickell, Arthur, 119 Kenworthy, Lane, 135—136 Keynes, John Maynard, 148-149,188,219 Klein, Naomi, 18 Knight, Phil, 159 Korten, David, 162-169,173 Kovel,Joel, 174 Krueger,Anne O., 149 Kuznets, Simon, 83 labor class war, 208-209,227 fear among workers, 206-207, 215—216 inputs, 45, 57 quality, 58 war on, 208-209 labor force participation rate, 40 Labor Notes, 25 Lawrence, Robert Z., 145 Lay, Kenneth, 33 Lenin, V. I., 181 Lev, Baruch, 17-22,232 leveraged buyouts, 214 Hberal welfare states, 139-143 Uteracy, 165 localist critiques of globahzation, 159—165 Lovink, Geert, 38 low-wage work, international comparisons, 137-138 Lucas, Adrian, 38 Luxembourg Income Study, 133 Mahathir, 170 Malthusianism, 161,166 management by stress, 25 Mander, Jerry, 162 market democracy, 22 Martin, William McChesney, 7 Mason, Patrick, 99 Mayer, Susan, 75 McKinsey Global Institute, 64-68 McNeU,John, 100,110 Means, Gardiner, 212 means-testing, politics of, 141—142 measurement issues, 42-45, 58—60 Meeker, Mary, 199-200 Mexico Index default, 1982,209 external finance and 1994 crisis, 222 Milanovic, Branko, 128,130-132 Milken, Michael, 199 Milliken, Roger, 170 mobility.

See income Wal-Mart, 64-67 war and income distribution, 83 and mflation, 205 wealth distribution, 118-127 forfee5 400,119-121 historical perspective, 121 race and, 125—126 residence and, 122 staying power of savings and, 124-125 stock options and, 126-127 weighdessness, 27—28 Enron and, 33—34 vs. need for infrastructure, 16-17, 30-31 Welch, Finis, 80 welfare states economic growth and, 135—136 and poverty, 138 typology, 139-143 White, Harry Dexter, 219 Whitman, Meg, 199 wholesale trade, 64—66 widgets, 42 Wildlands Project, 161 Williams, Raymond, 164-165 Wired, failed IPO, 188 women labor force participation, 40 lesser quaHty of, 58 work, end of, 68-71 workers. See labor workload international comparisons, 40—41 productivity, 39-41 work hours, 67 WorldCom, 197 Worldwatch Institute, 166 World Economic Forum, 6,175—178 World Social Forum, 185 World Trade Orgamzation, 32,160,170 WorldWarII,205 Wriston, Walter, 22 X4HTK2, 53-54 Young & Rubicam, 18 J^i ^0 LONr^pp .^ '. i.iinued from front flap) After the New Economy offers an accessible and entertaining account of the less-than-lustrous reality beneath the gloss of the 1990s boom, stripping bare the extravagant pretension of unrestrained entrepreneurial hubris and revealing how it contributed to the making of a new anti-capitalist global movement.

pages: 183 words: 17,571

Broken Markets: A User's Guide to the Post-Finance Economy
by Kevin Mellyn
Published 18 Jun 2012

However, that was against the background of an economic boom driven by the financial economy, a “dot-com” bubble in new technologies, and pro-market reforms of the 1980s. Record labor-force participation during the dot-com boom made the so-called “welfare to work” requirements embedded in the reforms aimed at limiting the time people could receive benefits without seeking work or training appear feasible and in the best interest of people mired in poverty. Indeed, welfare rolls fell sharply in the boom economy of the 1990s. The picture today could scarcely be more different. Labor-force participation rates have fallen to levels not seen in over three decades—down to 64 percent from 67.4 percent—with perhaps one potential worker in five unemployed or underemployed.

Below the outsiders, large swaths of the working-age Broken Markets population live on government assistance programs, partially because benefits are generous enough to make such a life about as comfortable as the employed life of the outsiders with far less effort. A statistic called the labor force participation rate is telling. In the United States before 2008, this often ran as high as 68 percent, meaning that the nearly seven out of ten adults below retirement age were in the labor market. By contrast, many European countries had only between five and six out of ten adults working. The rest lived off the state or in the shadows.

w 163 I Index A C Anglo-Saxon capitalism, 84 Card Act, 68, 70 Anglo-Saxon-type banking systems, 156 CHIPS.See Clearing House Interbank Payment System Asset securitization, 66 Association of Community Organizers for Reform Now (ACORN), 65 Austerity definition, 98 Euro, real unification, 99 Germany, 99–101 B BankAmericard, 29 Bankcard association/card scheme, 29 Bank-centric system, 110 Bank for International Settlements (BIS), 108 Basel III process, 50–51 Basel process, 27–28 Basel standards, 61 Bipartisan government policy, 72 Boom optimistic entrepreneurs, 77 Bretton Woods system, 26, 111 Bureaucracies, 21 Civilization, 64 Clearing House Interbank Payment System (CHIPS), 106, 107 Committee of Payment and Settlement Systems (CPSS), 108 Community Reinvestment Act (CRA), 65–66 Consumer banking BankAmericard, 29 bankcard association/card scheme, 29 branch-based customer relationship, 29 credit card industry, 30 Depression-era Glass-Steagall Act, 33 “diseconomies of scale”, 35 FDIC, 34 four-party model, 29 institutional investors, 34 “market-centric” financial system, 33 merchant/customer relationship, 29 Pac-Man banking, 34 risky business, 31–33 RTC, 31 SEC, 33 S&L industry, 28, 30 1 166 Index Consumer banking (continued) statistical analysis, 30 US “flow-of-funds” data, 28 usury laws, 30 Consumer Finance Protection Bureau (CFPB), 68 Continuous Linked Settlement (CLS), 108 Creative destruction, 85 Credit-driven economy, 76–77 Crony capitalism, 85 Cross-Pacific economy, 97 D Debtor Nation, 64 Dirigisme, 83 Dollar-centric financial system, 112 Durbin Amendment, 70 E ECB.See European Central Bank Economic consequences, financial regulation, 55 bank P & Ls and balance sheets bureaucratic regulation, 59 capital allocation, 57 capitalism, 57 clearinghouse/transaction switch, 58 contradictory rules, 59 creative destruction, 63 free-market capitalism, 57 full-blown panic leading, 57 lender-of-last-resort function, 58 payments system, 58–59 private-sector banks, 58 consumer protection vs. access, 67–68 financial access restriction brick-and-mortar branches, 66 civilization, 64 clearinghouse, 63 CRA, 65–66 credit judgments, 65 economic enfranchisement, 64 government paternalism, 65 joint-stock banks, 63 loan securitization, 66 mass-market retail banking, 66 national and multilateral development agencies, 65 non-credit worthy segments, 66 ownership society, 66 paychecks, 64 premium/reward cards, 66 individual banker accountability, 55 interest reduction, 56 predatory lending, 56 product differentiation, 68–69 public utility, 55, 56 regulatory, capital, and litigation costs, 56 regulatory compliance and fraud losses, 56 savers and investors, 71–73 shell game asset-securitization process, 61 commercial and industrial loans, 62 credible assessment, 62 Dodd-Frank Act, 63 Federal Reserve Bank, 63 free-market creative destruction, 63 globalization, 62–63 Great Depression, 61 Great Moderation, 61 least-regulated jurisdictions, 61 regulatory arbitrage, 61 relationship banking, 62 retail banking revolution, 63 return-on-equity business, 62 rules-based regulation, 61 securitization and market-based funding, 63 supervision vs. rule making, 59–60 unbanking, 70–71 utility-style banking, 56 European Central Bank (ECB), 6, 99, 102–103 F Federal Deposit Insurance Corporation (FDIC), 34 Index Federal Reserve, 101 Finance consumers, 117 American Revolutionary War song, 118 bondholders and money market funds, 138 Bureau of Labor Statistics, 126 business-to-business commerce, 119 consumerism, 118 credit score, 120–121 debt free, 138–139 “dot-com” bubble, 1264 employment and consumer credit, 121–122 Gallup polling organization, 127 Great Society, 126 house prices, 133 “infrastructure”, 119 innovation and education, America advantage, 129 American living standards, 129 global success, 128 high-stakes examinations, 130 industrial policy, 128 student loans, 131 mass-market pottery, 119 money saving, 136–137 New Class, new elite educated caste, 132–133 non-tradable private sector, 127 one’s station in life, 118 overseas trade, 119 pent-up demand, 119 private-sector employment, 125 property taxes, 127 “self-liquidating”, definition, 119 shelter asset bubbles and distorts markets, 133 electoral process, 134 Japanese economy, 135–136 retirement plans and financial advisors, 134 Travellers Club, 133 wealth effect, 133 short-term insurance scheme, unemployment assistance, 127 stock market, 137–138 structural unemployment American economy, 123–125 labor force participation rate, 123 labor markets, Europe, 122 solidarity, 123 three-tiered system, 122 subsidy-based industries, 125 super-safe government debt, 125 technological creativity and economic progress, 117 unionized public-service employees, 125 US job growth, 126 “welfare to work” requirements, 126 You, Inc., 139 Finance-driven economy, 1, 72 anti-capitalism, 2 capitalism, 1 chronic debt crisis, 22 corporate America, 20 current movie artificial bank earnings, 7 asset prices, 6 banking implosions, 6 borrowers and investors connection, 10 borrowing demand, 7 catastrophic financial bubble, 10 civilization, 10 corporatism, 9 democratic crony capitalism, 9 Dodd-Frank act, 8 economic growth and social stability, 10 financial repression, 9 Glass-Steagall Act, 8 human ingenuity, 10 interbank funding markets, 6 low interest rates and easy money, 6 market collapse, 10 money market, 6 overexuberence, 6 overinvestment and speculation, 6 pre-crisis conditions, 8 printing money, 7 private capital, 7 167 168 Index Finance-driven economy (continued) profitability, 7 quantitative easing, 8 recovery, 8 regulation, 8 regulatory capital rules, 8 resources and tools, 9 shell-shocked enterprises and households, 8 end of employment, 21–22 financial leverage magic and poison CEO class, 14–15 consumer debt, 15–16 disconnection problem, 11–12 market bargain, 10 real economy, 10 wealth financialization, 13–14 working capital, 11 global financial crisis, 2 Great Moderation, 16–18 Great Panic, 18–19 household sector agony, 19–20 investor class, 22 Marx, Karl asset bubble, 5 cash nexus, 4 dot-com bubble, 5 economic revolution, 3 First World War, 4 free markets, 3 French Revolution, 3 globalization, 3 Great Depression, 5 liberalism, 3 normalcy, 4 overproduction and speculation, 3 Wall Street, 4, 5 revolutionary socialism, 2 sovereign debt, 8, 22 Finance reconstruction, 142 bank bashing, 146 “bankers”, 142 business model, challenges, 145 Citigroup, 145 cyclical businesses, 143 government management, 142 legitimacy bonus culture, 148–150 privileged opportunity, longestablished bank, 146 short-term share-price manipulation, 148 state and legal systems, 147 stock price, 147 mark-to-market price, 144 “producers”, 143 profession, definition, 163 prudence, 145, 161–163 root-and-branch transformation, 145 talent pool, 144 “the race for talent”, 143 trust cash management, 160 Financial Market Meltdown, 159 FSA, 159 hackneyed term, 159 information asymmetry, 159 non-bank financial service provider, 161 oversold/up-sold products, 159 utility Anglo-Saxon-type banking systems, 156 big data tools, 158 bills-of-exchange market, 150 branch and payment services, 157 clearinghouse creation, 158 core banking, 154 economic value transmission, 150 exchange of claims, 151 fee-income growth, 155 fiat money system, 151 financial intermediation, 150 financial transactions, 157 flexible contractor/subcontractor relationship, 158 information technology, 156 “liquidity premium”, 152 multidivisional/M-form organization, 153 non-interest income, 155 old-media companies, 157 Index overhead value analysis, 154 “privileged opportunity”, 152 quill pen–era practice, 158 sheer utility value, 155 silos, product business, 153 transaction accounts, 152 venture capital industry, 142 “War for Talent”, 143 Financial crises, 23 affordable housing, 24 banking “transmission” mechanism, 43 Basel III process, 50–51 basel process, 27–28 consumer banking(see Consumer banking) Dodd-Frank, 49–50 domestic banking system, 38 European Union, 51–53 FDIC, 40 finance-driven economy’s leverage machine, 43 Financial Market Meltdown, 25 GDP, 38 Government Policy and Central Banks, market meltdown(see Regulation process) government policy failure, 45 “government-sponsored” public companies, 24 Great Depression, 44 GSEs, 24 legal missteps, 47–48 New Deal, 43 panic-stricken markets, 40 political missteps, 45–47 Ponzi scheme, 42 postwar financial order, 25–27 printing money, 38 private profits and socialized losses, 40 private-sector demand, 43 public-sector demand, 42 quantitative approach, 25 TARP, 39 too-big-to-fail institutions, 41 Triple A bonds, 41 US Federal Reserve System, 38 Financial liberalization, 89 Financial Market Meltdown, 25, 61, 89, 109, 159 Financial repression, 9, 78, 111 Financial Services Authority (FSA), 60, 159 Food and Drug Administration (FDA), 69 Fordism, 68 Free-market capitalism, 89 Free markets, 3 French Revolution, 3 Front-end trading systems, 107 FSA.See Financial Services Authority G GDP, 11 “Giro” payments systems, 151 Global imbalance, 96 Globalization, 3 Global whirlwinds, 93 Asia, finance movement cultural differences, 110–111 Financial Market Meltdown, 109 Interest Equalization Tax, 109 language, law, and business culture, 109 primacy, 109 austerity(see Austerity) British Empire, 30 Chimerica, 97 China and United States cross-Pacific economy, 97 foreign interference and aggression, 98 headline growth rates, 97 repression revolution and series, 97–98 Second World War, 98 Smoot-Hawley Tariff, 98 surpluse trade, 97 sustainable development, 98 Chinese ascendancy, 113 clearing and settlement bottleneck, 106–107 Dynastic China, 112 169 Download from Wow!

pages: 257 words: 76,785

Shorter: Work Better, Smarter, and Less Here's How
by Alex Soojung-Kim Pang
Published 10 Mar 2020

On women and stress in part-time work, see Tarani Chandola et al., “Are Flexible Work Arrangements Associated with Lower Levels of Chronic Stress–Related Biomarkers? A Study of 6025 Employees in the UK Household Longitudinal Study,” Sociology 53, no. 4 (August 2019): 779–799, https://doi.org/10.1177/0038038519826014. On labor force participation rates of mothers, see “Labor Force Participation: What Has Happened Since the Peak?” Monthly Labor Review (September 2016), figure 8, www.bls.gov/opub/mlr/2016/article/pdf/labor-force-participation-what-has-happened-since-the-peak.pdf. CHAPTER 1 Sowol-Ro, Seoul, South Korea. Bong-Jin Kim talks with Sam Kim in “Coming Soon to Seoul: Robot-Delivered Jajangmyeon Noodles,” Bloomberg, February 27, 2019, www.bloomberg.com/news/articles/2019-02-27/coming-soon-to-seoul-robot-delivered-jajangmyeon-noodles; he talks about being a designer-CEO in Digital Insight Today, www.ditoday.com/articles/articles_view.html?

In the United States, mothers flocked to the labor force in growing numbers between the 1970s and late 1990s. For the last twenty years, though, those participation rates have stalled, suggesting that family-friendly policies have not had as large an impact as their designers, and many users, would have liked. Labor force participation of mothers, by age of youngest child, 1975–2015. Participation rates rose steadily through the 1990s, but in the last twenty years have barely improved—and sometimes have dropped. To different degrees, in the United States, United Kingdom, and Japan, women’s full-time participation rates in the workforce decline when they have young children and take years to recover; even after they return to work full-time, they often earn less than men (including fathers with dependent children) and have lower lifetime earnings.

pages: 300 words: 76,638

The War on Normal People: The Truth About America's Disappearing Jobs and Why Universal Basic Income Is Our Future
by Andrew Yang
Published 2 Apr 2018

Suddenly out of work, millions will struggle to find a new job, particularly those at the lower end of the skill ladder. Automation has already eliminated about 4 million manufacturing jobs in the United States since 2000. Instead of finding new jobs, a lot of those people left the workforce and didn’t come back. The U.S. labor force participation rate is now at only 62.9 percent, a rate below that of nearly all other industrialized economies and about the same as that of El Salvador and the Ukraine. Some of this is driven by an aging population, which presents its own set of problems, but much of it is driven by automation and a lower demand for labor.

The U-6 rate is a much more revealing measurement and has ranged between 9 percent and 16 percent for the past 10 years. The unemployment rate is a terribly misleading number that we should stop relying on unless it’s accompanied by a discussion of both the rate of underemployment and the labor force participation rate. “If we were undergoing a technological revolution, wouldn’t we be seeing it appear in increased productivity?” You probably weren’t thinking about this one. But it’s a question that economists and academics have been debating. The thought is that we’d see a productivity spike if we were doing a ton more with technology and fewer people.

The proportion of working-class adults who get married has plummeted from 70 percent in 1970 to only 45 percent today. The decline really accelerated in 2000, around the same time as manufacturing jobs started to disappear. There are a host of reasons for the decline of marriage. Some cite increased labor force participation and more options for women, who are now less reliant on men. Others discuss it in light of shifting cultural norms. However, the reduction in opportunities for working-class men is doubtless contributing to fewer people getting married. The problems among men have been well documented. An Atlantic article in 2016 called “The Missing Men” noted that one in six men in America of prime age (25–54) are either unemployed or out of the workforce—10 million men in total.

pages: 272 words: 76,154

How Boards Work: And How They Can Work Better in a Chaotic World
by Dambisa Moyo
Published 3 May 2021

Amazon letter to shareholders, 1998. http://media.corporate-ir.net/media_files/irol/97/97664/reports/Shareholderletter97.pdf. Black, Sandra E., Diane Whitmore Schanzenbach, and Audrey Breitwieser. The Recent Decline in Women’s Labor Force Participation. Washington, DC: Brookings Institution, 2017. www.brookings.edu/wp-content/uploads/2017/10/es_10192017_decline_womens_labor_force_participation_blackschanzenbach.pdf. BlackBerry Limited. “Annual Report Pursuant to Section 13(a) or 15(d) of the Securities Exchange Act of 1934,” prepared for US Securities and Exchange Commission, February 28, 2018. www.annualreports.com/HostedData/AnnualReportArchive/B/TSX_BB_2018.pdf.

Daily Mail, June 26, 2019. www.dailymail.co.uk/news/article-7181631/Wayfair-employee-walkout-called-alleged-furniture-sales-U-S-migrant-camp.html. Grigoli, Francesco, Zsóka Kóczán, and Petia Topalova. “Labor Force Participation in Advanced Economies: Drivers and Prospects.” In World Economic Outlook: Cyclical Upswing, Structural Change. Washington, DC: International Monetary Fund, 2018. www.elibrary.imf.org/view/IMF081/24892-9781484338278/24892-9781484338278/binaries/9781484338278_Chapter_2-Labor_Force_Participation_in_Advanced_Economies-Drivers_and_Prospects.pdf. Ground, Jessica, and Marc Hassler. “Corporate Governance: Thinking Fast and Slow.” Schroders, May 8, 2019. www.schroders.com/en/us/insights/economic-views/corporate-governance-thinking-fast-and-slow/.

pages: 626 words: 167,836

The Technology Trap: Capital, Labor, and Power in the Age of Automation
by Carl Benedikt Frey
Published 17 Jun 2019

Of course, it is true that the size of the American household also declined over this period, but to suggest that hours per person of in-home production did not fall ignores economies of scale.40 It doesn’t make much difference if dinner is prepared for a family of two or five. Research showing that female labor force participation expanded much more rapidly in areas where electric appliances were used more extensively provides evidence in favor of this view. Figure 7 shows the staggering increase in female labor force participation over the course of the twentieth century. In the period 1900–80, the female workforce expanded by 51 percentage points. An influential study by the economists Jeremy Greenwood, Ananth Seshadri, and Mehmet Yorukoglu, published in the Quarterly Journal of Economics, estimates that the household revolution alone can account for 55 percent of this increase.41 As the home became increasingly mechanized, more women entered the labor market to take on paid and often more fulfilling jobs, and more families suddenly had two incomes, making many American households richer in the process.

An influential study by the economists Jeremy Greenwood, Ananth Seshadri, and Mehmet Yorukoglu, published in the Quarterly Journal of Economics, estimates that the household revolution alone can account for 55 percent of this increase.41 As the home became increasingly mechanized, more women entered the labor market to take on paid and often more fulfilling jobs, and more families suddenly had two incomes, making many American households richer in the process. FIGURE 7: U.S. Labor Force Participation Rates for People Ages 25–64 by Sex, 1870–2010 Sources: 1870–1990: Historical Statistics of the United States (HSUS), Millennial Edition Online, 2006, ed. S. B. Carter, S. Gartner, M. R. Haines, A. L. Olmstead, R. Sutch, and G. Wright (Cambridge: Cambridge University Press), Table Ba393-400, Ba406-413, Aa226-237, Aa260-271, http://hsus.cambridge.org/HSUSWeb/HSUS EntryServlet; 2000–2010: Statistical Abstract of the United States 2012 (SAUS) (Washington, DC: Government Printing Office), Table 7 and 587.

In the period 1950–70 in particular, about 11.4 million women newly took up clerical occupations, while only 1.5 million men did so. The term “pink collar,” which became increasingly common in the 1970s, referred to the growth in the female, machine-tending clerical workforce.43 Much of the rise in labor force participation over the twentieth century, in other words, was due to mechanization, not just despite it. The Ride to Modernity As essential a part of this story as the transformation of the home and the factory was the revolution in the movement of goods and people. Indeed, the economic historian Alexander Field has argued that productivity growth in the period 1919–73 can be thought of as “a tale of two transitions.”44 The first involved the redesign of the factory to take advantage of the virtues of electricity, whereas the second constituted a shift toward the horseless age, as motorized vehicles revolutionized transportation and distribution.

pages: 667 words: 149,811

Economic Dignity
by Gene Sperling
Published 14 Sep 2020

Aliya Alimujian, Ashley Wiensch, and Jonathan Boss, “Association Between Life Purpose and Mortality Among US Adults Older Than 50 Years,” Journal of the American Medical Association Network Open 2, no. 5 (2019), https://doi.org/10.1001/jamanetworkopen.2019.4270. 92. Eleanor Krause and Isabel Sawhill, “What We Know and Don’t Know about Declining Labor Force Participation: A Review,” Brookings Institution, May 2017, 21, https://www.brookings.edu/wp-content/uploads/2017/05/ccf_20170517_declining_labor_force_participation_sawhill1.pdf. 93. Alan B. Krueger, “Where Have All the Workers Gone? An Inquiry into the Decline of the U.S. Labor Force Participation Rate,” Brookings Papers on Economic Activity, BPEA Conference Drafts, September 7–8, 2017, https://www.brookings.edu/wp-content/uploads/2017/09/1_krueger.pdf. 94.

Whites with low levels of education—a group that has suffered from deaths of despair at high rates, though far from the only demographic to be affected—report a lack of hope and optimism, and low satisfaction in life, even when compared with other demographic groups that are objectively worse off economically.90 As economists Carol Graham and Sergio Pinto note, “Lack of hope for the future stands out as the most important sign of vulnerability to deaths of despair,” and the declining life expectancy of less-educated whites due to suicides and opioids is only the most recent “marker of this desperation.”91 Economists Eleanor Krause and Isabel Sawhill found that in the ten counties with the highest rates of deaths of despair, the male labor force participation rate (those who are working or looking for work) was only 73 percent—compared with 88 percent nationally at that time in 2014.92 Alan Krueger found that prime-age men who are out of the labor force, about half of whom take medication for pain on a daily basis, report having low levels of emotional well-being and find little meaning from their daily activities.93 While the rise in mortality rates of low-educated white Americans is a critical development that deserves national attention, no one should see the tragedy of deaths of despair as new or limited to any racial group.

It also has a stringent application process; more than half of applicants are ultimately denied SSDI benefits, and 10,000 people a year die waiting to get approved for benefits.18 Research on those who barely lose their appeals seeking SSDI, and therefore do not receive benefits, shows that the vast majority do not then go out and get jobs—undercutting the core premise that but for SSDI, such workers would be economically self-sufficient or at least holding down gainful employment. Even accepting the very worst assumptions, SSDI has been found to account for at most one-fifteenth of the recent decline in male labor force participation for workers ages twenty-five to fifty-four.19 While conservatives like Rand Paul belittle those who go on SSDI for disabilities such as mental illness or musculoskeletal issues as being “either anxious or their back hurts,”20 in reality most SSDI recipients are like Jeanetta Smith. Ms. Smith is a fifty-one-year-old SSDI recipient who lives in Robbins, Tennessee, and worked for twenty-five years, first in a textile factory, then after the factory closed down as a certified nursing assistant at a nursing home.

pages: 349 words: 99,230

Essential: How the Pandemic Transformed the Long Fight for Worker Justice
by Jamie K. McCallum
Published 15 Nov 2022

They were more likely to lose their jobs, more likely to be forced to quit them, and less likely to return to them. Unpaid caregiving responsibilities pushed 2.3 million women out of the labor force between February 2020 and February 2021.22 By that time, women’s labor force participation rate registered at 56 percent, the lowest rate since 1988.23 The gap between men’s and women’s labor force participation widened in places where school closures intensified caregiving needs, more evidence that women are still disproportionately burdened by caregiving concerns.24 Babysitters were scarce, as were in-home day care centers and more established businesses.

Seventy-five percent of the healthcare workers who contracted the virus early in the pandemic were women, for example. Over the last three decades, women have steadily increased their participation in the paid workforce; in 2019, they held more than half of all jobs. The pandemic recession reversed this trend: by January 2021, women’s labor force participation rate had fallen below 56 percent, about the same as it was in 1987. By December 2020, men had gained a net 16,000 jobs while women, nearly all of them women of color, had lost 156,000.34 Vice President–elect Kamala Harris called it a “national emergency” for women.35 African Americans and Latinos also faced higher rates of unemployment during the pandemic.

Steven Jessen-Howard, Rasheed Malik, and MK Falgout, Costly and Unavailable: America Lacks Sufficient Child Care Supply for Infants and Toddlers, Center for American Progress, August 4, 2020, www.americanprogress.org/article/costly-unavailable-america-lacks-sufficient-child-care-supply-infants-toddlers/; “Child Care Sector Jobs: BLS Analysis,” Center for the Study of Child Care Employment, November 8, 2021, https://cscce.berkeley.edu/child-care-sector-jobs-bls-analysis/. 22. A Year of Strength & Loss: The Pandemic, the Economy, & the Value of Women’s Work, National Women’s Law Center, March 2021, https://nwlc.org/wp-content/uploads/2021/03/Final_NWLC_Press_CovidStats_updated.pdf. 23. “Labor Force Participation Rate—Women,” FRED Economic Data, August 6, 2021, https://fred.stlouisfed.org/series/LNS11300002. 24. Caitlyn Collins et al., “The Gendered Consequences of a Weak Infrastructure of Care: School Reopening Plans and Parents’ Employment During the COVID-19 Pandemic,” Gender & Society 35, no. 2 (April 2021): 180–193, https://doi.org/10.1177/08912432211001300. 25.

pages: 250 words: 64,011

Everydata: The Misinformation Hidden in the Little Data You Consume Every Day
by John H. Johnson
Published 27 Apr 2016

As Brown explained, “most economists understand that what we are really doing is making ‘projections’ rather than ‘predictions.’ In other words, we can be reasonably comfortable in modeling how the system’s finances will evolve if fertility or mortality or labor force participation evolves in a particular way. But we are much less comfortable stating with any certainty that fertility or mortality or labor force participation will move in a particular way.” But unless someone has been trained in statistics (or has read this book!) these types of subtleties and nuances may not mean much to them. “As a result,” noted Brown, “we often see situations in which people express surprise or disappointment or even anger when a policy does not have exactly the predicted effect, even in cases where the outcome is well within the confidence interval that would have applied to the initial estimate.”

They also found that the number of workers who had enough stock assets for the decline in the market to affect their retirement decision was too small to explain changes in the size of the labor force. In the end, explained Coile, “even though the story sounded plausible, the stock market was less important than other factors in explaining changes in labor force participation during this time.” As you’re consuming your everydata, keep in mind that skilled magazine writers, TV producers, and advertising copywriters know how to manipulate words, because their job is to get your attention. Don’t fall for it. Read every word. Think about what they’re saying—and what they’re not saying.

pages: 288 words: 64,771

The Captured Economy: How the Powerful Enrich Themselves, Slow Down Growth, and Increase Inequality
by Brink Lindsey
Published 12 Oct 2017

In the twenty-first century, however, this pattern of offsetting fluctuations has come to a halt as all growth components have fallen off simultaneously. Hours worked per capita surged from the mid-1960s until 2000, thanks to the entry of baby boomers into the workforce and rapidly rising labor force participation by women. Since 2000, however, hours worked have fallen as labor force participation has dropped sharply for both sexes. Meanwhile, growth in the skill level of the workforce has tapered off after decades of sharp increases in the average years of schooling completed. Net national investment (investment net of depreciation charges) as a percentage of net national product has been falling for decades, dragged down by the more widely reported drop in the national savings rate.

Even if rent-seeking could be eliminated altogether, deep-seated and powerful forces would still cause the economic pie to grow more slowly and its sustenance to be shared less evenly. The aging of the population and the exhaustion of possibilities for rapid improvement in educational attainment and women’s labor force participation already meant that growth would slow in the absence of a surge in productivity growth. With the rise of policies that suppress and distort competition in key sectors, productivity growth has been hampered instead of encouraged; consequently, the country’s growth outlook is now even cloudier.

pages: 421 words: 110,272

Deaths of Despair and the Future of Capitalism
by Anne Case and Angus Deaton
Published 17 Mar 2020

Perhaps the troubles of the working class have nothing to do with wages and jobs, or any other external circumstance, but rather, as argued by the political scientist Charles Murray, come from a loss of industriousness and other American virtues among less educated white Americans.36 If so, it is not clear that policies can help; a moral or religious revival is needed. We do not share this view. In chapter 11 on the labor market, we saw that both labor force participation and wage rates were declining for less educated whites, for men for many years, and more recently for women. That participation and wages should decline together is a clear indication that employers want fewer less skilled workers; there are fewer jobs, and workers are reacting either by withdrawing from the market (lower participation) or by taking worse jobs (lower wages).

SMA 17-5044, NSDUH Series H-52, Center for Behavioral Statistics and Quality, Substance Abuse, and Mental Health Services Administration, https://www.samhsa.gov/data/sites/default/files/NSDUH-FFR1-2016/NSDUH-FFR1-2016.pdf. 8. Dionissi Aliprantis, Kyle Fee, and Mark Schweitzer, 2019, “Opioids and the labor market,” Federal Reserve Bank of Cleveland, Working Paper 1807R; Alan B. Krueger, 2017, “Where have all the workers gone? An inquiry into the decline of the U.S. labor force participation rate,” Brookings Papers on Economic Activity, Fall, 1–87. 9. Jared S. Hopkins and Andrew Scurria, 2019, “Sacklers received as much as $13 billion in profits from Purdue Pharma,” Wall Street Journal, October 4. 10. Sam Quinones, 2015, Dreamland: The true tale of America’s opiate epidemic, Bloomsbury. 11.

Kearny, 2019, “Explaining the decline in the US employment to population ratio: A review of the evidence,” NBER Working Paper 24333, revised August. 11. Not everyone sees a ratchet effect in figure 11.2. Nicholas Eberstadt of the American Enterprise Institute argues that “there is a remarkable linearity of the decline in labor-force participation rates for prime-age American men over the past fifty years. This great male flight from work has been almost totally un-influenced by economic fluctuations.” Eberstadt, 2018, “Men without work,” American Consequences, January 30, http://www.aei.org/publication/men-without-work-2/. 12.

pages: 636 words: 140,406

The Case Against Education: Why the Education System Is a Waste of Time and Money
by Bryan Caplan
Published 16 Jan 2018

Table 4.1: Sheepskin Effects in the General Social Survey (1972–2012) Effect on Earnings Education If Only Years of Education Matter If Diplomas Matter Too Years of Education +10.9% +4.5% High School Diploma – +31.7% Junior College Diploma – +16.6% Bachelor’s Degree – +31.4% Graduate Degree – +18.2% All results correct for age, age squared, race, and sex; are limited to labor force participants; and are converted from log dollars to percentages. In the good old days, when the reality of the sheepskin effect was still in doubt, economists took the sheepskin-signaling connection for granted. Every paper that found sheepskin effects scored a point for signaling; every paper that failed to find sheepskin effects scored a point for human capital.

Absolute payoffs for high school diplomas, bachelor’s degrees, and graduate degrees barely budge—and their relative payoffs actually rise.11 Table 4.2: Sheepskin Effects and Ability Bias in the General Social Survey (1972–2012) Effect on Earnings Education Only Years of Education Matter Diplomas Matter Too Years of Education +10.3% +4.2% High School Diploma – +32.0% Junior College Diploma – +10.4% Bachelor’s Degree – +29.8% Graduate Degree – +17.8% All results adjust for age, age squared, race, sex, and cognitive ability; are limited to labor force participants; and are converted from log dollars to percentages. Ability bias explanations for sheepskin effects aren’t just hard to square with the statistical evidence; they’re hard to square with the glaring fact that education spikes in degree years. If the labor market ignores credentials, why do so many high school grads opt for zero college—and so many college grads opt for zero graduate education?

In the CPS, “full-time” workers can be unemployed, but “year-round workers” must work 50–52 weeks per year. Bureau of Labor Statistics 2015j, p. 3. 18. See especially Greenstone and Looney 2011, 2012. 19. For further discussion, see Caplan 2014a. 20. All rates come from the Federal Reserve Bank of St. Louis (FRED) website for unemployment of labor force participants aged 25–64. Variable identifiers LNU04027675, LNU04027676, CGBD2564M, and CGMD2564M for men, and LNU04027679, LNU04027680, CGBD2564W, and CGMD2564W for women. Calculations continue to assume a 50/50 gender balance. I use average 2000–2013 unemployment because 2011 unemployment was atypically high owing to the Great Recession. 21.

pages: 772 words: 203,182

What Went Wrong: How the 1% Hijacked the American Middle Class . . . And What Other Countries Got Right
by George R. Tyler
Published 15 Jul 2013

Their broad middle-class societies have not overtaken America economically by sitting in cafés drinking Pilsner lager, Foster’s VB, or sipping espresso while smoking Gauloises. We know that because a greater share of their population than America’s works. Even though 2005 was a boom year in America, the labor-force participation rate was higher in every family capitalism country than in America. These statistics are reproduced from OECD data in Table 9. Note that the gap is actually larger than these statistics suggest, because they include Europeans aged 60–64, many of whom are happily retired. Labor Force Participation Rate Ages 25-64 Men and Women, 2005 High school graduates College graduates Australia 82.6% 86.6% Austria 77.3% 86.8% Belgium 79.5% 87.4% France 80.9% 86.8% Germany 79.3% 87.7% Netherlands 81.3% 88.1% United States 76.7% 84.7% Table 9.

In 2010 for the first time, more than half (53 percent) of all such American households face significantly reduced livings standards as pensioners.8 Their reaction has been to delay retirement. There are a number of charts in this narrative, but the next one perhaps most eloquently summarizes the consequences for most Americans of the Reagan decline. As depicted in Chart 25.1, labor force participation rates for both men and women age 65 to 69 ceased dropping early in the Reagan era, and reversed course thereafter. Now nearly one in every three seniors works, competing for jobs with their grandchildren. This rise in delayed retirements is quite a contrast to the experience of our parents or grandparents during the golden age, particularly men.

Rising real wages back then enabled them to substitute leisure for labor like northern Europeans now, a happy phenomenon which caused the annual work effort of Americans to decline to about 1,800 hours, where it has been stuck ever since. Chart 25.1. Sources: Floyd Norris, “The Number of Those Working Past 65 Is at a Record High,” New York Times, May 12, 2012. “Labor Force Participation Rates of Persons 50 years and Over by Age, Sex, and Race, 1950-1990,” table 4–2, US Bureau of Census, Washington. Although from a very low base, the number of seniors working increased eleven times faster than overall employment from 1999 to 2008. And the actual number of working seniors over age 65 has doubled since 1999, their share of the workforce rising disproportionately.9 These are not just part-time jobs being taken to top-off pensions.

pages: 627 words: 89,295

The Politics Industry: How Political Innovation Can Break Partisan Gridlock and Save Our Democracy
by Katherine M. Gehl and Michael E. Porter
Published 14 Sep 2020

Workers—our most valuable national asset—are underutilized. Recent job gains and headlines that tout a low unemployment rate hide the millions of Americans who have been forced into part-time jobs, are not earning a living wage, or have stopped searching for work all together. After decades of steady gains, labor-force participation has shrunk since 2000 to levels not seen since the 1980s. This falloff reflects the fact that American companies are creating fewer jobs than before. The new jobs that are created are disproportionately concentrated in low-skill sectors shielded from international competition. All these forces have combined to depress wages.

Reed, 146 Democratic Study Group, 56 Diamond, Larry, 155 Diner, Steven, 200n25 Dingell, John, 192n56 direct democracy, 112 citizens’ influence over policy using, 111, 112, 174 Final-Five Voting and, 145–146 Founders and, 94 personal agency supporting, 174 Progressive movement and, 112, 121, 143–144, 145 Direct Legislation by the Citizenship through the Initiative and Referendum (Sullivan), 112 Direct Legislation League (DLL), 110, 112, 206n71 direct primaries, 111–112, 205n66, 206n69 discharge petitions, 193–194n65 Dodson, David, 184n18 Dole, Bob, 43 donors barriers to new competition and, 35 currency of votes and, 22 divisive legislation and, 66 duopoly in politics industry and, 7, 35 fundraising rules and, 35 paid advertising control by, 29 power of, as customers in politics industry, 24, 25, 25–27 See also campaign contributions Dorgan, Bryan, 197n19 Drutman, Lee, 52, 132, 183n14 dual political currency, 22–23 Dunlap, Matthew, 152, 154 duopoly arenas of competition for, 12, 22 average voters’ usefulness for, 27 ballot access rules and, 204n63 barriers of entry and, 23, 105 California primary reform opposition from, 149–150 candidates’ running as a supposed “outsider” within a party and, 36–37 channels used by, 28 competition and rules written by, 21 Congress and power of, 118, 209n2 direct voter contact and, 29 donor fundraising rules and, 35 elected officials beholden to, 120 elections and, 12, 23–24, 45, 118–119, 121 emergence of, after the Civil War, 103 Federal Election Commission members and, 35 Gilded Age and, 96–97 Hayes-Tilden 1876 election and, 101–102 idea suppliers and, 33 immigration as a wedge issue and, 75 immigration reform and, 73–75 individual candidate platforms and party line and 31 lack of accountability and, 72 large-dollar donors and, 26 legislative machinery and, 12, 41, 45, 118, 134 lobbyists used by, 33 Maine’s ranked-choice voting and, 153, 154, 155 paid advertising and, 29 party primaries and, 46, 49 Perot’s independent campaign and, 119 political-industrial complex and, 24, 38 politics industry and power of, 7, 39, 95–96, 103 presidential debate rules from, 42–43 pushback against political innovation by, 160 Reconstruction changes and, 101–102 rivalry and control in, 23–24 rules and power of, 44, 45, 118 state primary reform and, 155, 156 suppliers controlled by, 23, 31, 32, 33, 184n18 talent in politics and, 31–32 traditional independent media and 29 Trump as hybrid substitute to, 36 use of term, 12 voter data and, 32 voters’ rejection of, in 2016 election, 36 “Dutch Treat” Club, Boston, 204n61, 204–205n64 economic competitiveness, 75–78 definition of, 75 economic performance deterioration and, 76 government policy and, xiv impact on families and communities of decline in, 77 labor-force participation and, 76–77 as a politics problem, 78 productivity growth and, 76 survey (2016) on, 77–78, 79 economic conditions Americans’ views on democracy and, 196n10 Gilded Age political dysfunction and, 99–100, 107, 108, 115, 201n46 globalization and, 115–116 government policy and, xiv impact of industrialization on, 100 new wave of immigration and, 116 Progressive reforms and, 98, 203n57 Economist, 149 Edison, Thomas, 143 Edwards, Mickey, 3 Eighteenth Amendment, 206–207n76 Eisenhower, Dwight D., 37–38 election laws Federal Election Commission and, 35 Massachusetts ballot reform and, 204–205n64 election rules and practices.

See electoral innovation; political innovation Institute of Politics, Harvard University, 188n3 Interstate Commerce Act (1887), 107 Issue One, 215n79 i360, 360 Jefferson, Thomas, 18, 19, 20, 95, 126–127 Jim Crow laws, 102, 108 Johnson, Gary, 51 Johnson, Lyndon, 85 Joint Committee on Direct Legislation, 206n71 Joint Committee on the Reorganization of Congress, 140 Justice Department, 35 Kennedy, John F., 163 Kennedy, Ted, 73, 74, 196n15, 196–197n18, 197n19 Khanna, Ro, 124 King, Angus, 151 Ku Klux Klan, 100 labor-force participation, 76–77 La Follette, Robert “Fighting Bob,” 110, 166 Lamont, Ned, 48 lawmaking. See legislative machinery Lawrence, Eric, 206n69 Lawrence, Jennifer, 155 laws anti-immigration sentiment and passage of, 100 Bismarck on making of, 134 Gilded Age passage of, 107 Progressive movement and, 114, 202n49 See also specific laws leadership, in solutions, 87 Leadership Now, 174 League of Women Voters, 41–42, 213n65 Lee, Frances E., 193n63 legislative machinery, 52–60 Affordable Care Act and, 53–54, 85–86, 194–195n1, 198n37 barriers to entry and partisanship in, 35 Cannon Revolt to decentralize committee power in, 113, 121, 163 commission for designing new blueprint for, 137–139 Congress as focus in, 12–13 current state of, 4–7 declining bipartisan support in, 66, 67 declining percentage of moderates in, 67, 68 description of, 45 direct democracy circumventing, 112, 145 duopolistic competition and, 12, 22 duopoly’s power in, 12, 41, 45, 118, 134 elections machinery combined with, 120–121, 141 electoral innovation and, 133, 161 Final-Five Voting and need for change in, 10, 133 former regulators and congressional staffers as lobbyists and, 27 Gilded Age and, 106, 113, 201nn33, 45 gridlock on important issues in, 67, 68 Hastert Rule and, 54–55 idea suppliers and, 32 identity politics in, 69–70 as key rule and practice, 41 lobbyists and, 33–34 member fundraising and power in, 59–60 model, modern legislative machinery proposed for, 10, 13, 120, 134–136 Nebraska’s Model Legislature Committee on, 163–164, 165 need for changes in, 120, 134–135, 141 nonpartisan, 213–214n66 nonurgent crises bypassed in, 69 partisan takeover of Congress and, 55–59 party bosses in, 46, 104, 106, 111, 112, 202–203n55, 203n57, 205nn66, 69 party primaries’ influence on legislators in, 49, 88 path of a bill in, 60–63 perception of as a corrupted system, 4 political disillusionment of public and, 70–71 political machines in, 104, 201n33, 202n54, 202–203n55, 204n61, 205n67, 205–206n69, 206n72, 213n60 political messaging in, 194–195n1, 198n36 political parties’ control of, 3, 200n24 Politics Industry Theory on, 10 problem solving decline in, 66 Progressive reforms of, 113, 114, 121 public desire for third party and, 71, 72 public trust in government and, 70, 70 reimagining new process for, 170 rules used in, 136 Select Committee for modernizing, 137–138 show votes in, 86, 194–195n1 single party control for passage in, 66–67 textbook Congress and in, 55–56, 113, 163 urgent crises and deficit financing in, 67–69 use of term, 12 volatile swings of voter sentiment in, 71–72 Washington State’s reengineering of, 215n79 zero-based rule making and, 135–136 Legislative Machinery Innovation Commission proposal earlier commission proposals and, 137–138 earlier successful models and, 139–141 functions of, 138–139 purpose of, 137–138 zero-based approach used by, 136 Legislative Reorganization Act (1946), 113, 138, 140–141 legislative staffers.

pages: 288 words: 86,995

Rule of the Robots: How Artificial Intelligence Will Transform Everything
by Martin Ford
Published 13 Sep 2021

Anyone who would like to have a job but has become disheartened and given up or who believes there are no jobs available that they would be willing to accept, is not counted as unemployed. To get some insight into the number of people who have become completely detached from the labor force, it’s useful to look at the labor force participation rate. The story here is far less positive than the headline unemployment rate. As Figure 1 shows, the percentage of prime age working men in work or actively seeking employment has fallen from about ninety-seven percent in 1965 to a nadir of eighty-eight percent in 2014 before recovering slightly to about eighty-nine percent in January 2020.6 The number of men entirely disenfranchised from the job market has nearly quadrupled over this time.

One destination for men who have been exiting the job market appears to be the Social Security Disability program, which saw a surge of applications between 2007 and 2010.7 Given that there was no evidence of an epidemic of workplace injuries, it seems likely that the program is being used as an income of last resort by workers who see few viable job market opportunities. While the impact on labor force participation for men has been the most dramatic, the overall statistics show a broadly similar story over the two decades since the turn of the century. Figure 2 shows the workforce participation rate for all workers aged eighteen to sixty-four, including both men and women.8 The rising participation rate up to the year 2000 reflects the entry of more women into the workforce.

Louis, July 17, 2020, fred.stlouisfed.org/series/LRAC25MAUSM156S. 7. “Trends in Social Security Disability Insurance,” Social Security Office of Retirement and Disability Policy, Briefing Paper No. 2019-01, August 2019, www.ssa.gov/policy/docs/briefing-papers/bp2019-01.html. 8. U.S. Bureau of Labor Statistics, “Labor force participation rate (CIVPART),” retrieved from Federal Reserve Bank of St. Louis, July 17, 2020, fred.stlouisfed.org/series/CIVPART. 9. U.S. Bureau of Labor Statistics, “Business sector: Real output per hour of all persons (OPHPBS),” retrieved from Federal Reserve Bank of St. Louis, July 22, 2020, fred.stlouisfed.org/series/OPHPBS; U.S.

pages: 441 words: 124,798

Dopesick: Dealers, Doctors and the Drug Company That Addicted America
by Beth Macy
Published 4 Mar 2019

Princeton economist Alan B. Krueger’s 2017 study also backs Monnat’s thesis: “The opioid crisis and depressed labor force participation are now intertwined in many parts of the U.S.,” he said, in the Brookings Institution paper “Where Have All the Workers Gone? An Inquiring into the Decline of the U.S. Labor Force Participation Rate,” Sept. 7, 2017, found here: https://www.brookings.edu/bpea-articles/where-have-all-the-workers-gone-an-inquiry-into-the-decline-of-the-u-s-labor-force-participation-rate/. Related: Fred Dews, “How the Opioid Epidemic Has Affected the U.S. Labor Force, County-by-County,” Brookings Institution, Sept. 7, 2017.

Your returns won’t be as high, but you could now drive in just twenty minutes to Little Baltimore: Martinsburg, West Virginia. That’s what happens when rural America becomes the new inner city, ranking dead last behind cities, suburbs, and small metro areas in measures of socioeconomic well-being that include college attendance, income, and male labor-force participation. “They can make all the task forces they want, but they’re never gonna stop it because the profits are just too great,” Dennis said. “And the heroin is only getting closer and closer and closer.” Dennis’s plan, when I talked to him the summer after Santiago went to prison, was to take what some call the geographic cure.

pages: 175 words: 45,815

Automation and the Future of Work
by Aaron Benanav
Published 3 Nov 2020

Whether China will be able to retain its competitive position as its wage levels rise remains an open question; Chinese firms have been robotizing to try to head off this possibility.47 CHAPTER 3 In the Shadow of Stagnation THE EVIDENCE I CITED in the previous chapter to explain job loss in the manufacturing sector through worsening overcapacity may appear to have little purchase on the larger, economy-wide trends that automation theorists attribute to growing technological dynamism: stagnant wages, falling labor shares of income, declining labor force participation rates, and jobless recoveries after recessions. Automation may therefore still seem a good explanation for the decline in the demand for labor across the service sectors of each country’s economy, and so across the world economy as a whole. Yet automation has had even less of an impact in services than it has in manufacturing.

The workers who suffered most were the unemployed, as well as the children and spouses of still-employed workers. The jobs crisis took the form of a worsening exclusion; it was concentrated on specific sectors of the population rather than widely diffused. Older unemployed workers were pushed into early retirement. Married women were discouraged from looking for work, which is why women’s labor force participation rates remained low in many European countries and Japan—with Sweden as a key exception—into the 2000s.16 Given employees’ stronger holds over the jobs they possessed, European and East Asian firms needed to secure institutional changes in employment relations in order to take advantage of low levels of labor demand.

No Slack: The Financial Lives of Low-Income Americans
by Michael S. Barr
Published 20 Mar 2012

Standard errors are in parentheses. All estimates are weighted. Clustered standard errors are reported to account for stratified sampling design. Reference category consists of individuals who are not black, male, not married, not U.S. citizens, have some college or more, are not in poverty, are out of the labor force, participate in financial decisionmaking “a little,” and shop around for financial services “some.” *Statistically significant at the 10 percent level, two-tailed test. **Statistically significant at the 5 percent level, two-tailed test. ***Statistically significant at the 1 percent level, two-tailed test. 12864-03_CH03_3rdPgs.indd 63 3/23/12 11:55 AM 64 michael s. barr, jane k. dokko, and benjamin j. keys Table 3-3.

For LAD regressions, bootstrap standard errors based on 1,000 replications are reported to account for the stratified sampling design. Pseudo R 2 reported for LAD regressions. Reference category consists of individuals who are not black, male, not married, not U.S. citizens, have some college or more, are not in poverty, are out of the labor force, participate in financial decision making “a little,” and shop around for financial services “some.” *Statistically significant at the 10 percent level, two-tailed test. **Statistically significant at the 5 percent level, two-tailed test. ***Statistically significant at the 1 percent level, two-tailed test. 1ST PAGES 12864-03_CH03_3rdPgs.indd 72 3/23/12 11:55 AM Table 3-7.

For LAD regressions, bootstrap standard errors based on 1,000 replications are reported to account for the stratified sampling design. Pseudo R 2 reported for LAD regressions. Reference category consists of individuals who are not black, male, not married, not U.S. citizens, have some college or more, are not in poverty, are out of the labor force, participate in financial decisionmaking “a little,” and shop around for financial services “some.” *Statistically significant at the 10 percent level, two-tailed test. **Statistically significant at the 5 percent level, two-tailed test. ***Statistically significant at the 1 percent level, two-tailed test. 12864-03_CH03_3rdPgs.indd 73 3/23/12 11:55 AM Table 3-8.

pages: 389 words: 87,758

No Ordinary Disruption: The Four Global Forces Breaking All the Trends
by Richard Dobbs and James Manyika
Published 12 May 2015

In the United States, the grinding years of low job growth have taken their toll on the dynamic American labor market. Real median household income has been essentially flat for twenty-five years.2 Youth unemployment is at record levels. Lower-skilled workers have faced the brunt of these changes. Many have left the workforce altogether; America’s labor force participation in 2014 was lower than at any time in the past thirty-six years.3 What happened? Armed with new technologies—information tools and machines that substitute for labor—and the ability to tap into the vast, newly engaged labor pools of China and India, companies in advanced countries have been able to maintain or even increase productivity during times of growth and in downturns.

Under the so-called Hartz reforms, Chancellor Gerhard Schröder revamped the German labor market by improving vocational education, creating new job types, and changing unemployment and welfare benefits. The wide-ranging reforms were deeply unpopular. More than one hundred thousand people marched in the Monday demonstrations of 2003 to protest cuts to social welfare benefits.4 Older workers—whose labor force participation rose after the reforms—were not always interested in extending their careers. Chancellor Schröder’s party lost the 2005 elections to Merkel, who subsequently benefited from the German miracle. In the era of trend breaks, the primary challenge for policy makers is the one Germany’s government faced in the early 2000s.

Huiyao Wang, “China’s return migration and its impact on home development,” UN Chronicle L, no. 3, September 2013, http://unchronicle.un.org/article/chinas-return-migration-and-its-impact-home-development. 38. World development indicators. 39. Starting strong II: Early childhood education and care, OECD, September 2006, www.oecd.org/edu/school/startingstrongiiearlychildhoodeducationandcare.htm. 40. “Table 1368: Female labor force participation rates by country: 1980 to 2010,” Statistical Abstract of the United States 2012, United States Census Bureau, US Department of Commerce, www.census.gov/compendia/statab/2012/tables/12s1368.pdf. 41. Denmark in Figures 2013, Statistics Denmark, February 2013, www.dst.dk/en/Statistik/Publikationer/VisPub.aspx?

pages: 593 words: 183,240

Slouching Towards Utopia: An Economic History of the Twentieth Century
by J. Bradford Delong
Published 6 Apr 2020

In 1920 only 4 percent of married white women around the age of thirty worked; by 1980 nearly 60 percent of married white women near thirty worked. Labor force participation by married nonwhite women near thirty rose less, but from a higher base and to a greater level: from approximately 33 percent in 1920 to 72 percent by 1980. But this gives us an incomplete picture. Consider, for instance, the difference between women born around 1920 and those born around 1960. The earlier cohort reached adulthood around 1940 and were sixty years old in 1980. The labor force participation rate of those who were married rose from roughly 15 percent when they were twenty to approximately 45 percent when they were fifty.

The labor force participation rate of those who were married rose from roughly 15 percent when they were twenty to approximately 45 percent when they were fifty. Women born forty years later, around 1960, already had a 60 percent labor participation rate (among those who were married) when they were twenty—and every sign is that married women’s labor force participation rises with age. However, the large increase in female labor force participation over the course of the twentieth century, while encouraging, was not accompanied by any rapid closing of the earnings gap between male and female workers. Although various sources report substantial rises in female-relative-to-male wages over the course of the nineteenth century, and some continued gains up until 1930, for most of the twentieth century female wages remained roughly 60 percent of male wages.

Although various sources report substantial rises in female-relative-to-male wages over the course of the nineteenth century, and some continued gains up until 1930, for most of the twentieth century female wages remained roughly 60 percent of male wages. One reason female relative earnings failed to rise throughout the middle years of the twentieth century is the rapidity with which women expanded into the labor force. This rapid expansion in labor force participation meant that at any moment a relatively low share of the female labor force had a high level of experience. And because firms pay more for experienced workers—both because experienced workers are more productive and because the promise of regular pay increases along a well-established career track can serve as a powerful way to motivate employees—that relative lack of experience kept women’s relative wages low.

pages: 173 words: 53,564

Fair Shot: Rethinking Inequality and How We Earn
by Chris Hughes
Published 20 Feb 2018

The dignity of work is often used to invoke imagery of white men on assembly lines, demonstrating determination and resilience to provide for their families, in implied contrast to images of black women who passively rely on government handouts. Nothing could be further from the truth. In fact, labor force participation rates are higher for single black mothers (76 percent) than for white men (72 percent). And that doesn’t even take into account any nontraditional work like caregiving that many women do. The malicious ways work requirements have been used in the past make me suspicious of some calls on the left for a federal job guarantee in lieu of a guaranteed income.

104 Someone who is unemployed is more than twice as likely to use illegal drugs: Badel and Greaney, “Exploring the Link”; Dooley, Catalano, and Wilson, “Depression and Unemployment.” 104 The correlation between unemployment rates and opioid abuse in particular is staggering: Hollingsworth, Ruhm, and Simon, “Macroeconomic Conditions and Opioid Abuse.” 105 “If a man is called to be a street sweeper”: Fassler, “‘All Labor Has Dignity.’” 106 “AFDC mothers, for example, are often forced to answer questions about their sexual behavior”: Piven and Cloward, Regulating the Poor, Loc. 2959. 108 labor force participation rates are higher for single black mothers: U.S. Department of Labor, “Working Mothers Issue Brief”; Bureau of Labor Statistics, “Employment Status of the Civilian Population.” 108 “People seeking jobs would come to these local offices”: Spross, “You’re Hired!” 108 The cost would be significantly higher than a guaranteed income: Paul et al., “Returning to the Promise of Full Employment.” 109 subsidized public-sector employment programs consistently came in last: Card et al., “What Works?”

pages: 209 words: 53,175

The Psychology of Money: Timeless Lessons on Wealth, Greed, and Happiness
by Morgan Housel
Published 7 Sep 2020

At the end of 2018 there was $27 trillion in U.S. retirement accounts, making it the main driver of the common investor’s saving and investing decisions.⁵ But the entire concept of being entitled to retirement is, at most, two generations old. Before World War II most Americans worked until they died. That was the expectation and the reality. The labor force participation rate of men age 65 and over was above 50% until the 1940s: Social Security aimed to change this. But its initial benefits were nothing close to a proper pension. When Ida May Fuller cashed the first Social Security check in 1940, it was for $22.54, or $416 adjusted for inflation. It was not until the 1980s that the average Social Security check for retirees exceeded $1,000 a month adjusted for inflation.

As for the top one percent, the really well-to-do and the rich, whom we might classify very roughly indeed as the $16,000-and-over group, their share of the total national income, after taxes, had come down by 1945 from 13 percent to 7 percent. This was not a short-term trend. Real income for the bottom 20% of wage-earners grew by a nearly identical amount as the top 5% from 1950 to 1980. The equality went beyond wages. Women held jobs outside the home in record numbers. Their labor force participation rate went from 31% after the war to 37% by 1955, and to 40% by 1965. Minorities gained, too. After the 1945 inauguration Eleanor Roosevelt wrote about an African American reporter who told her: Do you realize what twelve years have done? If at the 1933 reception a number of colored people had gone down the line and mixed with everyone else in the way they did today, every paper in the country would have reported it.

The Origins of the Urban Crisis
by Sugrue, Thomas J.

On the family wage, see Martha May, “The Historical Problem of the Family Wage: The Ford Motor Company and the Five Dollar Day,” Feminist Studies 8 (1982): 399–424; Elizabeth Faue, Community of Suffering and Struggle (Chapel Hill: University of North Carolina Press, 1991). On female labor force participation and changing ideas about women and work, see the important article by Susan M. Hartmann, “Women’s Work and the Domestic Ideal in the Early Cold War Years,” in Not June Cleaver: Women and Gender in Postwar America, ed. Joanne Meyerowitz (Philadelphia: Temple University Press, 1994), 84–100. 62. On female labor force participation in Detroit, see Table 9.1 above. There is an enormous literature on female networks in urban America. The work of John R. Logan and Harvey Molotch, Urban Fortunes: The Political Economy of Place (Berkeley and Los Angeles: University of California Press, 1987), 106–7, cites recent sociological literature on women’s networks in recent America; for a longer-term historical view, see Christine Stansell, City of Women: Sex and Class in New York, 1780–1860 (New York: Knopf, 1986). 63.

These defended neighborhoods had several important characteristics in common. All of them had predominantly blue-collar populations with median incomes slightly above the city average (Table 9.1). Skilled workers were overrepresented in each neighborhood: all had above-average percentages of craftsmen. Defended neighborhoods also had lower rates of female labor force participation than the city as a whole. The neighborhoods were bastions of single-family homeownership. With the exception of the Lower West Side, the percentage of owner occupancy far exceeded the citywide average. The residential architecture in these communities was undistinguished. Most homes were modest two- or three-bedroom bungalows of frame construction, built in the 1920s and 1940s, crowded together on forty-foot lots.

Young people coming of age in Detroit in the mid- and late 1950s and 1960s faced a very different economic world from that of the previous generation. A black male in Detroit in 1945 or 1950 could realistically expect factory employment, even if his opportunities were seriously limited by discrimination. Blacks continued to suffer levels of unemployment disproportionate to those of Detroit residents in general, although labor force participation rates fluctuated with economic cycles. Still, even in the most flush of times, somewhere close to 10 percent of Detroit’s black population was unemployed. Over the next three decades, with the exception of a cyclical boom in automobile employment in the mid- and late 1960s, few could rely on steady employment.

pages: 541 words: 173,676

Generations: The Real Differences Between Gen Z, Millennials, Gen X, Boomers, and Silents—and What They Mean for America's Future
by Jean M. Twenge
Published 25 Apr 2023

Technology played a role in this shift; fewer jobs required the type of physical labor where men had an advantage, and more jobs involved service and office work, where women were just as capable as men, if not more so. Figure 2.2: Percent of U.S. women working, by marital status and age of children, 1925–1980 Source: U.S. Bureau of Labor Statistics Notes: Percent is labor force participation within each group. In earlier years, statistics for women with children are only available broken down by marital status; married women are shown as they are the largest marital status group of women with children. However, women’s growing participation in the workforce in the 1950s and 1960s hid a stark truth.

The ability to take even unpaid time off to care for a new child without losing a job was not mandated until 1993, with the Family and Medical Leave Act. The huge increase in employment among women with children (see Figure 3.21) was not met with a systematic solution for childcare in the U.S.—it was every family for themselves. (And in many ways it still is, likely one reason why the labor force participation rate of women flattened out after the 1990s). Figure 3.20: Percent of U.S. Congress members who are women, by chamber, 1915–2021 Source: Official website of the U.S. Congress Notes: Includes nonvoting members for Washington, D.C., and the U.S. territories. Includes any member serving during the term.

They have lost control over their lives, and no prestigious business card can compensate for the loss.” These were Boomer gender roles in the 1980s: The media’s exhortation for mothers to quit their jobs was implied rather than explicit, but it was still there. Quindlen described it as “a lifetime spent with winds of sexual change buffeting me this way and that.” Figure 3.21: Labor force participation rate (percent of women working), U.S., all women and by marital status and age of children, 1960–2021 Source: Current Population Survey, U.S. Census Bureau The patchwork nature of dual career couples’ childcare arrangements soon reached the national stage. When Bill Clinton entered office in 1993, he wanted to appoint the first female U.S. attorney general.

pages: 215 words: 69,370

Still Broke: Walmart's Remarkable Transformation and the Limits of Socially Conscious Capitalism
by Rick Wartzman
Published 15 Nov 2022

“You hate to see a company self-destruct, but there are other places to go.” Walmart’s troubles stemmed from outside forces, as well as its own blunders. The US economy, still making its way back from the Great Recession of 2007–2009, had been sluggish for years. The unemployment rate would remain over 7 percent for most of 2013. Labor force participation was low and poverty high. Gasoline prices were surging and payroll taxes rising, hitting households right in the pocketbook. “It’s a train wreck for 80 percent of the American people, and Walmart sells to that 80 percent,” retail consultant Howard Davidowitz said. Dollar stores were siphoning the most budget-conscious consumers.

Rather than put out an assortment of living wages, which vary according to whether someone is single with no kids or a breadwinner in a household with dependents, For US uses one benchmark: what it takes to achieve “a decent standard of living” for a home with two children and two adults—one who works full time and the other who works about three-quarters time (a figure derived from rates for labor force participation and part-time employment). Included in its formula are the cost of housing, food, transportation, health insurance, out-of-pocket medical costs, taxes, retirement savings, childcare, other necessities, and a 5 percent margin for unexpected events. Locking in on this four-person measure wasn’t arbitrary.

pages: 402 words: 126,835

The Job: The Future of Work in the Modern Era
by Ellen Ruppel Shell
Published 22 Oct 2018

Current Issues in Economics and Finance (Federal Reserve Bank of New York) 20, no. 1 (2014), https://www.newyorkfed.org/​medialib­rary/​media/​research/​current_issues/​ci20-1.pdf. the United States had the lowest Maximiliano Dvorkin and Hannah Shell, “A Cross-Country Comparison of Labor Force Participation,” Economic Synopses (St. Louis Fed), no. 17 (2015), https://research.stlouisfed.org/​publications/​economic-synopses/​2015/​07/​31/​a-cross-country-comparison-of-labor-force-particip­ation. the United States lagged behind Poland “Employment Rate by Age Group,” OECD Data, Organisation for Economic Co-operation and Development, last modified 2016, https://data.oecd.org/​emp/​employment-rate-by-age-group.htm#indicator-chart.

Workers Testing Positive for Illicit Drugs,” Wall Street Journal, September 15, 2016, https://www.wsj.com/​articles/​greater-share-of-u-s-workers-testing-positive-for-illicit-drugs-1473901202. More recently, in testimony on the impact of opioid abuse before the Senate Banking Committee in July 2017, then Federal Reserve chair Janet Yellen opined, “I do think it is related to declining labor force participation among prime-age workers. I don’t know if it’s causal or if it’s a symptom of long-running economic maladies that have affected these communities and particularly affected workers who have seen their job opportunities decline.” Jeanna Smialek, “Yellen Says Opioid Use Is Tied to Declining Labor Participation,” Bloomberg.com, July 13, 2017, https://www.bloomberg.com/​news/​articles/​2017-07-13/​yellen-says-opioid-use-is-tied-to-declining-labor-participa­tion.

pages: 242 words: 73,728

Give People Money
by Annie Lowrey
Published 10 Jul 2018

one in three stay-at-home moms: D’Vera Cohn and Andrea Caumont, “7 Key Findings About Stay-at-Home Moms,” FactTank (blog), Pew Research Center, Apr. 8, 2014. 5 percent drop in employment: So Kubota, “Child Care Costs and Stagnating Female Labor Force Participation in the US” (white paper, Princeton University, July 9, 2017). the United States’ female labor participation rate: Eleanor Krause and Isabel Sawhill, “What We Know and Don’t Know About Declining Labor Force Participation: A Review” (Washington, DC: Brookings Institution, May 17, 2017). the United States’ fastest-growing job: Karsten Strauss, “Predicting the Fastest-Growing Jobs of the Future,” Forbes, Nov. 7, 2017.

pages: 319 words: 75,257

Trumpocalypse: Restoring American Democracy
by David Frum
Published 25 May 2020

Flashpoint: The gaps between city and country are widening fast. “Rural America is the new inner city,” the Wall Street Journal proclaimed in May 2017. In terms of poverty, college attainment, teenage births, divorce, death rates from heart disease and cancer, reliance on federal disability insurance and male labor-force participation, rural counties now rank the worst among the four major U.S. population groupings (the others are big cities, suburbs and medium or small metro areas).5 No progress was made in Trump’s first two years in bringing broadband Internet to the 39 percent of rural Americans who lacked it. Net farm income peaked in 2013 at $136 billion.

Trump and, 125 politicization of, 36–37 voting rights and, 81 Kavanaugh, Brett, 80, 109 Keillor, Garrison, 117 Kemp, Brian, 79 Kennedy-McCain immigration bill, 129 Kentucky, 138, 184 Khamenei, Ayatollah, 172 Kim Jong-un, 48 King, Martin Luther, 99 King, Steve, 136–137 Kipling, Rudyard, 192 Krauthammer, Charles, 179–80 Kundera, Milan, 67 Kurds, 3, 17, 94–96, 169 Kushner, Jared, 26–27, 44, 88 Laden, Osama bin, 95–97 Lasseter, John, 117 Las Vegas, 83 mass shootings, 55 Lauer, Matt, 117 Law and Justice Party (Poland), 66 law enforcement, reforming, 125–27 Lebanon, 173 Legan, Santino William, 57 Leibniz, 157 Lengyel, Joseph, 93 Levin, Mark, 150 libertarians, 134 Libya, 43 Lieberman, Joe, 85 life expectancy, 13, 131–32 Limbaugh, Rush, 34, 75 Lincoln, Abraham, 17, 19–20, 199 lobbyists, 35, 102, 127, 190 Loesch, Dana, 59 Logan, John, 187–88 Lord, Jeffrey, 176 Los Angeles, 83 Louis C.K., 117 Louisiana, 80, 122–23, 187 Louis XIV, King of France, 98 lynching, 117–18 Maine, 76, 118 Malaysia, 160 Manafort, Paul, 31–32 Mansfield, Harvey C., 82 manufacturing, 12, 102 Mar-a-Lago, 26 Marciano, Paul, 117 Marine Corps, 92–93, 101 Marist Institute, 110 marriage, 13–14, 148 Maryland, 83, 117 masculinism, 65 Massachusetts, 117, 129 mass shootings, 53–58 Mateen, Omar, 54–55 Mattis, James, 88, 93, 100–101, 165, 174 McCabe, Andrew, 125 McCain, John, 19, 73, 183 McConnell, Mitch, 121 McGahn, Don, 85, 90 McKenzie, Frank, 97 media, 15, 67, 189–91, 194 Medicaid, 132–33, 138 Medi-Cal, 144 Medicare, 112, 130, 133–35, 142, 148 Medicare for All, 106, 118, 130, 134 men labor-force participation and, 13 political attitudes, 14 sexual anger and, 5, 65–66 #MeToo movement, 117 Mexico, 46, 108, 145–46, 159, 178–79 border wall and, 21–22 NAFTA/USMCA and, 178 Michigan, 75–76, 78, 186 Middle East, 157, 171–74 “Might Is Right” (racist tract), 57 Milano, Alyssa, 117 military, 90–94, 100–101, 165, 191 parade and, 90–91 spending, 133, 165 Military Times, 91, 93 Milley, Mark, 92 Ming dynasty, 156 Minnesota, 76 misogyny, 57, 65–66, 118 Mississippi, 80, 121–23 Missouri, 137 Mitchell, John, 125 Monmouth polls, 139 Montenegro, 63 Moonves, Les, 117 Morocco, 172 Morris, Gouverneur, 98 Moynihan, Daniel Patrick, 131 Mueller, Robert, 1, 29–33, 59, 125 Mulvaney, Mick, 189 Muslims, 51, 54, 61, 63–64, 179 Mussolini, Benito, 86 Naipaul, V.S., 18 Napoleon, 65 National Enquirer, 109 National Guard, 93 nationalism, 50–51, 62–63, 196 National Lynching Memorial, 117 National Oceanographic and Atmospheric Administration (NOAA), 126 National Rifle Association (NRA), 59, 61 National Security Agency (NSA), 45 National Security staff, 88, 96–97 Navajo Generating Station, 118 Naval Operations Chief, 92 Nazism, 64, 145 NBC, 24, 59 Nebraska, 184 Neller, Robert, 92 Netherlands, 133 Never Trumpers, 90 New Black Panthers, 69 New Hampshire, 76 New Jersey, 75 New Orleans, 80 Newton, Isaac, 157 New York City, 83, 163 New York magazine, 109 New York State, 75, 118, 184–86 New York Times, 41, 43, 46, 61, 65, 95, 102, 111, 118, 194 New Zealand, 55–56, 162, 177 Nicaragua, 108 Nixon, Richard, 62, 82, 85, 99–100, 105, 125, 198 No Child Left Behind Act (2002), 140 Nolte, John, 149 Noonan, Peggy, 196 Norquist, Grover, 196 North American Free Trade Agreement (NAFTA), 41, 112, 178 North Atlantic Treaty Organization (NATO), 45, 63, 93–94 North Carolina, 76, 78, 80, 123 North Dakota, 122, 164 Northeastern University, 55 North Korea, 44–46, 48–49, 169, 171–72 nuclear energy, 164, 166–67 nuclear weapons, 93–94, 180 Oak Ridge nuclear complex, 167 Obama, Barack, 12, 15, 64, 130–31, 136, 178, 183, 196–97 ACA and, 134–35 bin Laden and, 95–96 China and, 177 climate change and, 152 elections of 2010 and, 79 foreign policy and, 171, 179 immigration and, 21, 24, 106 Iran and, 172 Islamic world and, 53–54, 179 Obama, Michelle, 26 Ocasio-Cortez, Alexandria, 147, 167 oceans, 155–56 Office of Management and Budget (OMB), 102 offshore tax havens, 102, 174 Ohio, 78, 82–83 oil and gas (fossil fuels), 42, 94, 127, 150, 153–56, 161, 163–64 One American News Network (OANN), 15 O’Neill, Brendan, 149 O’Neill, Tip, 127 Orbán, Viktor, 67, 69, 143 Oregon, 118 O’Reilly, Bill, 15 Organization for Economic Cooperation and Development, 132 Ornstein, Norman, 77 Owens, Candace, 64 Paddock, Stephen, 55 Pakistan, 88–89, 95, 173–75, 180 Palestine Liberation Organization (PLO), 60 Palin, Sarah, 83, 84 Panama, 45, 108 Paris Bastille Day parade, 90–91 Paris climate accords, 41, 162 Parnas, Lev, 89, 190 Patriot Prayer, 60 Pegler, Westbrook, 83 Pence, Mike, 4, 26, 35, 63 Pennsylvania, 82–83, 118, 186 Perkins, Tony, 3, 75 Perón, Eva, 18 pharmaceutical companies, 133 Philadelphia, 184, 186 Philippines, 44–45, 146 Pierce, William, 60 Pittsburgh, 186 synagogue shooting, 56, 61 plastics, 118, 156, 160 Playboy, 49 Poland, 50, 66–67, 89, 93, 193 polarization, 15, 130–31, 137–38, 187 political correctness, 15, 110 poll taxes, 71 pollution, 159–61 Pompeo, Michael, 47, 171 population distribution, 75–79, 83, 121–22 Prager, Dennis, 149 progressives, 107–8, 110–13 protectionism, 3, 50, 161 Proud Boys, 60–61 public schools, 136–37, 140–41 Pulse nightclub shootings, 53–55 Putin, Vladimir, 3, 32–33, 44, 48, 63–64, 89, 176, 197 QAnon, 34 Quartz, 156 race and racism, 5–6, 43, 56–58, 62–63, 65–66, 107, 111–12, 127, 140–41, 191 voting and, 71, 80–81 Reagan, Ronald, 18, 39, 51, 62, 105–6, 181, 191 real estate, 120 recessions, 12, 127, 144 recycling, 159–60 red flag laws, 117 redistricting, 84 red meat consumption, 163 reform, recommendations for consensus and, 118–19 DC statehood and, 122–23 filibuster and, 120–22 gerrymandering and, 124–25 law enforcement and, 125–26 presidential tax returns and, 119–20 regulation, 127, 188 Reid, Harry, 121 Republican National Convention 2008 (St.

pages: 267 words: 72,552

Reinventing Capitalism in the Age of Big Data
by Viktor Mayer-Schönberger and Thomas Ramge
Published 27 Feb 2018

Is this the advent of a “second machine age”—the neat phrase to describe the coming displacement through automation of white-collar jobs coined by MIT professors Erik Brynjolfsson and Andrew McAfee? It is likely, as we suggested in Chapter 6, that there will be less work for humans in the future; but no matter what happens to overall labor force participation, it is almost certain that the types of jobs available will be quite different from the jobs people hold today. The situation is actually even more dramatic when we look not just at the number of people participating in the workforce but also at the amount of the nation’s income allocated to worker and employee compensation.

middle-income desk jobs that… will disappear: Michael Chui, James Manyika, and Mehdi Miremadi, “Where Machines Could Replace Humans—and Where They Can’t (Yet),” McKinsey Quarterly (July 2016), http://www.mckinsey.com/business-functions/digital-mckinsey/our-insights/where-machines-could-replace-humans-and-where-they-cant-yet. labor force has declined from its peak: The participation rate in 2017 was around 63 percent, down from over 67 percent in 2000, and below the level it had been in more than three decades; see U.S. Bureau of Labor Statistics, Labor Force Participation Rates, data sets and graphs available at https://data.bls.gov. forecast depressing employment figures: Erik Brynjolfsson and Andrew McAfee, The Second Machine Age: Work, Progress, and Prosperity in a Time of Brilliant Technologies (New York: W. W. Norton, 2016); Carl Benedikt Frey and Michael A.

pages: 563 words: 136,190

The Next Shift: The Fall of Industry and the Rise of Health Care in Rust Belt America
by Gabriel Winant
Published 23 Mar 2021

Although the labor market picked up in the mid-1960s, as the effects of the Kennedy administration tax cut carried the industry into the Vietnam War boom in steel orders, the unemployment rate was still back at nearly 5 percent by 1967—the third-highest of all major metropolitan areas in the booming mid-1960s. Even in this moment of temporary respite, Black unemployment stood at 16 percent; in 1968, Pittsburgh’s Black unemployment rate surpassed that of all other major cities, including Newark, Detroit, and St. Louis. Moreover, the region’s labor force participation rate, 54 percent, was among the lowest in the country. This figure was a combined product of the low rate of women’s workforce participation, the gradual ejection of Black men from industrial work, the overall aging of the workforce, and the departure of the young—all related to steel’s long-term prevalence and slow decline.12 Job loss was racialized because it tracked the industrial workplace’s internal labor market hierarchy.

In 1976, the poverty rate in the Pittsburgh area was 6.7 percent; by 1983, it had more than doubled to 13.8 percent. When the unemployment rate in 1983 for the Pittsburgh metropolitan area peaked at 17 percent overall, it reached a Depression-like 25.6 percent for Black workers. Men were unemployed at a rate of 18 percent, women at 11 percent. These numbers included only those looking for work. Labor force participation, however, also lagged well below national levels, meaning that the balance in Pittsburgh was, in relative terms, tilted away from work and toward forms of collective dependency for working-class survival—on family and state support or illicit and informal means of survival. Even those lucky thousands still working in what was left of the steel mills by 1983 found themselves forced to accept outright wage reductions in the new contract, after initially rejecting a concessionary agreement at the end of 1982.

With the decline of the steel industry, however, the gendering of care work intersected with another equally powerful compulsion: economic need. While the long, slow decline of steel employment had taken a steady toll on Black working-class families for decades—creating a well-established pattern of labor force participation for Black women—things had gotten dire enough to push large numbers of displaced white women into work only in the final spasm of the steel industry. As a 1986 proposal for recruiting home health aides put it, “The displaced homemaker is tailor-made for the homemaker / home health aide position and could be said to have been in training for the position for years.

pages: 280 words: 83,299

Empty Planet: The Shock of Global Population Decline
by Darrell Bricker and John Ibbitson
Published 5 Feb 2019

There is a special relationship between a wife and a mother-in-law.” With few benefits, wage policies that punish women who take maternal leave, and social norms that let men get away with doing less work, you might think Japanese and Korean women would stay home and make babies. But they don’t. Labor force participation by Japanese and Korean women is lower, but not that much lower, than for non-Asian developed countries: 49 percent for Japan and 50 percent for Korea, compared to 56 percent for the United States and 55 percent for Germany.144 With little support from the state, the employer, or the husband, and yet determined to work (and probably needing the money), many Asian women put off having babies until they’re almost out of time.

The United Nations estimate is 1.2. 139 Kelsey Chong, “South Korea’s Troubled Millennial Generation,” BerkeleyHaas, 27 April 2016. http://cmr.berkeley.edu/blog/2016/4/south-korea/#fn4 140 Ibid. 141 Ibid. 142 Garnova, “Japan’s Birthrate.” 143 Takao Komine, “Effective Measures to Halt Birthrate Decline,” Discuss Japan (Japan Foreign Policy Forum, Vol. 22, undated). http://www.japanpolicyforum.jp/pdf/2014/no22/DJweb_22_eco_01.pdf 144 “Labor Force Participation Rate: Female,” Data (Washington, D.C.: World Bank, 2016). http://data.worldbank.org/indicator/SL.TLF.CACT.FE.ZS 145 “Mother’s Mean Age at First Birth,” World Factbook (Washington, D.C.: Central Intelligence Agency, 2017). https://www.cia.gov/library /publications/the-world-factbook/fields/2256.html 146 “S.

pages: 590 words: 153,208

Wealth and Poverty: A New Edition for the Twenty-First Century
by George Gilder
Published 30 Apr 1981

There was some problem of motivation or psychology, and like most such problems it originates not at the job but in the family, specifically with their wives, a group that suffered far less from credentialism. Black women in 1957 had substantially higher IQs, more years in school, more college degrees, and much lower labor force participation than black men. During the next twenty years, they increased their labor force participation by 40 percent. At the same time, they improved their median incomes, occupational status, and penetration of high-level positions at a rate more than three times as fast as black men did. Beginning with incomes around 50 percent of the incomes of black men and 57 percent of the incomes of white women, black women ended the period by earning more than 80 percent of black male incomes and 99 percent of the white female level.15 In the class of blacks represented by the leading male earners of 1957, black women increased their number of college faculty positions by a factor of four, to a level just 15 percent below the number of male faculty, and they moved massively into nursing, teaching, and government work.

Credentialism moved through the American work place and entrenched itself ever more deeply in the government bureaucracies where many blacks were employed. This fifties generation had been educated mostly in Southern schools, which were often closed as much as one-third more days than white schools. Most blacks of that generation left high school to work. As teenagers in the late forties, their labor force participation levels were higher and their unemployment rates were lower than those of their white contemporaries. Their long years in the work force were paying off for some of them by the mid-fifties. But they had received far fewer and less intensive years of education. When the mystique of civil rights lured many into government work, they were trapped by civil service in much the way the Irish before them had been trapped by the seductions of patronage.

pages: 843 words: 223,858

The Rise of the Network Society
by Manuel Castells
Published 31 Aug 1996

For Emma Kiselyova-Castells, without whose love, work, and support this book would not exist Figures 2.1 Productivity growth in the United States, 1995–1999 2.2 Estimate of evolution of productivity in the United States, 1972–1999 93 2.3 Growth in trade and capital flows, 1970–1995 2.4 Goods in international trade by level of technological intensity, 1976/1996 2.5 Foreign direct investment 2.6 Cross-border mergers and acquisitions, 1992–1997 2.7 Export shares 2.8 Share of growth from high-tech sector in the United States, 1986–1998 2.9 Declining dividends payments 4.1 Percentage of the United States’ population that is foreign-born, 1900–1994 4.2 Total fertility rates for nationals and foreigners in selected OECD countries 4.3 Index of employment growth by region, 1973–1999 4.4 Part-time workers in employed labor force in OECD countries, 1983–1998 4.5 Self-employed workers in employed labor force in OECD countries, 1983–1993 4.6 Temporary workers in employed labor force in OECD countries, 1983–1997 4.7 Non-standard forms of employment in employed labor force in OECD countries, 1983–1994 4.8 Employment in the temporary help industry in the United States, 1982–1997 4.9 Percentage of working-age Californians employed in “traditional” jobs, 1999 4.10 Distribution of working-age Californians by “traditional” job status and length of tenure in the job, 1999 4.11 The Japanese labor market in the postwar period 4.12 Annual growth of productivity, employment, and earnings in OECD countries, 1984–1998 5.1 Media sales in 1998 for major media groups 5.2 Strategic alliances between media groups in Europe, 1999 5.3 Internet hosts, 1989–2006 5.4 Internet CONE and country code domain names by city worldwide, July 1999 5.5 Internet CONE and country code domain names by city in North America, July 1999 5.6 Internet CONE and country code domain names by city in Europe, July 1999 5.7 Internet CONE and country code domain names by city in Asia, July 1999 6.1 Largest absolute growth in information flows, 1982 and 1990 6.2 Exports of information from the United States to major world regions and centers 6.3 System of relationships between the characteristics of information technology manufacturing and the industry’s spatial pattern 6.4 The world’s largest urban agglomerations (>10 million inhabitants in 1992) 6.5 Diagrammatic representation of major nodes and links in the urban region of the Pearl River Delta 6.6 Downtown Kaoshiung 6.7 The entrance hall of Barcelona airport 6.8 The waiting room at D.E. Shaw and Company 6.9 Belleville, 1999 6.10 Las Ramblas, Barcelona, 1999 6.11 Barcelona: Paseo de Gracia 6.12 Irvine, California: business complex 7.1 Labor force participation rate (%) for men 55–64 years old in eight countries, 1970–1998 7.2 Ratio of hospitalized deaths to total deaths (%), by year, 1947–1987, in Japan 7.3 War deaths relative to world population, by decade, 1720–2000 Tables 2.1 Productivity rate: growth rates of output per worker 2.2 Productivity in the business sector 2.3 Evolution of the productivity of business sectors 2.4 Evolution of productivity in sectors not open to free trade 2.5 Evolution of US productivity by industrial sectors and periods 2.6 Cross-border transactions in bonds and equities, 1970–1996 2.7 Foreign assets and liabilities as a percentage of total assets and liabilities of commercial banks for selected countries, 1960–1997 2.8 Direction of world exports, 1965–1995 2.9 Parent corporations and foreign affiliates by area and country 2.10 Stocks valuation, 1995–1999 4.1 United States: percentage distribution of employment by industrial sector and intermediate industry group, 1920–1991 4.2 Japan: percentage distribution of employment by industrial sector and intermediate industry group, 1920–1990 4.3 Germany: percentage distribution of employment by industrial sector and intermediate industry group, 1925–1987 4.4 France: percentage distribution of employment by industrial sector and intermediate industry group, 1921–1989 4.5 Italy: percentage distribution of employment by industrial sector and intermediate industry group, 1921–1990 4.6 United Kingdom: percentage distribution of employment by industrial sector and intermediate industry group, 1921–1992 4.7 Canada: percentage distribution of employment by industrial sector and intermediate industry group, 1921–1992 4.8 United States: employment statistics by industry, 1920–1991 4.9 Japan: employment statistics by industry, 1920–1990 4.10 Germany: employment statistics by industry, 1925–1987 4.11 France: employment statistics by industry, 1921–1989 4.12 Italy: employment statistics by industry, 1921–1990 4.13 United Kingdom: employment statistics by industry, 1921–1990 4.14 Canada: employment statistics by industry, 1921–1992 4.15 Occupational structure of selected countries 4.16 United States: percentage distribution of employment by occupation, 1960–1991 4.17 Japan: percentage distribution of employment by occupation, 1955–1990 4.18 Germany: percentage distribution of employment by occupation, 1976–1989 4.19 France: percentage distribution of employment by occupation, 1982–1989 4.20 Great Britain: percentage distribution of employment by occupation, 1961–1990 4.21 Canada: percentage distribution of employment by occupation, 1950–1992 4.22 Foreign resident population in Western Europe, 1950–1990 4.23 Employment in manufacturing by major countries and regions, 1970–1997 4.24 Employment shares by industry/occupation and ethnic/gender group of all workers in the United States, 1960–1998 4.25 Information technology spending per worker (1987–1994), employment growth (1987–1994), and unemployment rate (1995) by country 4.26 Main telephone lines per employee (1986 and 1993) and Internet hosts per 1,000 population (January 1996) by country 4.27 Men’s and women’s employment ratios, 15–64 years old, 1973–1998 4.28 Percentage of standard workers in the chuki koyo system of Japanese firms 4.29 Concentration of stock ownership by income level in the United States, 1995 7.1 Annual hours worked per person, 1870–1979 7.2 Potential lifelong working hours, 1950–1985 7.3 Duration and reduction of working time, 1970–1987 7.4 Principal demographic characteristics by main regions of the world, 1970–1995 7.5 Total fertility rates of some industrialized countries, 1901–1985 7.6 First live births per 1,000 women by age group of mother (30–49 years) and by race in the United States, 1960 and 1990 7.7 Comparisons of infant mortality rates, selected countries, 1990–1995 (estimates) Preface to the 2010 Edition of The Rise of the Network Society We live in confusing times, as is often the case in periods of historical transition between different forms of society.

Harvard University Press: Fig. 4.12 “Annual growth of productivity, employment, and earnings in OECD countries, 1984–1998;” data from OECD, compiled and elaborated by Martin Carnoy in the forthcoming Sustaining the New Economy: Work, Family and Community in the Information Age, Cambridge, Mass.: Harvard University Press, Copyright © 2000 by the Russell Sage Foundation. Harvard University Press: Fig. 7.1 “Labor force participation rate (%) for men 55–64 years old in eight countries, 1970–1998,” A. M. Guillemard, “Travailleurs vieillissants et marché du travail en Europe,” Travail et emploi, September 1993, and Martin Carnoy in the forthcoming Sustaining the New Economy: Work, Family and Community in the Information Age, Cambridge, Mass.: Harvard University Press, Copyright © 2000 by the Russell Sage Foundation.

A study conducted in 1999 by the US Labor Department on the profile of new jobs created in the 1990s found that a great majority of the new jobs were in occupations that paid more than the national median wage of $13 an hour.70 According to an OECD study, the variation in percentage in net job creation in 1980–95 for OECD countries, was of 3.3 percent in high-technology sectors, of –8.2 percent in medium-technology sectors, and of –10.9 percent in low-technology sectors.71 Looking into the future, the 1997 Tregouet report, commissioned by the French Senate’s Commission of Finance concluded that “as the information society gains strength, half of the occupations needing to be filled 20 years from now do not yet exist; they will essentially involve adding knowledge and information.”72 Figure 4.3 Index of employment growth by region, 1973–1999 Source: Data from OECD, compiled and elaborated by Carnoy (2000) A fundamental feature characterizing the new labor market of the past two decades is the massive incorporation of women into paid work: the rate of participation of women in the labor force for ages 15–64 increased from 51.1 percent in 1973 to 70.7 percent in 1998, for the United States; from 53.2 to 67.8 percent for the UK; from 50.1 to 60.8 percent for France; from 54 to 59.8 percent for Japan; from 50.3 to 60.9 percent for Germany; from 33.4 to 48.7 percent for Spain; from 33.7 to 43.9 percent for Italy; from 63.6 to 69.7 percent for Finland; and from 62.6 to 75.5 percent for Sweden, the country with the largest women’s labor force participation rate in the world.73 Yet the pressure of this substantial increase in labor supply did not create high unemployment in the US and Japan as it did in some Western European countries. The US, in the midst of a dramatic technological retooling, registered in November 1999 its lowest unemployment rate in 30 years at 4.1 percent.

pages: 332 words: 89,668

Two Nations, Indivisible: A History of Inequality in America: A History of Inequality in America
by Jamie Bronstein
Published 29 Oct 2016

Huston, the United States has become what it once despised: Europeans come to the United States to witness the social distance between rich and poor, to observe homelessness and unendurable poverty, to see a political system of republicanism that elicits either apathy or outright hostility from the majority of its citizens, to research rampant crime and the world’s largest population of prison inmates, to record the antics and frivolities of the inordinately wealthy.2 Despite the growth of labor-force participation by new groups, including women; better access to higher education than at other times in American history; and transfers from the federal government, income and wealth inequality have worsened since 1983, particularly for the bottom 40 percent of the population.3 Members of one family, the heirs to the Walton fortune, had amassed $90 billion in wealth by 2012, the same as the bottom 30 percent of the U.S. population.4 As the Figure I.1 indicates, America’s poorest suffer under a much less progressive tax system than their European counterparts or than Americans in 1960 when payroll taxes, state and local sales taxes, the cap on taxation of incomes for Social Security, and the lower rate assessed on capital gains are all taken into consideration.

A 1974 plan to conduct intelligence testing of children in three Appalachian counties, to see whether mandatory sterilization of the unfit should be recommended, was never put into action due to lack of funds.59 Libertarian political scientist Charles Murray argued that the Great Society was a net negative, and that poverty rates were declining in the postwar period not because of anything the government did but rather because the economy was growing. According to Murray, while poverty rates fell from 33 percent in 1949 to 28 percent by 1952, to 22 percent under Eisenhower and 18 percent by 1964, by the 1970s the Great Society caused these improvements to halt. Murray also claimed that falling labor force participation and marriage rates among the poorest black and white workers were signs of cultural decay fueled by the availability of various forms of income support.60 Economists Martha Bailey and Nicholas Duquette argue that the War on Poverty failed because the programs were, in a sense, too purely targeted; federal funds were not used strategically to build support for Democrats, as had been the case during the New Deal.

The Age of Turbulence: Adventures in a New World (Hardback) - Common
by Alan Greenspan
Published 14 Jun 2007

By 1970, that proportion had doubled, and today those types of jobs account for about one-third of our workforce. An inevitable consequence, then, of the aging of America will be that more of our elderly population will have both the ability and the incentive to work later and later into old age. Workers in their sixties have accumulated many years of valuable experience, so extending labor force participation by just a few years could have a sizable impact on economic output. But there is no getting around it: almost all of the baby-boom generation will have retired by 2030. And their retirement will be unmatched in length by any previous generation. Will those "golden years" be truly golden?

The fact that a greater share of the dependents will be elderly rather than children will put an additional burden on society's resources, as the elderly, per capita, consume a relatively large share of resources, while children consume relatively little. 412 More ebooks visit: http://www.ccebook.cn ccebook-orginal english ebooks This file was collected by ccebook.cn form the internet, the author keeps the copyright. THE W O R L D RETIRES. BUT CAN I T A F F O R D TO? After receding for years, labor force participation among older Americans has edged somewhat higher recently owing to rising pressures on retirement incomes and a growing scarcity of experienced labor.* As I noted earlier, it will no doubt continue to rise. Nonetheless, the most effective way to boost future standards of living, and thereby accommodate the aspirations of both workers and retirees, is to increase the nation's saving and the productiveness of its uses.1" We need significant additional saving in the decades ahead if we are to finance the construction of capital facilities—for example, cutting-edge high-tech plant and equipment—that will produce the additional real resources to ensure that the promised retirement benefits for the baby boomers will be redeemable in real terms.

Given our assumptions and the economy's historical record, it is difficult to imagine the employment rate of the civilian labor force being outside the rather narrow range of 90 to 96 percent (that is, an unemployment rate between 4 and 10 percent). America's fifty-year average is more than 94 percent, with nonrecession years (the assumption for 2030) near 95 percent. Combining labor force participation rates, population projections, a near 5 percent unemployment rate, and a stable workweek yields an annual growth rate in hours worked in the United States through 2030 of 0.5 percent.* The most encouraging aspect of productivity growth is how remarkably stable it has been for the last century and more.

pages: 436 words: 98,538

The Upside of Inequality
by Edward Conard
Published 1 Sep 2016

After comparing geographically distinct U.S. labor markets affected differently by trade, MIT labor economist David Autor concludes: Alongside the heralded consumer benefits of expanded trade are substantial adjustment costs and distributional consequences. These impacts are most visible in the local labor markets in which the industries exposed to foreign competition are concentrated. Adjustment in local labor markets is remarkably slow, with wages and labor-force participation rates remaining depressed and unemployment rates remaining elevated for at least a full decade after the China trade shock commences. Exposed workers experience greater job churning and reduced lifetime income. At the national level, employment has fallen in U.S. industries more exposed to import competition, as expected, but offsetting employment gains in other industries have yet to materialize.27 It is an ominous finding, especially when the trade deficit simultaneously flooded the U.S. economy with offshore savings that businesses could have used to fund new investment.

“Growth in Means-Tested Programs and Tax Credits for Low-Income Households,” CBO Report, Congressional Budget Office, February 11, 2013, https://www.cbo.gov/publication/43934#title0. 35. Carmen DeNavas-Walt and Bernadette D. Proctor, “Income and Poverty in the United States: 2014,” United States Census Bureau, September 2015, http://www.census.gov/content/dam/Census/library/publications/2015/demo/p60-252.pdf. 36. “Civilian Labor Force Participation Rate,” Labor Force Statistics from the Current Population Survey, Bureau of Labor Statistics, accessed September 16, 2015, http://data.bls.gov/timeseries/LNS11300000. 37. Robert Frank, “Darwin, the Market Whiz,” New York Times, September 17, 2011, http://www.nytimes.com/2011/09/18/business/darwin-the-market-whiz.html.

pages: 353 words: 98,267

The Price of Everything: And the Hidden Logic of Value
by Eduardo Porter
Published 4 Jan 2011

The narrative of women’s march into the workplace in the United States is drawn from Betsey Stevenson, “Divorce Law and Women’s Labor Supply,” NBER Working Paper, September 2008; Claudia Goldin, “The Quiet Revolution That Transformed Women’s Employment, Education and Family,” Ely Lecture, American Economic Association Annual Meeting, January 2006; Paul Douglas and Erika Schoenberg, “Studies in the Supply Curve of Labor: The Relation in 1929 Between Average Earnings in American Cities and the Proportions Seeking Employment,” Journal of Political Economy, Vol. 45, No. 1, February 1937, pp. 45-79; Jacob Mincer, “Labor Force Participation of Married Women: A Study of Labor Supply,” in H. Gregg Lewis, ed., Aspects of Labor Economics (Princeton: Princeton University Press, 1962), pp. 63-97. The description of Sandra Day O’Connor’s job search is in Kamil Dada, “Supreme Court Justice Pushes Public Service,” Stanford Daily, April 22, 2008.

Data on increased marriage rates among college graduates come from Justin Wolfers and Betsey Stevenson, “Marriage and Divorce, Changes and Their Driving Forces,” Journal of Economic Perspectives, Vol. 21, No. 2, Spring 2007, pp. 27-52; and Adam Isen and Betsey Stevenson, “Women’s Education and Family Behavior: Trends in Marriage, Divorce and Fertility,” NBER Working Paper, February 2010. Evidence of mothers’ recent change in attitudes toward work is found in Pew Research Center, “Fewer Mothers Prefer Full-time Work,” July 2007; and Sharon R. Cohany and Emy Sok, “Trends in Labor Force Participation of Married Mothers of Infants,” Bureau of Labor Statistics Monthly Labor Review, February 2007 (www.bls.gov/opub/mlr/2007/02/art2abs.htm, accessed 08/08/2010). The data on American fertility are from the Centers for Disease Control and Prevention (www.cdc.gov/nchs/births.htm, accessed 07/18/2010).

pages: 391 words: 97,018

Better, Stronger, Faster: The Myth of American Decline . . . And the Rise of a New Economy
by Daniel Gross
Published 7 May 2012

North Dakota is one of the smallest states by population (about 670,000) and one of the largest geographically, with 70,000 square miles. It had 0.7 unemployed persons for every job opening, compared with 4.25 for the United States at large. In May 2011 the state jobs office had 15,205 listings, up 64 percent from May 2010. In the entire United States the labor force participation rate—the proportion of able-bodied adults between the ages of eighteen and sixty-five who are working or seeking work—was an anemic 64.2 percent. In North Dakota it stood at a high-octane 74 percent.1 But while its citizens are more hardy, friendly, and prone to using the word “shucks” and fishing for walleye than their fellow Americans, North Dakotans aren’t superhuman.

The positions Cavendish is trying to fill are shift work: three twelve-hour days on, followed by two days off, paying anywhere from $12 to $17 per hour. Across the state employers are casting their rods more deeply into the labor pool, and older and disabled workers are able to find opportunities in North Dakota that may be unavailable to them in other states. The labor force participation rate is 74 percent, compared with 62 percent in the country at large. Even at that rate, you can still get good, friendly service at Starbucks. And North Dakota, which exports so much food and energy, is dealing with its labor shortage by importing people. Oil field workers come from out of state for a few weeks at a time, and foreign students have been brought in for fast-food jobs as part of work-exchange programs sanctioned by the government.

pages: 307 words: 96,543

Tightrope: Americans Reaching for Hope
by Nicholas D. Kristof and Sheryl Wudunn
Published 14 Jan 2020

New York City mayor Bill de Blasio told us that he initially advocated universal pre-kindergarten solely to help the children but later realized that this granted a huge boon as well to working parents by providing high-quality childcare. One factor holding back the U.S. economy as a whole is that we have gone from a leader in female labor force participation in 1990 to a laggard (we now rank number 20 out of 22 rich countries), partly because other nations have developed better childcare options. It’s promising that support for early childhood education is bipartisan, with red states like Oklahoma among the leaders. 2. Universal high-school graduation.

WHEN JOBS DISAPPEAR a lifeline: The federal disability program is a lifeline for some but traps other people in perpetual poverty and makes it more difficult for them to return to the labor force when economic conditions or their own circumstances improve. After bottoming out in September 2015, labor force participation rates in the United States have risen, partly because some people who had been on disability returned to work, but they often lose benefits when they do. Federal Reserve chairman Jerome Powell has suggested that people on disability be allowed to work while losing fewer benefits. Another approach would be to give people a holiday so that they could return to the job market without losing disability payments for a certain number of years, or by allowing them to work more hours without facing a penalty.

pages: 463 words: 105,197

Radical Markets: Uprooting Capitalism and Democracy for a Just Society
by Eric Posner and E. Weyl
Published 14 May 2018

This aspect of sluggish economic growth has independent significance because unemployment and low wages cause social and political conflict. Unemployment and misemployment differ from country to country, depending on the treatment of the long-term unemployed. In Europe, unemployment rates have risen, while in the United States, prime-aged males are dropping out of the labor force. For example, the labor force participation rate of prime-aged US men fell from 96% in 1970 to 88% in 2015. In most countries in Europe, unemployment has risen from rates of 4% to 6% midcentury to a persistent 10% or higher rate.12 And it is not only labor that is underused in today’s economy. Recent research indicates that capital assets are misallocated across firms as well, in the sense that capital is not employed by the firms, sectors, or cities that could make most valuable use of it.13 This suggests that reallocating capital and employment from less productive entities to more productive ones could dramatically increase aggregate output.14 Together, the trends of rising inequality and stagnating growth mean that typical citizens in wealthy countries are no longer living much better than their parents did.

In recent years, economists have begun to wonder whether large segments of the population will be unable to find work in an economy that places the most value on technical work that requires advanced education. Recent research suggests that the rise of video gaming is an important cause of the decline in labor force participation among young men.50 Given current attitudes toward such activities, it seems plausible that such young men, some of them Internet trolls or bullies, may have a less than healthy relationship to the broader society. Most people derive a sense of self-worth from making a contribution to society.

pages: 343 words: 101,563

The Uninhabitable Earth: Life After Warming
by David Wallace-Wells
Published 19 Feb 2019

(Simple temperature rise has a robust and negative impact on test taking, too: scores go down when it’s hotter out.) Pollution has been linked with increased mental illness in children and the likelihood of dementia in adults. A higher pollution level in the year a baby is born has been shown to reduce earnings and labor force participation at age thirty, and the relationship of pollution to premature births and low birth weight of babies is so strong that the simple introduction of E-ZPass in American cities reduced both problems, in the vicinity of toll plazas, by 10.8 percent and 11.8 percent, respectively, just by cutting down on the exhaust expelled when cars slowed to pay the toll.

likelihood of dementia in adults: Hong Chen et al., “Living near Major Roads and the Incidence of Dementia, Parkinson’s Disease, and Multiple Sclerosis: A Population-Based Cohort Study,” The Lancet 389, no. 10070 (February 2017), pp. 718–26, https://doi.org/10.1016/S0140-6736(16)32399-6. reduce earnings and labor force participation: Adam Isen et al., “Every Breath You Take—Every Dollar You’ll Make: The Long-Term Consequences of the Clean Air Act of 1970” (National Bureau of Economic Research working paper no. 19858, September 2015), https://doi.org/10.3386/w19858. E-ZPass: Janet Currie and W. Reed Walker, “Traffic Congestion and Infant Health: Evidence from E-ZPass” (National Bureau of Economic Research working paper no. 15413, April 2012), https://doi.org/10.3386/w15413.

pages: 347 words: 103,518

The Stolen Year
by Anya Kamenetz
Published 23 Aug 2022

The older child was ten years old. Bell was just twenty-four, and Black—which is significant because, as outlined in Chapter 6, fully half of Black children are investigated by the state before they turn eighteen. UNEVEN AND STALLED It shocked me to learn that women have made essentially no progress in labor force participation in the twenty-first century. We hit the peak of six in ten women working all the way back in 1999. That year the R&B girl group TLC topped the charts with “No Scrubs,” about an independent woman rejecting an unemployed man. Sociologist Paula England called it in the 2010 paper “The Gender Revolution: Uneven and Stalled”: “Because the devaluation of activities done by women has changed little, women have had strong incentive to enter male jobs, but men have had little incentive to take on female activities or jobs.”

And it was very much a secondary decision—secondary to their husbands’ earnings. And it wasn’t supposed to be for their whole life. It was just something they did for a while. So [Goldin] brings together evidence to talk about how career becomes part of women’s identity. And it coincides with, you know, almost thirty years of undeterred increase in women’s labor force participation.” For three decades, in other words, beginning in the 1970s, women tried to pull ourselves up by our bootstraps, no matter how impossible that might be. We did everything we could to demonstrate dedication to our careers. We caught up to and surpassed men in higher education. We delayed our marriages and had fewer children with the help of legalized birth control and abortion.

pages: 112 words: 30,160

The Gated City (Kindle Single)
by Ryan Avent
Published 30 Aug 2011

The decade that followed, the 2000s, was by some measures America's worst economic performance in a century. The income of the typical American has been stagnating for years. The top 1% of earners control a larger share of national income than at any time since the years immediately prior to the Great Depression. And even before the Great Recession, labor force participation rates for the American economy were falling. The American economy isn't running like it used to. And when it does run, a huge share of the American population doesn't share in the benefits. Something has changed. Something has gone wrong. But what? There's no shortage of potential explanations.

pages: 354 words: 105,322

The Road to Ruin: The Global Elites' Secret Plan for the Next Financial Crisis
by James Rickards
Published 15 Nov 2016

The United States leads the world in higher education and high tech. Yet total jobs in both fields are paltry compared with lost manufacturing jobs in recent decades. Even if one accepts that there will be winners and losers in a global trading system, what happens when the number of winners is few, and the losers are many? The answer is lower labor force participation, lower productivity, stagnant wage gains, and greater income inequality—exactly what the United States has experienced since the 1990s ascent of NAFTA and the WTO. Even if jobs won and lost from trade are comparable in numbers (they’re not), all jobs are not created equal. Certain jobs persist yet go nowhere, and do not drive growth.

In pre-debate, I considered reciting the dismal litany of debt and deficits that undermine America’s future. It would have been easy to list CBO projections on U.S. debt-to-GDP ratios, the coming insolvency of Social Security, pathetic growth in the current recovery compared with robust recoveries from the 1950s to the 1990s, declining labor force participation, stagnant real wages, growing income inequality, and more. These trends are not more of the same as Joffe would have it. These trends are new and threatening. In the event, I took a different, more theoretical approach. I did not posit a long, slow decline. My warning was about instantaneous decline, what I refer to in this book as catastrophic collapse.

pages: 482 words: 117,962

Exceptional People: How Migration Shaped Our World and Will Define Our Future
by Ian Goldin , Geoffrey Cameron and Meera Balarajan
Published 20 Dec 2010

The study concluded that “from the fiscal point of view, the immigration has not been at all a burden on the welfare system. Rather it has contributed to strengthen the fiscal position.” 46 The migrants most likely to generate fiscal burdens are those who are unemployed (i.e., not paying taxes) and drawing on social benefits. In general, labor force participation among foreign-born men actually exceeds that of the native born.47 Those who are more likely to be outside the workforce are women who have migrated through family channels or asylum seekers whose participation in the labor market is limited by law or due to trauma or language barriers. In the UK, levels of inactivity and unemployment vary dramatically from one expatriate group to the next, even if the overall fiscal impacts of migration are “minimal, or at least equal to the contributions made by migrants.”48 Eighty-five percent of Poles and Canadians are employed, whereas around 50 percent of migrants from Pakistan, Iran, and Bangladesh are employed—reflecting the cultural constraints on many female migrants from these countries.49 Furthermore, while about 1 percent of Poles and Filipinos in Britain claim income support, about 39 percent of Somali migrants (many of whom are refugees) do.50 Although their conclusion has been contested as reflecting a static view of migration, a UK House of Lords report noted that “the positive contribution of some immigrants is largely or wholly offset by negative contributions of others.”51 Paradoxically—given public concerns about the potential social burdens they bring—undocumented workers make significant contributions to the public purse.

See also Jews; Jews, historic migration influences Italy: as future migration policy example social impacts of modern migration Italy, historic migration influences: decolonization during mass migration era post-World War II economic boom, trade network development, between world wars Italy, modern regulatory channels: border control technologies economic policy approaches social categories Ivory Coast, economic impacts of modern migration Jamaica Japan: economic impact of modern migration in economic regulatory channel; future migration pressures, in migrant decision-making models Japan, historic migration influences: imperialistic commerce; indentured labor international restriction policies, during mass migration era Jaspers, Karl Jefferson, Thomas Jews: impacts of modern migration in social regulatory channel Jews, historic migration influences: civilization development, diaspora networks during mass migration era refugee policies restrictive policies trade network development Johnson, Albert Johnson, Simon Johnson-Lodge Act Johnson-Reed Immigration Act Johnston, Richard Jordan Kangani system Kazakhstan, in economic regulatory channel, Keeley, Charles Kenya Kerr, William Kindleberger, Charles knowledge development/culture sharing: agricultural communities, civilization developments in closed borders scenario early humans with exploration activity from global trade networks, with war and conquest. See also innovation benefits, modern migration Korea See also South Korea Koslowski, Rey Kuznetsov, Yevgeny labor coercion: human trafficking indenture contracts slavery labor force participation. See economic impacts of modern migration; high-skilled category; low-skilled category Lahav, Gallya languages Laos Latin America. See specific countries Latvia Laughlin, Harry League of Nations Lebanon legal framework objective, future migration policy legal perspectives, free movement .

pages: 399 words: 116,828

When Work Disappears: The World of the New Urban Poor
by William Julius Wilson
Published 1 Jan 1996

The wage gap between low-skilled men and women shrank not because of gains made by female workers but mainly because of the decline in real wages for men. The unemployment rates among low-skilled women are slightly lower than those among their male counterparts. However, over the past decade their rates of participation in the labor force have stagnated and have fallen further behind the labor-force-participation rates among more highly educated women, which continue to rise. The unemployment rates among both low-skilled men and women are five times that among their college-educated counterparts. Among the factors that have contributed to the growing gap in employment and wages between low-skilled and college-educated workers is the increased internationalization of the U.S. economy.

Indeed, Lemann, in an otherwise perceptive article, went so far as to suggest that “every aspect of the underclass culture in the ghetto is directly traceable to roots in the South.” Yet systematic research on poverty and urban migration, including three major studies since 1975, consistently shows that southern-born blacks who have migrated to the North have lower unemployment rates, higher labor-force-participation rates, and lower welfare rates than northern blacks. Kaus refers to the Dash articles when stating that teenage girls in the inner-city ghetto “are often ridiculed by other girls if they remain virgins too long into their teens.” Kaus argues that “once AFDC benefits reach a certain threshold that allow poor single mothers to survive, the culture of the underclass can start growing as women have babies for all the various nonwelfare reasons they have them.”

pages: 389 words: 111,372

Raising Lazarus: Hope, Justice, and the Future of America’s Overdose Crisis
by Beth Macy
Published 15 Aug 2022

And that same chicken-plant manager had since resorted to flying workers in from Puerto Rico, housing them in nearby apartments for nine-month stints. Princeton economist Alan Krueger calculated that, nationally, the rise in opioid prescriptions accounted for 43 percent of the decline in the country’s male labor force participation rate. When he analyzed the correlation between low workforce participation and high opioid prescribing among the nation’s 3,007 counties, Surry County ranked number ten. “When I was growing up, Mount Airy was booming,” said Wendy Odum, fifty-three. “Both parents worked, and I don’t remember everybody being on food stamps because people worked and took pride in it.

the largest employers became: Surry County Economic Development Partnership, “Data and Demographics,” (n.d.), https://www.surryedp.com/surry-county-demographics/. 52 percent of the working-age population had jobs and 500 job openings: Mark Willis, author interview, November 14, 2019. 55 million opioids: “Drilling into the DEA’s pain pill database,” Washington Post, updated January 17, 2022, https://www.washingtonpost.com/graphics/2019/investigations/dea-pain-pill-database/. perniciously entwined: Alan B. Krueger, “Where Have All the Workers Gone? An Inquiry into the Decline of the U.S. Labor Force Participation Rate,” Brookings Papers on Economic Activity (Fall 2017), https://www.ncbi.nlm.nih.gov/pmc/articles/PMC6364990/. foster care went up: Kids Count Data Center, from 2010 to 2019. more than half: Surry County 2020 NC Data Card, NC Child: The Voice for North Carolina’s Children, 2017 data.

pages: 302 words: 112,390

Everyday Utopia: What 2,000 Years of Wild Experiments Can Teach Us About the Good Life
by Kristen R. Ghodsee
Published 16 May 2023

In 1975, the National Preschool Act forced Swedish municipalities to expand the availability of publicly funded childcare, and by 1991 all children between the ages of eighteen months and six years had a guaranteed place in a day care facility as long as both parents studied or worked. Demand for childcare places continued to grow and municipalities could not keep pace—even though the facilities largely paid for themselves through the economic boost resulting from women’s greater labor force participation and increases in local tax revenues. A new law in 1995 obliged all municipalities to ensure that places be made available, “without reasonable delay,” for all Swedish children between one and six in day care centers and for kids between seven and twelve in after-school recreation centers.

Norton, 1980), 127–39. 45 Kollontai, “Working Woman and Mother.” 46 Kollontai, “Working Woman and Mother.” 47 Wendy Goldman, Women State and Revolution: Soviet Family Policy and Social Life, 1917–1936 (Cambridge, UK: Cambridge University Press, 1993), 93. 48 Josie McClellan, Love in the Time of Communism: Intimacy and Sexuality in the GDR (Cambridge, UK: Cambridge University Press, 2011), 65. 49 J. Schmude, “Contrasting Developments in Female Labor Force Participation in East and West Germany Since 1945,” in Women of the European Union: The Politics of Work and Daily Life, ed. M. D. Garcia-Ramon and J. Monk (New York: Routledge, 1996). 50 Susan L. Erikson, “ ‘Now It Is Completely the Other Way Around’: Political Economies of Fertility in Re-unified Germany,” in Barren States: The Population ‘Implosion’ in Europe, ed.

pages: 147 words: 45,890

Aftershock: The Next Economy and America's Future
by Robert B. Reich
Published 21 Sep 2010

.: Economic Policy Institute, 2008), pp. 220–24. 6 More than half of all the money: See Lawrence Bebchuk, “The Growth of Executive Pay,” Oxford Review of Economic Policy 21, no. 2 (2005): 283–303. 7 By 2007, financial and insurance companies: See Bureau of Economic Analysis, National Income and Product Accounts (NIPA) Tables, Section I: Domestic Product and Incomes, “Real Gross Value Added by Industry,” 2009. 8 In 2009, the twenty-five best-paid hedge-fund managers: See AR: Absolute Return + Alpha, annual survey, 2009. 9 in 2007, Ford’s financial division: Securities and Exchange Commission Filings. 10 according to presidential candidate Ronald Reagan: Ronald Reagan campaign address, “A Vital Economy: Jobs, Growth, and Progress for Americans,” October 24, 1980. 11 Moreover, they had no clear memory: See Technology Triumphs, Morality Falters, Section 5: “America’s Collective Memory,” the Pew Research Center for the People and the Press, January 3, 1999. 8. HOW AMERICANS KEPT BUYING ANYWAY: THE THREE COPING MECHANISMS 1 Coping mechanism #1: See U.S. Department of Labor Women’s Bureau, “Labor Force Participation of Women and Mothers,” Historical Data Tables, October 9, 2009 (http://www.bls.gov/opub/ted/2009/ted_20091009.htm). 2 Coping mechanism #2: See U.S. Bureau of Labor Statistics, 2008 American Time Use Survey, “Working and Work Related Activities Tables,” 2008 (http://www.bls.gov/tus/current/work.htm). 3 Coping mechanism #3: See Bureau of Economic Analysis, National Income and Product Accounts Table 2.1, “Personal Income and Its Distribution,” January 29, 2010 (http://www.bea.gov/national/nipaweb/TableView.asp?

pages: 515 words: 132,295

Makers and Takers: The Rise of Finance and the Fall of American Business
by Rana Foroohar
Published 16 May 2016

See William Lazonick, “Cash Distributions to Shareholders (2005–2014) & Corporate Executive Pay (2006–2014), Research Update #2,” Academic-Industry Research Network, August 2015. 3. Ted Berg, Office of Financial Research, “Quicksilver Markets,” March 2015. 4. Labor force participation rate hovered at 62.4 percent in September 2015, below the 1978 level of 62.8 percent. See US Department of Labor, “Economic News Release: Employment Situation Summary,” October 2, 2015; US Department of Labor, “Labor Force Participation Rate,” Statistics from Population Surveys, BLS Data Viewer, online at http://beta.bls.gov/dataQuery. See also Irene Tung, Paul K. Sonn, and Yannet Lathrop, National Employment Law Project, “The Growing Movement for $15,” November 4, 2015. 5.

pages: 466 words: 127,728

The Death of Money: The Coming Collapse of the International Monetary System
by James Rickards
Published 7 Apr 2014

This was pointed out in a classic 1994 article by Princeton professor Paul Krugman called “The Myth of Asia’s Miracle.” This article was widely criticized upon publication for predicting a slowdown in Chinese growth, but it has proved prophetic. Krugman began with the basic point that growth in any economy is the result of increases in labor force participation and productivity. If an economy has a stagnant labor force operating at a constant level of productivity, it will have constant output but no growth. The main drivers of labor force expansion are demographics and education, while the main drivers of productivity are capital and technology.

The core of this working age population, those aged 20–39 years, has already begun to shrink. With this, the vast supply of low-cost workers—a core engine of China’s growth model—will dissipate, with potentially far-reaching implications domestically and externally. Importantly, when labor force participation levels off, technology is the only driver of growth. The United States also faces demographic headwinds due to declining birth rates, but it is still able to expand the labor force 1.5 percent per year, partly through immigration, and it retains the potential to grow even faster through its technological prowess.

Off the Books
by Sudhir Alladi Venkatesh

James and his peers work in short stints. They do not focus on long-term employment, but instead pursue short-term opportunities to gain income, whether legal or illegal. Because they do not look for work at employment and job-training centers, they do not show up in conventional measures of unemployment and labor force participation. Finally, their physical movements span fairly limited geographic areas. Those in Maquis Park rarely leave the city's Southside, and most are recognizable figures—the exceptions being the small migratory population that travels regionally to find seasonal and temporary work in the steel mills, minor league baseball stadiums, and agricultural farms and plants.

Much of the reason for lending to one another, hiring off the books, and solving crimes without the aid of the police is that banks discriminate against the poor, mainstream employers and unions do not do effective outreach to the poor and minorities, and law enforcement does not provide adequate service to the inner city. On the other hand, however meaningful and satisfactory it may be for those involved, this kind of adjustment does little over time to bring about improvement in credit availability, labor force participation, and policing. It does little to leverage more stable and productive relationships with the institutions of the wider world.4 There are many reasons why this partly adaptive, partly efficacious behavior does not lead to social integration in the mainstream through improved relationships with institutional actors.

pages: 420 words: 135,569

Imaginable: How to See the Future Coming and Feel Ready for Anything―Even Things That Seem Impossible Today
by Jane McGonigal
Published 22 Mar 2022

,” Urgent Futures, Institute for the Future, May 6, 2020, https://medium.com/institute-for-the-future/post-COVID-19-futures-what-can-we-build-after-the-global-pandemic-3cac9515ef20. 9 “After the Pandemic: A Deeper Disease,” Institute for the Future, September 15, 2020, https://www.iftf.org/whathappensnext/. 10 Molly Kinder and Martha Ross, “Reopening America: Low-Wage Workers Have Suffered Badly from COVID-19 so Policymakers Should Focus on Equity,” Brookings Institute, June 23, 2020, https://www.brookings.edu/research/reopening-america-low-wage-workers-have-suffered-badly-from-COVID-19-so-policymakers-should-focus-on-equity/; Alyssa Fowers, “Concerns about Missing Work May Be a Barrier to Coronavirus Vaccination,” Washington Post, May 27, 2021, https://www.washingtonpost.com/business/2021/05/27/time-off-vaccine-workers/. 11 Oxfam International, The Inequality Virus: Bringing Together a World Torn Apart by Coronavirus through a Fair, Just and Sustainable Economy (Cowley, Oxford: Oxfam GB, January 2021), https://oxfamilibrary.openrepository.com/bitstream/handle/10546/621149/bp-the-inequality-virus-250121-en.pdf. 12 International Labor Organization, ILO Monitor: COVID-19 and the World of Work, 5th ed., June 30, 2020, https://www.ilo.org/wcmsp5/groups/public/---dgreports/---dcomm/documents/briefingnote/wcms_749399.pdf; Courtney Connley, “Women’s Labor Force Participation Rate Hit a 33-Year Low in January, According to New Analysis,” CNBC Make It, February 8, 2021, https://www.cnbc.com/2021/02/08/womens-labor-force-participation-rate-hit-33-year-low-in-january-2021.html; Catarina Saraiva, “Women Leaving Workforce Again Shows Uneven U.S. Jobs Recovery,” Bloomberg News, May 7, 2021, https://www.bloomberg.com/news/articles/2021-05-07/women-leaving-workforce-again-shows-uneven-u-s-jobs-recovery. 13 Till von Wachter, “Lost Generations: Long-Term Effects of the COVID-19 Crisis on Job Losers and Labour Market Entrants, and Options for Policy,” Fiscal Studies 41, no. 3 (September 2020): 549–90, https://doi.org/10.1111/1475-5890.12247; Kenneth Burdett, Carlos Carrillo-Tudela, and Melvyn Coles, “The Cost of Job Loss,” Review of Economic Studies 87, no. 4 (July 2020): 1757–98, https://doi.org/10.1093/restud/rdaa014. 14 “The Impact of COVID-19 on Student Equity and Inclusion: Supporting Vulnerable Students during School Closures and School Re-openings,” OECD, November 19, 2020, https://www.oecd.org/coronavirus/policy-responses/the-impact-of-COVID-19-on-student-equity-and-inclusion-supporting-vulnerable-students-during-school-closures-and-school-re-openings-d593b5c8/. 15 “UN Report Finds COVID-19 Is Reversing Decades of Progress on Poverty, Healthcare and Education,” United Nations Department of Economic and Social Affairs, July 7, 2020, https://www.un.org/development/desa/en/news/sustainable/sustainable-development-goals-report-2020.html; “America’s Huge Stimulus Is Having Surprising Effects on the Poor,” Economist, July 6, 2020, https://www.economist.com/united-states/2020/07/06/americas-huge-stimulus-is-having-surprising-effects-on-the-poor; Ian Goldin and Robert Muggah, “COVID-19 Is Increasing Multiple Kinds of Inequality.

pages: 455 words: 133,719

Overwhelmed: Work, Love, and Play When No One Has the Time
by Brigid Schulte
Published 11 Mar 2014

Italy: Carla Power, “Staying Home with Mamma,” Newsweek, August 13, 2000, www.thedailybeast.com/newsweek/2000/08/13/staying-home-with-mamma.html; Japan and South Korea: Veerle Miranda, “Cooking, Caring and Volunteering: Unpaid Work Around the World,” OECD Social, Employment, and Migration Working Papers, No. 116 (OECD Publishing, 2011), www.oecd-ilibrary.org/social-issues-migration-health/cooking-caring-and-volunteering-unpaid-work-around-the-world_5kghrjm8s142-en, 13. 32. Mario S. Floro and Hitomi Komatsu, “Labor Force Participation, Gender and Work in South Africa: What Can Time Use Data Reveal?” Journal of Feminist Economics 17, Issue 4, November 3, 2011, www.american.edu/cas/economics/pdf/upload/2011-2.pdf. The “onerous share” of domestic work, the researchers argue, “influences not only women’s availability for labor market work, but also their ability to seek employment, to take up learning, and/or to socialize outside the family.”

Census Bureau, “Married Couple Family Groups, by Labor Force Status of Both Spouses, and Race and Hispanic Origin of the Reference Person: 2012,” table FG1, www.census.gov/hhes/families/files/cps2012/tabFG1-all.xls. 15. Bureau of Labor Statistics, Economic News Release, “Families with Own Children: Employment Status of Parents by Age of Youngest Child and Family Type, 2011–2012 Annual Averages,” April 26, 2013, www.bls.gov/news.release/famee.t04.htm. 16. Sharon R. Cohany and Emy Sok, “Trends in Labor Force Participation of Married Mothers of Infants,” Bureau of Labor Statistics Monthly Labor Review, February 2007, www.bls.gov/opub/mlr/2007/02/art2full.pdf. See Chart 1. 17. Schor, Overworked American, 114. 18. “Gender and Global Differences in Work-Life Effectiveness” (paper presented at the Families and Work Institute/SHRM Work-Life Focus: 2012 and Beyond conference, Washington, D.C., November 8–10, 2011).

pages: 809 words: 237,921

The Narrow Corridor: States, Societies, and the Fate of Liberty
by Daron Acemoglu and James A. Robinson
Published 23 Sep 2019

But what happens when women are abused by their guardians or husbands? One ranking of gender parity by the World Economic Forum puts Saudi Arabia 141 out of 149 countries (the United Arab Emirates, despite its gender equality awards we saw in the Preface, ranks only a little above Saudi Arabia, 121). This ranking combines many things; one is labor force participation, which stands at just 22 percent in Saudi Arabia compared to 56 percent in the United States. The guardianship system and systematic discrimination against women have been consistently upheld by religious authorities. In the 1990s when the Grand Ulama was asked to make a ruling about the appropriateness of a woman’s delaying marriage to finish her university education, it issued a fatwa decreeing that for a woman to progress through university education, which is something we have no need for, is an issue that needs examination.

A nice summary of restrictions on women in Saudi Arabia is on CNN: https://www.cnn.com/2017/09/27/middleeast/saudi-women-still-cant-do-this/index.html. “For a woman,” “God Almighty,” and “deficient reasoning and rationality” from Human Rights Watch (2016); see also Human Rights Watch (2008). Bursztyn, González, and Yanagizawa-Drott (2018) on men’s attitudes to female labor force participation in Saudi Arabia. On the issue of women driving, see https://www.nytimes.com/2017/09/26/world/middleeast/saudi-arabia-women-drive.html. “A grief-stricken Saddam” quoted from Mortimer (1990). Saddam “the banner of jihad and faith” quoted from Baram (2014, 207–208). Platteau (2017) has an incisive analysis of the relationship between Saddam and religion; see also Baram (2014), Helfont (2014), and Dawisha (2009).

“Charting the ‘Rise of the West’: Manuscripts and Printed Books in Europe, A Long-Term Perspective from the Sixth Through Eighteenth Centuries.” Journal of Economic History 69, no. 2: 409–45. Buruma, Ian (2003). Inventing Japan: 1853–1964. New York: Modern Library. Bursztyn, Leonardo, Alessandra González, and David Yanagizawa-Drott (2018). “Misperceived Social Norms: Female Labor Force Participation in Saudi Arabia.” http://home.uchicago.edu/bursztyn/Misperceived_Norms_2018_06_20.pdf. Byrhtferth of Ramsey (2009). “Vita S. Oswaldi.” In Byrhtferth of Ramsey: The Lives of St. Oswald and St. Ecgwine, edited by Michael Lapidge. New York: Oxford University Press. Çağaptay, Soner (2017).

pages: 190 words: 53,409

Success and Luck: Good Fortune and the Myth of Meritocracy
by Robert H. Frank
Published 31 Mar 2016

Recent trends in the distributions of income represent a substantial departure from those observed during the first three decades after WWII, when pretax incomes in America grew at roughly the same rate—slightly less than 3 percent a year—for households up and down the income ladder. Since the late 1960s, this pattern has changed. The inflation-adjusted median hourly wage for American men is actually lower now than it was then. Real median household incomes grew by roughly 19 percent between 1967 and 2012, primarily because of large increases in female labor force participation. Only those in the top quintile, whose incomes have roughly doubled since the mid-1970s, have escaped the income slowdown. Similar, if less dramatic, changes have been observed in most other countries. The income growth picture is much the same within each subgroup of the population as for the population as a whole.

Firefighting
by Ben S. Bernanke , Timothy F. Geithner and Henry M. Paulson, Jr.
Published 16 Apr 2019

Growth in real potential GDP Sources: Congressional Budget Office, “An Update to the Economic Outlook: 2018 to 2028”; authors’ calculations ANTECEDENTS Overall prime-age participation in the labor force had been falling, as the participation of women slowed and men’s continued a decades-long decline. Civilian labor force participation rates for people ages 25–54, indexed to January 1990=100 Source: Bureau of Labor Statistics via Haver Analytics ANTECEDENTS Income growth for the top 1 percent had risen sharply, driving income inequality to levels not seen since the 1920s. Cumulative growth in average income since 1979, before transfers and taxes, by income group Source: Congressional Budget Office, “The Distribution of Household Income, 2014” ANTECEDENTS Meanwhile, the financial system was becoming increasingly fragile.

pages: 585 words: 151,239

Capitalism in America: A History
by Adrian Wooldridge and Alan Greenspan
Published 15 Oct 2018

They are not, in my opinion, going to stop getting married and/or having children. They will fail in their present role as women if they do.”13 Yet these long entrenched attitudes changed with remarkable speed. With the waning of the baby boom in the mid-1960s, women started entering the labor force in growing numbers. The labor force participation rate (LFPR) of “prime age” females (those twenty-five to fifty-four years of age) increased from 44.5 percent in 1964, to 69.6 percent in 1985, to 76.8 percent in 1999. With numbers came quality: women quickly moved up the professional scale and earned higher salaries. The percentage of annual median female wages to male wages jumped from 58 percent in 1975, to 71.6 percent in 1990, to 77.4 percent in 2010, and is continuing to go up, if not as fast as women would like.

Morgan, 94–95, 105, 230, 231, 238, 243 junk bonds, 341–42 just-in-time manufacturing, 314, 344 Kaiser, Henry, 268, 269–70 Kansas City Board of Trade, 120 Katz, Lawrence, 400 Keating-Owen Child Labor Law of 1916, 160 Keller, Morton, 158 Kelly, William, 292 Kennedy, John F., 240, 279–80, 302–3, 363 Kennedy, Joseph, 221 Kensho, 403 Kerkorian, Kirk, 286–87 kerosene, 49, 102–3 Keynes, John Maynard, 174, 218, 227, 229, 279, 294 Keynesianism, 275, 285, 302–3, 309 Kipling, Rudyard, 168–69 Kirkman, Marshall, 137 Kissinger, Henry, 309 Klamer, Arjo, 389, 392 Kleiner, Morris, 414 KnIT (Knowledge Integration Toolkit), 402–3 “knowledge worker,” 281, 360 Koch, Robert, 430 Koch Industries, 391 Kohlberg, Jerome, 341 Kohlberg Kravis Roberts (KKR), 341 Kohrs, Conrad, 115 Kravis, Henry, 341 Kroc, Ray, 293, 390, 443 Kromer, Tom, 224 Kubrick, Stanley, 350 Ku Klux Klan, 89 Kuznets, Simon, 13, 236, 438, 451 labor force participation rate (LFPR), 364 labor strikes, 160, 173–74, 193, 193, 250, 261, 289, 314–15, 327–28 labor unions. See trade unions La Follette, Robert, 245 laissez-faire, 25–26, 163–65, 196, 241 capitalism vs., 165–71 cult of government, 176–79 Lamont, Thomas, 230, 231, 238 Lamoreaux, Naomi, 144, 431–32 Landon, Alf, 248 land surveying, 58 Laski, Harold, 190 Latrobe, Benjamin, 138 Lawrence, William, 163 League of Nations, 232 Lease, Mary Elizabeth, 172 Lebergott, Stanley, 431 Lehman, Henry, Emanuel, and Mayer, 79 Lehman, Herbert, 373–74 Lehman Brothers, 341, 373–74, 378, 381, 385, 444–45 Lenin, Vladimir, 241, 306 leveraged buyouts (LBOs), 340–41 Levi Strauss & Co., 291 Levitt, William and Alfred, 291–92 Levittown, 291–92, 296 Lewis, John L., 261 Lewis, Michael, 338 Lewis, Sinclair, 205–6 Lewis and Clark Expedition, 67 Liberty ships, 269–70 Licence Raj, 376, 414 Licklider, J.

pages: 850 words: 254,117

Basic Economics
by Thomas Sowell
Published 1 Jan 2000

In a free market, low-productivity workers are just as employable at a low wage rate as high-productivity workers are at a high wage rate. During the long era from the late nineteenth century to the mid-twentieth century, when black Americans received lower quantities and lower qualities of education than whites in the South where most lived, the labor force participation rates of black workers were nevertheless slightly higher than those of white workers.{367} For most of that era, there were no minimum wage laws to price them out of jobs and, even after a nationwide minimum wage law was passed in 1938, the wartime inflation of the 1940s raised wages in the free market above the legally prescribed minimum wage level, making the law largely irrelevant by the late 1940s.

Such expressions of overt racial discrimination were both legal and socially accepted in all three countries at that time. The history of black workers in the United States illustrates the point. As already noted, from the late nineteenth-century on through the middle of the twentieth century, the labor force participation rate of black Americans was slightly higher than that of white Americans. In other words, blacks were just as employable at the wages they received as whites were at their very different wages. The minimum wage law changed that. Before federal minimum wage laws were instituted in the 1930s, the black unemployment rate was slightly lower than the white unemployment rate in 1930.{376} But, then followed the Davis-Bacon Act of 1931, the National Industrial Recovery Act of 1933 and the Fair Labor Standards Act of 1938—all of which imposed government-mandated minimum wages, either on a particular sector or more broadly.

Since such people are no longer counted as being in the labor force, their exodus will reduce the unemployment rate, even if the proportion of people without jobs has not been reduced at all. In the wake of the downturn of the American economy in the early twenty-first century, the unemployment rate rose to just over 10 percent. Then the unemployment rate began to decline—as more and more people stopped looking for jobs, and thus dropped out of the labor force. The labor force participation rate declined to levels not seen in decades. Although some saw the declining unemployment rate as an indication of the success of government policies, much of that decline represented people who had simply given up looking for jobs, and subsisted on resources provided by various government programs.

pages: 226 words: 59,080

Economics Rules: The Rights and Wrongs of the Dismal Science
by Dani Rodrik
Published 12 Oct 2015

Kranton Identity Economics: How Our Identities Shape Our Work, Wages, and Well-Being (Princeton, NJ: Princeton University Press, 2010); Alberto Alesina and George-Marios Angeletos, “Fairness and Redistribution,” American Economic Review 95, no. 4 (2005): 960–80; Alberto Alesina, Edward Glaeser, and Bruce Sacerdote, “Why Doesn’t the United States Have a European-Style Welfare State?” Brookings Papers on Economic Activity, no. 2 (2001): 187–254; Raquel Fernandez, “Cultural Change as Learning: The Evolution of Female Labor Force Participation over a Century,” American Economic Review 103, no. 1 (2013): 472–500; Roland Bénabou, Davide Ticchi, and Andrea Vindigni, “Forbidden Fruits: The Political Economy of Science, Religion, and Growth” (unpublished paper, Princeton University, December 2013). 4. Neil Gandal et al., “Personal Value Priorities of Economists,” Human Relations 58, no. 10 (October 2005): 1227–52; Bruno S.

pages: 208 words: 57,602

Futureproof: 9 Rules for Humans in the Age of Automation
by Kevin Roose
Published 9 Mar 2021

Ultimately, my goal is to convince you that it’s possible to become the type of person who has nothing to worry about: a person whose humanity makes them impossible to replace, no matter what AI can or can’t do. You will notice, as you read, that this book focuses more on the micro than the macro. There are no lengthy discussions of productivity measurement or the labor force participation rate, and I don’t have a perfect set of AI policy recommendations to share. Preparing our political and economic institutions for technological change is essential, and lots of experts—including some whose work I’ve included in a reading list at the back of the book—have considered how we might restructure our society for the coming wave of automation.

pages: 221 words: 55,901

The Globalization of Inequality
by François Bourguignon
Published 1 Aug 2012

I have already discussed the way in which economic development can create more inequality before bringing it back down as the modern high-­productivity sector expands and the traditional low-­income sector shrinks. There are also the effects of changing demographics: declining birth rates can improve the standard of living of the poorest members of the population; a rise in the number of single-­parent households or an increase in female labor force participation can substantially modify the distribution of household monetary standards of living in opposite directions; and by pairing people of comparable potential incomes together, a rise in endogamy may contribute to a rise in inequality. The reason that I have not emphasized these dynamics is that they seem relatively independent of globalization and are more The Forces behind R ising Inequality 115 country-­specific than those forces that could potentially affect national inequality levels in general.

pages: 252 words: 60,959

Numbers Don't Lie: 71 Stories to Help Us Understand the Modern World
by Vaclav Smil
Published 4 May 2021

These six measures present quite a spread of values—the official unemployment rate (U-3) was only about half of the most encompassing rate (U-6), which was more than five times as high as the narrowest measure (U-1). If you lose your job, you count as unemployed only if you keep looking for a new one; otherwise, you never get counted again. That is why, when trying to get closer to the “real” unemployment rate, you must look at the labor force participation rate (the number of people available for work as a percentage of the total population), which has recently been in decline. In 1950 the US rate was only about 59 percent, and after mostly rising for half a century it peaked at 67.3 percent during the spring of 2000; the subsequent decline brought it to 62.5 percent by the fall of 2005, and this was followed by a slow rise to 63.2 by the end of 2019.

pages: 526 words: 160,601

A Generation of Sociopaths: How the Baby Boomers Betrayed America
by Bruce Cannon Gibney
Published 7 Mar 2017

Part of this is natural: Households should be wealthier as they get older, but the striking thing is how the dynamics of old vs. young mirror the much more politically prominent dynamic of rich vs. middle class.12 The Many Flavors of Unemployment The recovery since 2008 has been one of the weakest and slowest recorded, so fragile and with so much risk of reversal that it hardly seems a recovery at all, notwithstanding the perky jobs reports the Obama administration routinely issued. We have already seen that the official unemployment rate, which hovered around 5 percent in Obama’s last year, has been driven in part by declining labor force participation. The official unemployment rate is called “U-3,” and measures total unemployed, but counts only those without jobs who are still looking for work—not the permanently discouraged or the underemployed, two categories of increasing importance in the recent and iffy recovery.*,13 Broader measures of unemployment offer a less heartening picture, one that squares more easily with the rage of certain populists (the Trumpenproletariat and unreconstructed Bernie fanatics, e.g.).

The problem will get worse given that Boomers will be selling their homes roughly simultaneously, to say nothing of the negative effects of higher mortgage rates or property tax reforms, should those ever come to pass. By facilitating reverse mortgages, the government has again used the credit of younger taxpayers to subsidize the elderly. * The data on women is less robust due to their lower labor force participation in earlier decades; it has been rising, but they still retire slightly earlier than men (62 versus 64 in 2011) and, being longer lived, their retirements are even more extended. * Especially if there are gaps between discount rates and cost-of-living adjustments. * The S&P’s annualized returns, assuming all dividends were reinvested, were under 5 percent from 2000 to 2015, and for much of 2000 to 2010, they were actually negative.

pages: 245 words: 64,288

Robots Will Steal Your Job, But That's OK: How to Survive the Economic Collapse and Be Happy
by Pistono, Federico
Published 14 Oct 2012

http://economix.blogs.nytimes.com/2011/08/05/private-sector-up-government-down/ 4 Jobs Deficit, Investment Deficit, Fiscal Deficit, Laura D’Andrea Tyson, 2011. The New York Times. http://economix.blogs.nytimes.com/2011/07/29/jobs-deficit-investment-deficit-fiscal-deficit/ 5 The Employment Situation, 2012. Bureau Of Labor Statistics http://www.bls.gov/news.release/pdf/empsit.pdf 6 Civilian Labor Force Participation Rate. Bureau of Labor Statistics. http://data.bls.gov/timeseries/LNS11300000 7 Race Against The Machine: How the Digital Revolution is Accelerating Innovation, Driving Productivity, and Irreversibly Transforming Employment and the Economy, Erik Brynjolfsson and Andrew McAfee, 2011. Digital Frontier Press.

pages: 222 words: 70,132

Move Fast and Break Things: How Facebook, Google, and Amazon Cornered Culture and Undermined Democracy
by Jonathan Taplin
Published 17 Apr 2017

Graeber notes, “Huge swaths of people, in Europe and North America in particular, spend their entire working lives performing tasks they believe to be unnecessary. The moral and spiritual damage that comes from this situation is profound. It is a scar across our collective soul. Yet virtually no one talks about it.” This is not a world any of us wants to live in, let alone work in. Already in the United States we know that the labor-force participation rate for men between the ages of twenty-five and fifty-four who have only a high school diploma is at historic lows as this chart demonstrates. The only way out of this crisis—to realize Andreessen’s vision of six billion people dabbling in art, science, and culture—is to have some version of a universal basic income (UBI), free health care, and a deep reduction in the length of the workday.

pages: 232 words: 70,361

The Triumph of Injustice: How the Rich Dodge Taxes and How to Make Them Pay
by Emmanuel Saez and Gabriel Zucman
Published 14 Oct 2019

Although it is difficult to quantify the economic effects of a healthier and more educated workforce, the evidence suggests that the effect on growth would be positive. Freed of the risk of losing their employer-provided health insurance, more people might start businesses. More college graduates would boost productivity. Universal child care would increase women’s labor force participation. In turn, higher incomes would increase tax collection, eventually reducing the government deficit. If a 6% national income tax was used to fund health care, here is how it would work. A rate of 4.5% would be enough to fund standard health insurance covering all medical needs for all workers who currently pay contributions through their employers.

pages: 270 words: 71,659

The Right Side of History
by Ben Shapiro
Published 11 Feb 2019

CHAPTER 9: THE RETURN TO PAGANISM 1.Voltaire, “Jeannot and Colin,” in The Oxford Magazine, volume I (1768), 190 2.Frank Newport, “Five Key Findings on Religion in the US,” Gallup.com, December 23, 2016, http://news.gallup.com/poll/200186/five-key-findings-religion.aspx. 3.Thomas E. Woods Jr., “Race, Inequality, and the Market,” FEE.org, October 1, 2002, https://fee.org/articles/race-inequality-and-the-market/. 4.“Changes in Women’s Labor Force Participation in the 20th Century,” U.S. Bureau of Labor Statistics, February 16, 2000, https://www.bls.gov/opub/ted/2000/feb/wk3/art03.htm. 5.Donald M. Fisk, “American Labor in the 20th Century,” U.S. Bureau of Labor Statistics, January 30, 2003, https://www.bls.gov/opub/mlr/cwc/american-labor-in-the-20th-century.pdf. 6.Fred Siegel, The Revolt against the Masses (New York: Encounter Books, 2013), 112–13. 7.Giuseppe Fiori, Antonio Gramsci: Life of a Revolutionary (New York: Schocken Books, 1973), 103. 8.Max Horkheimer, Critical Theory: Selected Essays (New York: Continuum, 2002), 207. 9.Rolf Wiggershaus, The Frankfurt School: Its History, Theories, and Political Significance (Cambridge, MA: MIT Press, 1995), 135. 10.

pages: 233 words: 65,893

Slow Productivity: The Lost Art of Accomplishment Without Burnout
by Cal Newport
Published 5 Mar 2024

These included Celeste Headlee’s Do Nothing, Anne Helen Petersen’s Can’t Even, Devon Price’s Laziness Does Not Exist, and Oliver Burkeman’s delightfully sardonic Four Thousand Weeks. This exhaustion with work was also reflected in multiple waves of heavily reported social trends that crested one after another during the pandemic. First there was the so-called Great Resignation. Though this phenomenon encompassed retreats from labor force participation in many different economic sectors, among these many sub-narratives was a clear trend among knowledge workers to downgrade the demands of their careers. The Great Resignation was then followed by the rise of quiet quitting, in which a younger cohort of workers began to aggressively push back on their employers’ demands for productivity.

pages: 232

Planet of Slums
by Mike Davis
Published 1 Mar 2006

Instead, deindustrialization and the decimation of male formal-sector jobs, often followed by male emigration, compelled women to improvise new livelihoods as piece-workers, liquor sellers, street vendors, lottery ticket sellers, hairdressers, sewing operators, cleaners, washers, ragpickers, nannies, and prostitutes. In a region where urban women's labor-force participation had always been lower than in other continents, the surge of Latin American women into tertiary informal activities during the 1980s was especially dramatic. In her detailed study of "adjustment from below," social anthropologist Caroline Moser describes the impact of eight successive SAPs between 1982 and 1988 on a formerly upwardly mobile shantytown on the swampy edge of Guayaquil.

pages: 283 words: 73,093

Social Democratic America
by Lane Kenworthy
Published 3 Jan 2014

In music, the “album” originated in the late 1940s, and rock ‘n’ roll began in the 1950s. Other innovations that made life easier or more pleasurable include photocopiers, disposable diapers, and the bikini. The Civil Rights Act of 1964 outlawed gender and race discrimination in public places, education, and employment. For women, life changed in myriad ways. Female labor force participation rose from 30 percent in 1940 to 49 percent in 1970. Norms inhibiting divorce relaxed in the 1960s. The pill was introduced in 1960. Abortion was legalized in the early 1970s. Access to college increased massively in the mid-1960s. Comparing these changes in quality of life is difficult, but I see no reason to conclude that the pace of advance, or of innovation, has been more rapid in recent decades than before.66 Yes, there have been significant improvements in quality of life in the United States since the 1970s.

pages: 277 words: 80,703

Revolution at Point Zero: Housework, Reproduction, and Feminist Struggle
by Silvia Federici
Published 4 Oct 2012

The social and economic impact of colonialism varied greatly, depending (in part) on the duration of direct colonial control. We may even interpret the present differences in women’s participation in subsistence and cash-crop agriculture as a measure of the extent of colonial appropriation of land. Using the UN-ILO labor force participation statistics, and remembering the measurement problem concerning subsistence farming, we see that sub-Saharan Africa has the highest percentage of the female labor force in agriculture (75 percent); while in Southern Asia it is 55 percent; South-East Asia, 42 percent; and East Asia, 35 percent.

pages: 241 words: 81,805

The Rise of Carry: The Dangerous Consequences of Volatility Suppression and the New Financial Order of Decaying Growth and Recurring Crisis
by Tim Lee , Jamie Lee and Kevin Coldiron
Published 13 Dec 2019

In 2015, with the Fed having kept the funds rate at close to zero for more than six years, financial commentary and debate was obsessed with the timing of an expected Fed rate increase. Many market participants questioned why interest rates were still at zero given that the financial crisis was long since over—in their opinion. On the other side of the debate, others argued that the US inflation rate was still low and labor force participation levels still weak, so there was no rush to raise interest rates. This type of discussion continues to be couched in the context of a traditional monetary framework; higher short-term interest rates would slow credit demand (and money supply growth), except to the extent that the economy was picking up, and would put downward pressure on inflation unless the economy was strong enough.

pages: 231 words: 76,283

Work Optional: Retire Early the Non-Penny-Pinching Way
by Tanja Hester
Published 12 Feb 2019

For most of human history, people have worked until they died, though that work looked almost nothing like the always-reachable, can’t-get-everything-done work of today. Even in the 21st century, with more economic prosperity than ever before and more people retiring than ever before, many people don’t quit working when they retire. According to the Bureau of Labor Statistics, labor force participation for adults aged 65 to 74 is increasing and will hit 32% by 2022, and 11% for those 75 and older.1 Some of those workers are people who never retired, but many more are folks working “second acts,” jobs that are often part-time and that may feel fun or purposeful. Many other retirees are redefining the term by focusing on volunteering and service, giving their retirements meaning but spending their time in ways that look an awful lot like work.

Cultural Backlash: Trump, Brexit, and Authoritarian Populism
by Pippa Norris and Ronald Inglehart
Published 31 Dec 2018

A wealth of research in sociology, public opinion, and gender studies has documented birth-cohort-linked change in sex role attitudes, in the US and Europe.13 These studies report that a gender gap can be observed among the more egalitarian younger generations, with women’s views shifting further and faster than men’s, due in part to women’s experience of rising educational levels (see Figure 2.4), growing labor force participation, the ideological impact of the second-­wave women’s movement, and declining religiosity and marriage rates. Finally, racial, national, and ethnic identities also predict values. Authoritarian-­ populist rhetoric is closely associated with rejection of the ‘Other,’ directed toward diverse targets – thus heightening racism, Islamophobia, misogyny, homophobia, anti-­Semitism, and ethnocentrism.

Thus, in the 2016 election, the Part II Authoritarian-Populist Values 161 white rural counties in key Mid-­West states such as Pennsylvania and Michigan swung disproportionately toward Trump, while the Democrats performed better in large metropolitan areas and surrounding suburbs.77 Socio-­economic indicators – poverty levels, median earnings, labor force participation, longevity, and unemployment rates – are generally worse in American counties dependent upon farming, mining, and manufacturing than in urban areas.78 Trump also strongly outperformed the Romney vote in counties with severe social and economic problems, including substance abuse, alcoholism, and suicide rates, exemplified by the scourge of soaring white opioid addiction and its devastating effects on local communities.79 Trump performed best in places where the economy was at its worst, beating Clinton in counties with slower job growth and lower wages, and far outperforming her in counties where jobs were most threatened by automation or offshoring.

pages: 309 words: 86,909

The Spirit Level: Why Greater Equality Makes Societies Stronger
by Richard Wilkinson and Kate Pickett
Published 1 Jan 2009

Park, ‘Emulation, inequality, and work hours: was Thorsten Veblen right?’ Economic Journal (2005) 115: F397–F412. 353. D. Neumark and A. Postlethwaite, ‘Relative income concerns and the rise in married women’s employment’, Journal of Public Economics (1998) 70: 157–83. 354. Y. Park, Veblen Effects on Labor Supply: Male earnings inequality increases women’s labor force participation. New London, CT: Department of Economics, Connecticut College, 2004. 355. S. J. Solnick and D. Hemenway, ‘Is more always better? A survey on positional concerns’, Journal of Economic Behavior & Organization (1998) 37: 373–83. 356. T. Veblen, The Theory of the Leisure Class. Oxford: Oxford University Press, 2007. 357.

pages: 285 words: 81,743

Start-Up Nation: The Story of Israel's Economic Miracle
by Dan Senor and Saul Singer
Published 3 Nov 2009

They see it as in their interest as much as anyone else’s,” she said.9 Yet because of the high birth rates in both the haredi and the Arab sectors, efforts to increase workforce participation in these sectors are racing against the demographic clock. According to Israel 2028, the report issued by an official blue-ribbon commission, the haredi and Arab sectors are projected to increase from 29 percent of Israel’s total population in 2007 to 39 percent by 2028. Without dramatic changes in workforce patterns, this shift will reduce labor-force participation rates even further. “The existing trends are working in stark opposition to the desired development,” the report warns.10 As he was campaigning to return to the premiership, Bibi Netanyahu made getting Israel to number among the top ten largest (per capita) economies in the world a centerpiece of his agenda.

pages: 403 words: 87,035

The New Geography of Jobs
by Enrico Moretti
Published 21 May 2012

Cities like Providence and Buffalo have manufacturing sectors that are heavily skewed toward traditional, low-value-added productions similar to those of China, and they have experienced large negative effects from the increased competition. By contrast, cities like Washington, D.C., and Houston are engaged in very different kinds of manufacturing and have experienced much smaller effects. In cities that directly compete with China, imports were found to cause rising local unemployment, decreased labor-force participation, and lower local wages. Interestingly, not all of these costs are borne by the workers directly displaced: a part of the cost is borne by other Americans in the form of government aid. The study finds that imports from China increased the use of welfare payments such as unemployment insurance, food stamps, and even disability insurance, which is often used as a hidden form of welfare.

pages: 287 words: 82,576

The Complacent Class: The Self-Defeating Quest for the American Dream
by Tyler Cowen
Published 27 Feb 2017

“(Un)natural Disaster; Vulnerability, Long-Distance Displacement, and the Extended Geography of Neighborhood Distress and Attainment after Katrina.” Population and Environment (August 2015): 1–31. Greenwood, Jeremy, Nezih Guner, Georgi Kocharkov, and Cezar Santos. “Technology and the Changing Family: A Unified Model of Marriage, Divorce, Educational Attainment and Married Female Labor-Force Participation.” American Economic Journal: Macroeconomics 8, no. 1 (December 2015): 1–41. Grönqvist, Erik, Jonas Vlachos, and Björn Öckert. “The Intergenerational Transmission of Cognitive and Non-Cognitive abilities.” IFAU—Institute for Labour Market Policy Evaluation working paper, 2010. Hacker, Jacob S., and Paul Pierson, “After the ‘Master Theory’: Downs, Schattschneider, and the Rebirth of Policy-Focused Analysis.”

pages: 284 words: 85,643

What's the Matter with White People
by Joan Walsh
Published 19 Jul 2012

Although wages for certain groups, such as working-class men, had declined since the seventies, household income had mostly held steady, mainly because women surged into the workplace, and most “households” now had two earners. Under Bush, household income declined, too, for the first time since the Census Bureau tracked that data in 1967. Labor force participation had reached an all-time high in 2000 but dropped steadily under Bush; relatedly, the economy created fewer jobs than at any time since World War II. Unemployment jumped from 3.9 percent when Clinton left office to 7.2 percent at the end of 2008. Clinton left Bush a $236 billion budget surplus; Bush would leave his successor saddled with a $1.2 trillion deficit.

pages: 299 words: 83,854

Shortchanged: Life and Debt in the Fringe Economy
by Howard Karger
Published 9 Sep 2005

Indeed, it’s no coincidence that 60% of payday lending customers are women.1924 Providing for the needs of the poor is like the game of hot potatoes. Government discharges the responsibility for the poor to the labor market through compulsory TANF work requirements, while the private sector employs them in low-wage jobs without benefits. The hot potato is then passed back to government, which institutes the benefit portions of labor-force participation—CHIPS for children; Medicaid; and EITC and CTC, for supplementing low wages. In the end, taxpayers continue to subsidize the poor, indirectly. In that sense, the major beneficiaries of welfare reform are not the poor or American taxpayers, but low-wage employers who can hire cheap hourly workers without the responsibility of providing anything beyond a weekly paycheck.

pages: 312 words: 84,421

This Chair Rocks: A Manifiesto Against Ageism
by Ashton Applewhite
Published 10 Feb 2016

A growing body of knowledge from very different schools of thought—including the Rand Corporation and Chicago, Belfast, Harvard, and Yale Universities—now acknowledges that health, along with the longevity it brings, are important economic drivers that generate wealth, by affecting health care costs, labor-force participation rates (given the appropriate incentives), worker productivity, and the financing of pension systems.9 Yet there’s more hand-wringing than back-patting going on A little less worried about the tug of time on your own prospects? It’s no time to relax! Journalist Paul Kleyman’s witty coinage—”global wrinkling”—evokes both the scale of this massive demographic shift and the free-floating anxiety that accompanies it.

pages: 362 words: 83,464

The New Class Conflict
by Joel Kotkin
Published 31 Aug 2014

Melanie Hicken, “Many Middle-Class Americans Plan to Work until They Die,” CNN Money, October 23, 2013, http://money.cnn.com/2013/10/23/retirement/middle-class-retirement. 10. Catherine Rampell, “More Young Americans Out of High School Are Also Out of Work,” New York Times, June 6, 2012. 11. Spencer Jakab, “Help Wanted: A Better Jobs Gauge for the Fed,” Wall Street Journal, February 6, 2014; Bureau of Labor Statistics, U.S. Department of Labor, “Labor Force Participation Projected to Fall for People under Age 55 and Rise for Older Age Groups,” January 6, 2014, http://www.bls.gov/opub/ted/2014/ted_20140106.htm. 12. Eurostat, http://epp.eurostat.ec.europa.eu; Liz Alerman, “Young and Educated in Europe, but Desperate for Jobs,” New York Times, November 16, 2013. 13.

pages: 324 words: 86,056

The Socialist Manifesto: The Case for Radical Politics in an Era of Extreme Inequality
by Bhaskar Sunkara
Published 1 Feb 2019

Still, as late as 1966, two-thirds of Swedish women stayed at home. A popular 1961 pamphlet pointed out that now women had the right to compete with men in the labor market but also had to maintain their household duties, making it difficult to do both in practice.24 Amid debate over this question, the state took steps to facilitate women’s labor force participation. An advisory council on sexual equality working directly with the prime minister’s office was created to generate policy that encouraged “free development” for women and challenged traditional gender roles. Palme committed himself wholeheartedly to the effort, writing in a thoughtful essay called “The Emancipation of Man” that women’s struggle for equality meant taking on the “pressure of thousand years old traditions.”

Undoing the Demos: Neoliberalism's Stealth Revolution
by Wendy Brown
Published 6 Feb 2015

The volume setting out the general parameters of the argument is Moral Boundaries: A Political Argument for an Ethic of Care (New York: Routledge, 1993). 71. See, for example, this argument by Becker: “The responsibility of married women for childcare and other housework has major implications for earnings and occupational differences between men and women, even aside from the effect on the labor force participation of married women. I submit that this is an important reason why the earnings of married women typically are considerably below those of married men, and why substantial occupational segregation persists.” Becker, A Treatise on the Family, p. 78. 72. Some have argued that gender stratification is reduced by neoliberalism, insofar as it involves a shift from an economy based on private property economy to an economy based on human capital.

pages: 398 words: 86,855

Bad Data Handbook
by Q. Ethan McCallum
Published 14 Nov 2012

But those advances have also led to new questions about the accuracy of survey data and the results researchers can reach from models based on that data. I’ve tried to show you a number of things to be aware of in your data. I typically work with economic data, which contains information on earnings, labor force participation, and other similar behaviors, but the strategies extend to any survey. Methods that firms or institutions use to produce data from surveys—such as imputations, topcoding, and proxy reporting—should always be documented, and as the researcher, you should always be aware of those methods and then decide how they might affect your results.

pages: 318 words: 93,502

The Two-Income Trap: Why Middle-Class Parents Are Going Broke
by Elizabeth Warren and Amelia Warren Tyagi
Published 17 Aug 2004

Available at http://workforcesecurity.doleta.gov/unemploy/uifactsheet.asp. 4 There have been conflicting studies of what sociologists call “the added worker effect,” that is, the magnitude and direction of changes in workforce participation of wives of unemployed men. For example, some researchers have examined whether a wife’s labor force participation increases in the same year of or in the year immediately following the husband’s unemployment, and found no significant effect. See, for example, Tim Maloney, “Unobserved Variables and the Elusive Added Worker Effect,” Economica 58 (May 1991): 173-187; see also W. Jean Yeung and Sandra L.

pages: 288 words: 92,175

Rise of the Rocket Girls: The Women Who Propelled Us, From Missiles to the Moon to Mars
by Nathalia Holt
Published 4 Apr 2016

The thrilling 1960 World Series is chronicled in Michael Shapiro, Bottom of the Ninth: Branch Rickey, Casey Stengel, and the Daring Scheme to Save Baseball from Itself (New York: Henry Holt, 2010). In 1960, 25 percent of married mothers with children under the age of eighteen entered the workforce, as reported in Sharon R. Cohany and Emy Sok, “Trends in Labor Force Participation of Married Mothers of Infants,” Monthly Labor Review, February 2007. Birth control became available in 1960 in the United States, as described in James Reed, The Birth Control Movement and American Society: From Private Vice to Public Virtue (Princeton, NJ: Princeton University Press, 2014).

pages: 335 words: 94,578

Spectrum Women: Walking to the Beat of Autism
by Barb Cook and Samantha Craft
Published 20 Aug 2018

Overview—autism and employment Employment is important. It can provide financial independence and a sense of inclusion and being part of something bigger. Autistic people can face challenges in gaining suitable employment, but it does not need to be unattainable. Currently we face some of the lowest labor force participation rates of any disability group and some of the highest levels of unemployment (Australian Bureau of Statistics, 2017). However, there are a number of effective strategies which we can put in place to address this disparity. In recent years things have started to change. Positives of employing autistic women Autistic women often have some very useful “soft skills.”

pages: 372 words: 92,477

The Fourth Revolution: The Global Race to Reinvent the State
by John Micklethwait and Adrian Wooldridge
Published 14 May 2014

But like the Swedes (and the Singaporeans), the Danes are experimenting—attempting to preserve what is best about their welfare state while trying new ways of delivering services. So far the experiment seems to be working remarkably well. The Nordics dominate indices of social inclusion as well as competitiveness and well-being. They have exceptionally high rates of female labor-force participation and the world’s highest rates of social mobility.1 They continue to pride themselves on the generosity of their welfare states. About 30 percent of their labor force works in the public sector, twice the average in the OECD. They continue to believe in combining open economies with public investment in human capital.

pages: 321 words: 92,828

Late Bloomers: The Power of Patience in a World Obsessed With Early Achievement
by Rich Karlgaard
Published 15 Apr 2019

And according to the Equal Employment Opportunity Commission, age is cited in 26 percent of total complaints in California, 22 percent in New York, 21 percent in Texas, and 37 percent in Illinois, which has the highest ratio of age-related complaints. At first glance, older workers wouldn’t seem to have it all that bad in today’s economy. The unemployment rate among workers over fifty-five hovered around 4 percent in 2018, and labor force participation among older workers has been rising since the early 1990s. But the headline statistics obscure a bleaker situation: Older workers who do lose a job spend more time out of work. And when they do find another job, it tends to pay less than the one they left. A 2015 AARP study highlights the challenges of long-term unemployment still facing many older workers.

pages: 312 words: 91,835

Global Inequality: A New Approach for the Age of Globalization
by Branko Milanovic
Published 10 Apr 2016

It is paradoxical that increasing inequality has resulted from a change in social norms that has seen the labor participation rate of women almost catch up with that of men (73 percent for women, 84 percent for men in 2010) and has encouraged marriages that are based on a model of equal partnership between people with similarities of interests and backgrounds rather than a hierarchical model where the husband is the breadwinner and the wife a homemaker. This trend may continue in the future, as the gap in both educational achievement and labor force participation between men and women disappears. It will, however socially desirable in some ways, add to interpersonal income inequality.26 Finally, we come to the fifth element that makes the reversal of inequality in the United State particularly difficult: the growing importance of money in electoral politics.

pages: 289 words: 99,936

Digital Dead End: Fighting for Social Justice in the Information Age
by Virginia Eubanks
Published 1 Feb 2011

Rather than illustrating women “catching up” to men in the region’s high-tech workforce, the data suggest that work in the region is being feminized, both in the sense that a larger share of employment is going to women and in the sense that employment itself has shifted to have characteristics associated with women’s labor force participation: lower pay, contingent and temporary work arrangements, and little or no job training (ibid.).20 Generalized imputations of “women’s economic interests” and “men’s economic interests,” which underlie prescriptions to fill the high-tech pipeline with marginalized people or empower women to break into the boys’ club of science and technology, overlook the feminization of work and obscure and marginalize important differences among women by race.

pages: 361 words: 97,787

The Curse of Cash
by Kenneth S Rogoff
Published 29 Aug 2016

Definitions also differ across studies of the underground economy, for example, whether or not it includes all criminal activity or just tax and regulatory evasion. One influential methododology15 has been developed by Austrian professor Friedrich Schneider, a pioneer in efforts to measure the underground economy. Schneider’s empirical approach forms estimates based on a variety of monetary and labor market indicators, including the labor force participation rate, tax rates, the quality of public service delivery, and other indicators. Figure 5.1 shows the results. It is important to note that the particular definition of underground economy underlying these estimates is a narrow one that does not include illegal or nonmarket activities. Rather, the measure aims to capture all (otherwise) legal market-based production of goods and services that are deliberately concealed from authorities to avoid income, sales, or value-added taxes; social security contributions; certain labor standards like minimum wage or maximum working hours; certain administrative inconveniences; or any combination of these.16 Under this narrower definition of underground economy that does not include many types of illegal activities, the United States and Switzerland are estimated to have among the smallest underground economies, at 7.1% and 7.9% of GDP, respectively.

pages: 347 words: 97,721

Only Humans Need Apply: Winners and Losers in the Age of Smart Machines
by Thomas H. Davenport and Julia Kirby
Published 23 May 2016

There is already evidence that the big payoffs in today’s economy are going not to the bulk of knowledge workers, but to a small segment of “superstars”—CEOs, hedge fund and private equity managers, investment bankers, and so forth—almost all of whom are very well leveraged by automated decision-making. Meanwhile, labor force participation rates in developed economies steadily fall. Silicon Valley investor Bill Davidow and tech journalist Mike Malone, writing recently for Harvard Business Review, declared that “we will soon be looking at hordes of citizens of zero economic value.”6 They say figuring out how to deal with the impacts of this development will be the greatest challenge facing free market economies in this century.

The Winner-Take-All Society: Why the Few at the Top Get So Much More Than the Rest of Us
by Robert H. Frank, Philip J. Cook
Published 2 May 2011

Since then, wages and salaries have generally lagged behind inflation, espe­ cially for males of average skills and education. So accustomed had most of us become to steadily rising living standards that it remains something of a shock to realize that the all-time peak in the average wage rate occurred more than two decades ago. Since then the in­ crease in labor force participation by women has mitigated the loss in male earnings, but despite this, median family income has grown little since the early 1970s. Yet while members of the middle class have struggled to hold their own, the rich have grown considerably richer. The increasing polariza­ tion of household incomes is a trend every bit as troubling as the lack of growth in the middle.

pages: 337 words: 100,541

How Long Will Israel Survive Threat Wthn
by Gregg Carlstrom
Published 14 Oct 2017

Some of them already share the burden: most haredi men do not work, but 46 per cent of them do, along with 71 per cent of women; about 2,000 men voluntarily enlist in the army each year. Overwhelmingly, however, they do not. The employment figure for men is far below the national average of 60 per cent. The only group with a lower rate of labor force participation is Arab women. And army enlistment represents roughly 20 per cent of the possible conscripts each year. It’s impossible to say what fraction of the haredi community supports the status quo. Indeed, this is arguably the community’s biggest problem. Rabbis and politicians set the agenda; everyone else is expected to fall in line.

pages: 358 words: 106,729

Fault Lines: How Hidden Fractures Still Threaten the World Economy
by Raghuram Rajan
Published 24 May 2010

See United Progressive Alliance Vanguard venture capital Volcker, Paul wages: effects of immigration inequality in in managed capitalist systems minimum,See also incomes Wallison, Peter J. Wall Street Journal Wang, Y. C. Washington Mutual wealth See also income inequality Weber, Max Weimar Republic welfare programs. See safety net Willumstad, Robert women, labor force participation of work, motivations in, See also employment World Bank World Trade Organization (WTO) Yin, K. Y. Zedillo, Ernesto

pages: 408 words: 108,985

Rewriting the Rules of the European Economy: An Agenda for Growth and Shared Prosperity
by Joseph E. Stiglitz
Published 28 Jan 2020

Some European governments have done particularly well in this regard for these more flexible jobs by requiring family leave, paternity and maternity leave, and by providing child day care facilities.** IMPROVING EMPLOYMENT OPPORTUNITY AND SECURITY Active Labor Market Programs, Industrial Policies, and Place-Based Assistance Current EU active labor market programs place a strong emphasis on activation, which focuses on increasing labor-force participation rates. There are two sides of activation: a demand side, ensuring that there is not an insufficiency of demand, and a supply side, ensuring that workers have the skills required by the labor market. Modern economies are very dynamic, with jobs being created and destroyed all the time. Unfortunately, the new jobs are often not in the same places as the old jobs and often require different skills than the old ones.

pages: 565 words: 122,605

The Human City: Urbanism for the Rest of Us
by Joel Kotkin
Published 11 Apr 2016

Debbie Soon at the Institute of Policy Studies in Singapore suggests that societies need to reevaluate what constitutes success in order to gain an understanding that “a healthy family life is just as much a form of success as is good standing in one’s chosen profession.”135 Certainly an adjustment is needed if cities hope to develop future generations of urbanites. Demographer Wolfgang Lutz notes that Singapore, despite its host of pro-natalist policies, works at cross-purposes to these policies by insisting on long hours for employees, many of whom are women. Singapore’s labor force participation rate for women is almost 60 percent. “In Singapore,” Lutz points out, “women work an average of 53 hours a week. Of course they are not going to have children. They don’t have the time.”136 WHERE WILL FUTURE URBANITES COME FROM? ELSEWHERE Once fertility rates reach extremely low levels, Lutz notes, this trend could prove irreversible.

pages: 401 words: 109,892

The Great Reversal: How America Gave Up on Free Markets
by Thomas Philippon
Published 29 Oct 2019

Journal of Labor Economics 31(S1), S173–S202. Kroszner, R. S., and T. Stratmann (2005). Corporate campaign contributions, repeat giving, and the rewards to legislator reputation. Journal of Law and Economics 48(1), 41–71. Krueger, A. B. (2017). Where have all the workers gone? An inquiry into the decline of the U.S. labor force participation rate. Brookings Papers on Economic Activity (Spring). Krueger, A. B., and O. Ashenfelter (2018). Theory and evidence on employer collusion in the franchise sector. NBER Working Paper No. 24831, National Bureau of Economic Research, Cambridge, MA, July. Krugman, P. (1998). It’s baaack: Japan’s slump and the return of the liquidity trap.

Capitalism, Alone: The Future of the System That Rules the World
by Branko Milanovic
Published 23 Sep 2019

Whatever the reasons for it, increasing homogamy is yet another factor that will push income inequality up. However, it will only push inequality up during the period of transition from nonassortative mating (or assortative mating with nonparticipation of wives in the labor force) to assortative mating. Once assortative mating and labor force participation rates have reached their limits, the inequality-enhancing effect disappears. Inequality stabilizes, albeit at a high level. Intergenerational transmission of inequality The final characteristic of capitalism that we will examine is the transmission of acquired advantages, notably wealth and “human capital,” across generations, often measured by the correlation between parents’ and children’s incomes (Table 2.1, row 6).

pages: 492 words: 70,082

Immigration worldwide: policies, practices, and trends
by Uma Anand Segal , Doreen Elliott and Nazneen S. Mayadas
Published 19 Jan 2010

Given the events that were to follow post 9/11, it might be wise to examine Australia’s humanitarian record at a time when its refugee policy remained relatively uncontroversial (Jupp 2002) 160 Table 11-2. Characteristics of Immigrant Arrivals (1997–2007) by Top Ten Source Countries ~Percentage Intake 1997–98 ~Percentage Intake 2006–07 #No. of arrivals 1997–2007 #Percentage intake 1997–2007 * Census count 2006 * Median Age in Years * Qualifications * Labor Force Participation * Unemployment Rate * Citizenship * English Proficiency Total Australian Population Total Overseas born N/A New Zealand United Kingdom N/A 19 12 6 4 5 4 2 1 .05 3 N/A N/A 17 17 9 10 3 4 1 2 2 2 N/A N/A 183 187 140 478 81 883 69 515 49 459 37 205 26 590 23 365 23 129 22 287 N/A N/A 17.4 13.4 04.7 03.5 02.5 02.2 02.2 02.1 N/A 37.1 N/A 46.8 389 470 39.5 1 038 160 53.7 206 590 147 110 104 130 39.3 35.8 38.4 120 540 40.3 50 970 32.2 92 330 39.5 52.5 64.6 N/A N/A 51.2 76.3 56.8 58.8 55.0 56.3 76.1 72.3 68.1 75.1 64.9 73.1 62.7 62.1 66.8 67.3 38.8 40.3 35.1 61.9 5.2 N/A 04.9 03.9 11.2 07.3 4.1 05.2 09.0 05.7 28.5 11.4 N/A N/A 75.6 N/A 40 94.1 70.2 E/S 73.2 64.7 74.6 94.0 80.1 97.6 92.1 95.5 47.5 89.8 59.7 92.1 70.9 67.0 95.1 56.1 China 07.8 India 06.6 South Africa Philippines Indonesia Malaysia Sudan Vietnam 19 050 159 850 24.6 41.0 Note: The characteristics cited in this section of the table represent the characteristics of all immigrants from this source country in 2007, not just the immigrants from 1997 to 2007.

By the late 1990s, the government had also started to admit large numbers of foreign workers into the area of household work and healthcare services. The main purpose behind this policy was to release the better-educated native Taiwanese women from their household duties, and thereby raise their labor force participation rate and thus their labor supply, while simultaneously alleviating the problem of a growing shortage of child care and health care service workers. Since the admission of foreign health care workers has been determined by need and not by quotas, the number of these workers has increased rapidly and by 2007 its share among all foreign workers had quickly risen to 45%.

pages: 411 words: 114,717

Breakout Nations: In Pursuit of the Next Economic Miracles
by Ruchir Sharma
Published 8 Apr 2012

One of the more unusual signs of stagnation is that Thailand has failed to enjoy the standard payoff when women work. Thailand has a very large population of working women, which normally translates into a higher level of economic development. It stands to reason that the more people there are earning incomes, the richer the society will be. But Thailand’s high rate of female labor-force participation (66 percent) has produced no boost in growth. This is perhaps particularly surprising given that in Thailand the groom’s family must pay a dowry to the bride, and not the other way around as in many Asian cultures. The male dowry would seem to suggest a society that traditionally puts a high value on the earning power of women.

pages: 446 words: 117,660

Arguing With Zombies: Economics, Politics, and the Fight for a Better Future
by Paul Krugman
Published 28 Jan 2020

No, it’s mainly about money. To be fair, the new book at the heart of the conservative pushback, Charles Murray’s Coming Apart: The State of White America, 1960–2010, does highlight some striking trends. Among white Americans with a high school education or less, marriage rates and male labor force participation are down, while births out of wedlock are up. Clearly, white working-class society has changed in ways that don’t sound good. But the first question one should ask is: Are things really that bad on the values front? Mr. Murray and other conservatives often seem to assume that the decline of the traditional family has terrible implications for society as a whole.

pages: 421 words: 125,417

Common Wealth: Economics for a Crowded Planet
by Jeffrey Sachs
Published 1 Jan 2008

The surprising fact is that the social-welfare states have an even higher employment rate (number of workers as a share of the working-age population) than the free-market countries. The free-market countries in turn have a higher employment rate than the mixed economies. The key here is that the social-welfare states have very high rates of female labor-force participation. The social-welfare system ensures day care and schooling for the children, so mothers have the time and means to enter the labor market. The social-welfare states have been successful in maintaining very high employment rates for two other reasons. First, social support for the working-age population has been tied to specific policies that require those receiving benefits to seek employment with the assistance of government programs.

pages: 413 words: 119,587

Machines of Loving Grace: The Quest for Common Ground Between Humans and Robots
by John Markoff
Published 24 Aug 2015

“The restructuring of production practices and the permanent replacement of machines for human laborers has begun to take a tragic toll on the lives of millions of workers,” he wrote.22 The challenge to his thesis was that employment in the United States actually grew from 115 million to 137 million during the decade following the publication of his book. That meant that the size of the workforce would grow by over 19 percent while the nation’s population grew by only 11 percent. Moreover, key economic indicators such as the labor force participation rate, employment to working population ratio, and the unemployment rate showed no evidence of technological unemployment. The situation, then, was more nuanced than the impending black-and-white labor calamity Rifkin had forecast. For example, from the 1970s, the outsourcing of jobs internationally, as multinational corporations fled to low-cost manufacturing regions and used telecommunications networks to relocate white-collar jobs, had a far more significant impact on domestic employment than the deployment of automation technologies.

pages: 550 words: 124,073

Democracy and Prosperity: Reinventing Capitalism Through a Turbulent Century
by Torben Iversen and David Soskice
Published 5 Feb 2019

By including a control for spending “mandated” by replacement rates that were in place in the year before the shock, we focus attention on the discretionary elements of the budget. The replacement data are from Vliet and Caminada’s (2012) updated version of Scruggs’s (2004) widely used dataset.2 We also tried to include measures for economic openness (imports plus exports as a percent of GDP), female labor force participation (as a percent of the working age population), and voter turnout. None of these register a significant effect, and leave our substantive results unaltered. They have been omitted in the regression results reported below. Finally, there are two technical issues that we need to address. Since the shock variable is estimated rather than observed directly, the estimate of the effect of shocks will contain measurement error.

pages: 458 words: 134,028

Microtrends: The Small Forces Behind Tomorrow's Big Changes
by Mark Penn and E. Kinney Zalesne
Published 5 Sep 2007

Marriage data come from National Vital Statistics Report, Vol. 54, No. 8, “Births, Marriages, Divorces, and Deaths, Provisional Data for June 2006.” The PSB poll of Internet Marrieds was conducted online on March 27–28, 2007. II. Work Life Working Retired The data on seniors in the workforce come from “Labor Force Participation of Persons Ages 62 and Over, 1982–2005,” Current Population Survey (CPS), Bureau of Labor Statistics. The data on vacation days worldwide come from the World Tourism Organization, whose Web site is http://www.world-tourism.org/. For more on unused vacation and working while on vacation, see Stephanie Armour, “U.S.

pages: 511 words: 132,682

Competition Overdose: How Free Market Mythology Transformed Us From Citizen Kings to Market Servants
by Maurice E. Stucke and Ariel Ezrachi
Published 14 May 2020

The United States has one of the highest poverty and inequality levels among the OECD countries,” and also ranks near the bottom among wealthy countries in terms of labor markets, safety nets, and economic mobility.5 The middle class, in the United States and in much of Europe, is shrinking—down to just over 50 percent in the United States and 60 percent in the European Union.6 Once-thriving manufacturing centers where workers could earn a decent living have been reduced to a state of rusting decay brought about by declines in labor’s share of profits, low-skilled workers’ wages, labor force participation, and the start-up rate of new firms (due to barriers erected by powerful incumbents).7 Yet, our elected officials continue to defend the competition ideology, to insist that it will pay off, even as our pocketbooks, health care, and social rights tell us otherwise. What has happened is that the idealized perfect competition portrayed in the economic textbooks has been squeezed out by the bad forms of competition—monopolistic or toxic or both.

pages: 506 words: 133,134

The Lonely Century: How Isolation Imperils Our Future
by Noreena Hertz
Published 13 May 2020

The late economist Alan Krueger found that work defined working men’s identities more than women’s, as measured by the amount of emotional distress it brought men vs. women when they were no longer participating in the labour force. See Alan B. Krueger, ‘Where Have All the Workers Gone? An Inquiry into the Decline of the U.S. Labor Force Participation Rate,’ Brookings Papers on Economic Activity 2 (2017), 1–87, https://doi.org/10.1353/eca.2017.0012. 41 ‘Trump: We’re putting our great coal miners back to work’, Fox Business, 21 August 2018, https://www.youtube.com/watch?v=XnSlzBcLLGs. 42 Noam Gidron and Peter A. Hall, ‘The politics of social status: economic and cultural roots of the populist right’, The British Journal of Sociology 68, no. 1 (November 2017), S57–S84, https://doi.org/10.1111/1468-4446.12319; idem., ‘Understanding the political impact of white working-class men who feel society no longer values them’, The London School of Economics, 28 December 2017, https://blogs.lse.ac.uk/politicsandpolicy/understanding-the-political-impact-of-white-working-class-men/.

pages: 445 words: 135,648

Nothing Personal: My Secret Life in the Dating App Inferno
by Nancy Jo Sales
Published 17 May 2021

“Fyre Festival, a Luxury Music Weekend, Crumbles in the Bahamas.” New York Times, April 28, 2017. www.nytimes.com/2017/04/28/arts/music/fyre-festival-ja-rule-bahamas.html. Cosmopolitan’s New Etiquette Guide. New York: Hearst Corporation, 1971. Council of Economic Advisers. The Long-Term Decline in Prime-Age Male Labor Force Participation. Washington, DC: Obama White House, 2016. Cousins, Keith. “Dating Apps Can Be Dangerous. Congress Is Investigating.” ProPublica, January 31, 2019. www.propublica.org/article/dating-apps-can-be-dangerous-congress-is-investigating. Cuccinello, Hayley C. “From Taylor Swift to Katrina Lake, America’s Richest Self-Made Women Under 40.”

Investing Amid Low Expected Returns: Making the Most When Markets Offer the Least
by Antti Ilmanen
Published 24 Feb 2022

Bakshi-Chen (1994), Poterba (2001), Ang-Maddaloni (2003), Goyal (2004), Arnott-Chaves (2012), Kopecky-Taylor (2020)). It is also open whether asset prices are influenced more by global or local aging trends. 5 Vollrath (2020) estimates that most of the decline in US GDP-per-capita growth in the 21st century reflects slower human capital growth, as the multi-decade positive impact from women's higher labor force participation and the baby boomers' working age dissipated. Secondary reasons included slower productivity growth due to the shift from manufacturing to service economy as well as some firms' increasing market power. Rachel and Summers (2019) emphasize secular stagnation concerns and argue that the neutral real rate would have fallen even more in the absence of expansive fiscal policies and growing contingent liabilities related to aging.

pages: 487 words: 151,810

The Social Animal: The Hidden Sources of Love, Character, and Achievement
by David Brooks
Published 8 Mar 2011

The GED recipients are as smart as high-school grads who do not go on to college, but they earn less than these high-school grads. In fact, they have lower hourly wages than do high-school dropouts, because they possess fewer of the so-called noncognitive traits like motivation and self-discipline. GED recipients are much more likely to switch jobs. Their labor-force participation rates are lower than that of high-school grads. At the very top of intellectual accomplishment, intelligence is nearly useless in separating outstanding geniuses from everybody else. The greatest thinkers seem to possess mental abilities that go beyond rational thinking narrowly defined.

pages: 586 words: 159,901

Wall Street: How It Works And for Whom
by Doug Henwood
Published 30 Aug 1998

Economists from the U.S. Bureau of Labor Statistics (FuUerton 1992, Saunders 1992, Rosenthal 1992) reviewed the Bureau's own employment projections and found similar failings. The 1973 forecast for 1990 greatly underestimated the continuing surge of women into the workforce. Projections of the female labor force participation rate (LFPR) in 1990 made in 1978, 1980, 1983, and 1985 were a lot closer to the mark, but by 1978, women's LFPR had already risen sharply enough to be noticeable. In its macroeconomic projections, the 1978 and 1981 GNP forecasts for 1990 were too optimistic — the 1978 forecast by a margin of 11.5%, a not inconsiderable $386 billion.

The State and the Stork: The Population Debate and Policy Making in US History
by Derek S. Hoff
Published 30 May 2012

, 232 Weismann, August, 266n92 welfare policy: demography as tool in welfare retrenchment, 239–40; family planning programs and, 148 welfare state, 103; agricultural, 75; maternalistic, 278n54 Wells, David, 54 Westbrook, Robert, 86 Westoff, Charles, 218 westward expansion, 29; arguments for, 40– 43; believed to alleviate problems of population increase, 18–19 Weyl, Walter, 56 Wharton Business School Study of Population Redistribution, 102 Whelpton, Pascal K., 63–64, 89–90, 91, 94, 280n78 Whig Party: antislavery faction, 42; celebration of population growth, 15; opposition to immigration, 41; opposition to westward expansion, 42; support for federal intervention in economy, 30–31 White House Conference on Conservation, 1962, 168 Wicksell, Knut, 48, 67–68 Wildavsky, Aaron, 175 Wilderness Act of 1964, 166, 169–70, 172, 173, 314n6, 315n23 wilderness protection, 317n38; and media, 170–71; opponents of, 172–73; and quality-of-life critique of population growth, 171 Wilderness Society, 69, 170, 173 wilderness-to-person ratio, 170 Wildlife Conservation Society, 288n11 Wilmot, David, 38 377 Wilmoth, John, 129 Wilson, Edwin, 66 Wirtz, Willard, 141, 153, 302n25 Wolfe, A. B., 68, 88, 91 Wollstonecraft, Mary, 25 women, labor force participation, 138. See also marriage women’s movements, 2. See also feminist groups women’s rights, and population issues, 189, 322n106, 346n10 working-class neo-Malthusianism, 5 World Food Congress, 1963, 146 World Population Conference, Geneva, 1927, 65 World War I, and population decline in Europe, 67 World War II, 84; domestic resource mobilization, 114; economic policy making during, 287n173; population growth during, 104 Worster, Donald, 109 Wright, Harold, 68 Wrobel, David, The End of American Exceptionalism, 44, 70 Yarborough, Ralph, 331n16 Youth Conservation Corps, 140, 141 youth unemployment, 138, 139, 140–41, 302n25 Zahniser, Howard, 173 Zeckhauser, Richard, 226 zero economic growth, 223, 232, 233, 286n160, 347n27; relation to zero population growth, 192–94, 197, 234, 235 Zero Population Growth (ZPG): local-issue nature of, 193–94; promotion of racial and gender liberalism, 180, 189; radicals within, 187; split over immigration in 1970s, 180; support for liberalized abortion laws, 181–82; support for state role in fertility reduction, 180 zero population growth movement, 9, 11, 12, 114, 165, 179–82, 195; abortionrelated backlash against, 201–2; AfricanAmerican attitudes to, 188–89, 326n158; and critique of capitalism, 190; demise of, 13, 187, 234–35; economic ideas, 187, 190–94, 232; external criticisms of, 188– 378 zero population growth movement (continued) 89; and Nixon administration, 196–97, 205, 212; on population distribution issue, 205, 286n160; rejection of compulsory fertility reduction, 166, 187–88; relation to zero economic growth, 192– 93, 197, 234, 235; and Stable Population index Keynesianism, 192–93; support from mainstream business press, 184; tensions with those who stressed technology, 189–91; and unsustainable growth discourse, 222 zero-sum society, 44, 196 ZPG Reporter, 182, 192

pages: 519 words: 155,332

Tailspin: The People and Forces Behind America's Fifty-Year Fall--And Those Fighting to Reverse It
by Steven Brill
Published 28 May 2018

Macy also noted that more laid-off workers got themselves onto Social Security’s program for the disabled, by claiming ailments, than enrolled in TAA. In fact, sharply rising enrollment in the disability program has been recorded across the United States in the last two decades, a barometer of the disaffection, frustration, or lack of initiative that parallels a broader national trend of lower labor force participation—meaning fewer adults, especially white males, are even trying to find work. In 1960, Henry County voted 59 percent to 41 percent for the creator of TAA, John F. Kennedy. In 2016, the county went 63 percent to 34 percent for Donald Trump. Macy’s book was a best seller and earned rave reviews, many of which suggested she had uncovered and powerfully conveyed an important story hiding in plain sight, or at least in plain sight where she lived.

pages: 470 words: 148,730

Good Economics for Hard Times: Better Answers to Our Biggest Problems
by Abhijit V. Banerjee and Esther Duflo
Published 12 Nov 2019

,” Harvard Business Review, December 14, 2015 and “Four Fundamentals of Business Automation,” McKinsey Quarterly, November 2016, accessed June 19, 2019, https://www.mckinsey.com/business-functions/digital-mckinsey/our-insights/four-fundamentals-of-workplace-automation. 7 “Automation, Skills Use and Training,” Organisation for Economic Co-operation and Development Library, accessed April 19, 2019, https://www.oecd-ilibrary.org/employment/automation-skills-use-and-training_2e2f 4eea-en. 8 “Robots and Artificial Intelligence,” Chicago Booth: The Initiative on Global Markets, IGM Forum, June 30, 2017. 9 Robert Gordon, The Rise and Fall of American Growth (Princeton, NJ: Princeton University Press, 2016). 10 Databases, Tables, and Calculators by Subject, Series LNS14000000, Bureau of Labor Statistics, accessed April 11, 2019, https://data.bls.gov/timeseries/lns14000000. 11 Robert Gordon, The Rise and Fall of American Growth (Princeton, NJ: Princeton University Press, 2016); “Labor Force Participation Rate, Total (% total population ages 15+) (national estimate),” World Bank Open Data, https://data.worldbank.org/indicator/SL.TLF.CACT.NE.ZS?locations =US. 12 Daron Acemoglu and Pascual Restrepo, “Artificial Intelligence, Automation and Work,” NBER Working Paper 24196, 2018. 13 N. F. R.

Lifespan: Why We Age—and Why We Don't Have To
by David A. Sinclair and Matthew D. Laplante
Published 9 Sep 2019

It has thrown hundreds of thousands of people out of work and will throw out many more.”67 It then quotes from a then-recent study on the topic: “Within the next two decades machines will be available outside the laboratory that will do a credible job of original thinking, certainly as good as that expected of most mid-level people who are supposed to ‘use their minds.’ ” The foreboding article concludes, “While we are fast running out of use for people, we are at the same time ironically producing people faster than ever.” Those fears never materialized as fact, not even in the face of another tremendous disruption of the status quo. In 1950, the US labor force participation rate of women was about 33 percent; by the turn of the century, it had nearly doubled. Tens of millions of women began working during those decades; that didn’t result in tens of millions of men losing their jobs. The labor market isn’t a pizza with a limited number of pieces. Each of us can have a slice of the pie.

pages: 530 words: 147,851

Small Men on the Wrong Side of History: The Decline, Fall and Unlikely Return of Conservatism
by Ed West
Published 19 Mar 2020

(Especially since I imagine a number of them are privately engaging in ‘unspeakable acts of degradation’, as one tabloid once described some sex scandal, which took place in a £550,000 two-bedroom flat.) Yet money does play a part, since ‘the relentless downward trend in men’s median wages, the even more relentless downward trend in labor force participation’ is ‘undoubtedly’ having an impact, according to one analysis.12 Medium male income is declining, but even more so in relation to women, and one
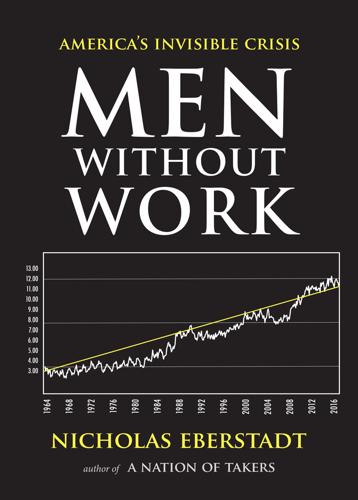
 study found that ‘within marriage markets, when a randomly chosen woman becomes more likely to earn more than a randomly chosen man, marriage rates decline’.13 There seemed a growing discontent among the Tory foot soldiers.

pages: 596 words: 163,682

The Third Pillar: How Markets and the State Leave the Community Behind
by Raghuram Rajan
Published 26 Feb 2019

Indeed, fewer than 60 percent of households in the United States had an exclusive indoor flush toilet or a bathing facility at that time; the rest had to do with outdoor privies or shared facilities.2 The postwar resurgence was driven by five elements: reconstruction, the resumption of trade, technological upgradation and the movement of workers away from agriculture, greater education and labor-force participation, and the broad political consensus for growth.3 The immediate task of repairing the destruction caused by war was a source of employment for the semiskilled in the workforce, and it generated household income that would fuel demand for other goods and services. Reconstruction needed funds, and strapped postwar European governments could tax their populations only so much.

pages: 687 words: 189,243

A Culture of Growth: The Origins of the Modern Economy
by Joel Mokyr
Published 8 Jan 2016

The empirical work on the economics of culture depends heavily on data from the World Values Survey, Gallup World Poll, and similar data (Guiso, Sapienza, and Zingales, 2006; Tabellini, 2008, 2010; Deaton, 2011). This work has successfully addressed a whole set of issues of supreme importance to economists such as household behavior and female labor force participation, corruption, and migration (Fernández, 2011). It also draws heavily on experimental data, which suggest that culture modifies behavior in many ways that qualify and nuance the standard economic assumptions of individual utility maximization in such obvious set-ups as simple ultimatum games (Bowles, 2004, pp. 110–19).

pages: 662 words: 180,546

Never Let a Serious Crisis Go to Waste: How Neoliberalism Survived the Financial Meltdown
by Philip Mirowski
Published 24 Jun 2013

Thatcher’s governments to re-open the road of opportunity.” 50 O. Jones, Chavs, p. 167. 51 Data from http://quickfacts.census.gov/qfd/states/00000.html. Last consulted August 7, 2011. The mean was so far below the median because the distribution of income had become so skewed to the bottom, and expanded labor force participation: see the data presented at http://elsa.berkeley.edu/~saez/. 52 Linden, “Addictive Personality?” 53 Ailon, “The Discursive Management of Financial Risk Scandals,” pp. 264–65. 54 Ibid., p. 267. 55 The narrative that blamed the crisis on Fannie Mae and Freddie Mac and improvident home owners is covered below in chapter 5.

Termites of the State: Why Complexity Leads to Inequality
by Vito Tanzi
Published 28 Dec 2017

For example, Esping-Andersen, an influential Danish economist and sociologist, in a 2008 book argued that some social programs can increase the size of the labor force, by allowing more women to enter it and work in paid jobs and to pay taxes on their incomes. Therefore, women can raise both the countries’ economic output and their tax revenue, to make it easier to finance the social programs. He pointed out that in the Scandinavian countries the labor force participation, and especially the participation by women, is among the highest in the world, thus contributing to the countries’ national output and tax revenue. Other defenders of the welfare state have made similar points (see papers in Costabile, 2008). A problem with that observation is that, often in welfare states such as those of the Scandinavian countries, many of the working women end up working for government programs and doing largely the same, but now paid, jobs outside their houses as they were doing inside the houses, when they were not part of the formal labor force.

pages: 619 words: 177,548

Power and Progress: Our Thousand-Year Struggle Over Technology and Prosperity
by Daron Acemoglu and Simon Johnson
Published 15 May 2023

Mean log wages for broader groups in each year represent weighted averages of the relevant (composition-adjusted) cell means using a fixed set of weights, equal to the mean share of total hours worked by each group over 1963‒2005. Median log wages are computed similarly. All earnings numbers are converted to real earnings by being deflated using the chain-weighted (implicit) price deflator for personal consumption expenditures. Labor-force participation for prime-age workers for the US is computed from the same data, and for other countries we use data from the Organisation for Economic Co-operation and Development (OECD), https://data.oecd.org/emp/labour-force-participation-rate.htm. The Pew Research Center report is by Schumacher and Moncus (2021).

Statistics in a Nutshell
by Sarah Boslaugh
Published 10 Nov 2012

We will do a regression analysis to test this hypothesis, using data downloaded from the United Nations Human Development Project. We will use the Gender Inequality Index as our predictor variable; this index is composed of five variables measuring aspects of women’s reproductive health, empowerment, and labor force participation, and has a range of approximately 0–100 (in our data set, from 6.5 to 79.1), with lower numbers signifying greater equality. Note that this is what is known as ecological or aggregated data; the value for each variable relates to a measurement on a country rather than on an individual. There’s nothing wrong with using ecological data, but you must be careful to draw conclusions only for data at the same level of aggregation as the data you analyzed; in this case, our results will apply at the country level, not at the level of the individual.

pages: 741 words: 199,502

Human Diversity: The Biology of Gender, Race, and Class
by Charles Murray
Published 28 Jan 2020

The wrong nations had the largest sex differences: “Sex differences are most marked among European and American cultures and most attenuated among African and Asian cultures,” they wrote.[27] To convey this finding more systematically, I employ the UN’s annual Gender Inequality Index (GII). It is based on maternal mortality rate, adolescent birth rate, women’s share of seats in parliament, percentage of women with at least some secondary education, and women’s labor force participation.[28] A high score on the GII indicates high inequality. The results correspond to widespread impressions that Western Europe has the best record for sex equality. Among the 70 nations with data on personality and a GII score, the five nations with the best (meaning lowest) scores on the GII were Switzerland, Denmark, the Netherlands, Sweden, and Iceland.

pages: 740 words: 227,963

The Warmth of Other Suns: The Epic Story of America's Great Migration
by Isabel Wilkerson
Published 6 Sep 2010

They found that, among young black men in the North, fifteen percent of those born in the North were jobless as against nine percent of the southern migrants they studied. “The same pattern applies to all other age groups and to the West,” the census found. Whatever their educational level, the migrants “more successfully avoided poverty,” wrote Long and his colleague Kristin A.55 Hansen of the Census Bureau, “because of higher rates of labor force participation and other (unmeasured) characteristics.” There developed several theories as to why. One was that, because of the migrants’ hard-laboring lives in the South, they had “a stronger attachment to the labor force as a result of their work-oriented values,” Long and Hansen wrote. Another explanation pointed to disadvantages facing the northern-born blacks in the migrants’ destinations—“exposure to drugs, crime and other conditions in big cities that may be handicaps in obtaining and holding jobs.”

Growth: From Microorganisms to Megacities
by Vaclav Smil
Published 23 Sep 2019

Modern societies have been increasingly concerned about immaterial variables whose growth trajectories describe changing levels of economic performance, affluence, and quality of life. Common variables that the economists want to see growing include the total industrial output, GDP, disposable income, labor productivity, exports, trade surplus, labor force participation, and total employment. Affluence (GDP, gross earnings, disposable income, accumulated wealth) is commonly measured in per capita terms, while the quality of life is assessed by combinations of socioeconomic variables. For example, the Human Development Index (HDI, developed and annually recalculated by the United Nations Development Programme) is composed of three indices quantifying life expectancy, educational level, and income (UNDP 2016).

pages: 1,205 words: 308,891

Bourgeois Dignity: Why Economics Can't Explain the Modern World
by Deirdre N. McCloskey
Published 15 Nov 2011

Williamson claims repeatedly, as economists do when adhering to the dogma of de gustibus non disputandum est, that ethics always changes slowly. But there is no historical or experimental evidence for such a claim. Sometimes ethics, a matter of S and the ethical parts of L, changes quickly. Sometimes it doesn’t. You have to find out. The ethics of labor-force participation by married women, for example, changed quickly in the United Kingdom during the 1960s and 1970s, partly because of the pill and partly because of an ideological upheaval, feminism.5 The ethics of the Roman state in the late first century BCE did not change slowly from republican to imperial.