linear programming
description: programming method to achieve the best outcome in a mathematical model
65 results

Optimization Methods in Finance
by
Gerard Cornuejols
and
Reha Tutuncu
Published 2 Jan 2006
Delayed data is available for free, so do not use the sites that charge fees for real-time data. Formulate the linear programming problem (33) (or, rather the 42 CHAPTER 3. LP MODELS AND TOOLS IN FINANCE version you developed for Problem 4 since market quotes will include bid and ask prices) to determine whether these prices contain any arbitrage opportunities. Solve this linear programming problem using an LP software. Here are some suggestions: • MATLAB has a linear programming solver that can be accessed with the command linprog. Type help linprog to find out details. • If you do not have access to any linear programming software, you can use the website http://www-neos.mcs.anl.gov/neos/ to access the Network Enable Optimization Server.
…
These two alternative approaches are not problem classes (as in LP, QP, etc.) but rather modeling techniques for addressing data uncertainty. 1.2.1 Stochastic Optimization The term stochastic optimization or stochastic programming refers to an optimization problem in which some problem data are random. The underlying optimization problem might be a linear program, an integer program, or a nonlinear program. An important case is that of stochastic linear programs. A stochastic program with recourse arises when some of the decisions (recourse actions) can be taken after the outcomes of some (or all) random events have become known. For example, a two-stage stochastic linear program with recourse can be written as follows: max (c1 )T x1 + E[max c2 (ω)T x2 (ω)] A1 x 1 = b1 (1.6) B 2 (ω)x1 + A2 (ω)x2 (ω) = b2 (ω) x1 ≥ 0, x2 (ω) ≥ 0, where the first-stage decisions are represented by vector x1 and the second-stage decisions by vector x2 (ω), which depend on the realization ω of a random event.
…
The constraints indicate that the surplus left after liability Lt is covered will be invested as follows: xi,t invested in asset i. In this formulation, x0,t are the fixed, and possibly nonzero initial positions in the different asset classes. Chapter 2 Linear Programming: Theory and Algorithms 2.1 The Linear Programming Problem One of the most common and fundamental optimization problems is the linear programming problem (LP), the problem of optimizing a linear objective function subject to linear equality and inequality constraints. A generic linear optimization problem has the following form: (LOP) minx cT x aTi x = bi , i ∈ E aTi x ≥ bi , i ∈ I, (2.1) where E and I are the index sets for linear equality and inequality constraints, respectively.
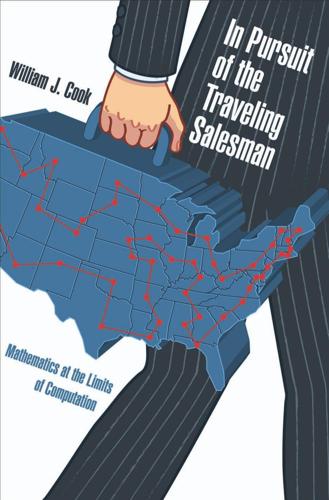
In Pursuit of the Traveling Salesman: Mathematics at the Limits of Computation
by
William J. Cook
Published 1 Jan 2011
Applications George Dantzig’s classic book Linear Programming and Extensions begins with the following statement. “The final test of a theory is its capacity to solve the problems which originated it.”10 This is a bold way to open a 600-page volume, but sixty years of experience has shown repeatedly that his theory of linear programming and the accompanying simplex algorithm pass the test beyond all expectations. The scope of the use of linear programming in industry is breathtaking, covering pretty much any sector you can name. Although it is difficult to quantify, it is clear that planning via linear programming saves enormous amounts of the world’s natural resources every day.
…
Helsgaun is the current holder of the best-known tour in the World TSP challenge, he provided the optimal tour for the record 85,900-city TSP, and his name peppers the leader board for the VLSI Test Collection.25 Not to be outdone, Nagata’s implementation of a genetic algorithm for the TSP has produced the best-known tour in the Mona Lisa TSP challenge as well as record solutions for the two largest examples in the National TSP Collection.26 If you want a good solution to a large problem, these are the people to call. 93 5: Linear Programming The development of linear programming is—in my opinion—the most important contribution of the mathematics of the 20th century to the solution of practical problems arising in industry and commerce. —Martin Grötschel, 2006.1 electing the best tour through a set of points and knowing it is the best is the full challenge of the TSP.
…
What is needed is a means to guarantee the quality of a tour, short of inspecting each permutation individually. In this context, the tool of choice is linear programming, an amazingly effective method for combining a large number of simple rules, satisfied by all tours, to obtain a single rule of the form “no tour through this point set can be shorter than X.” The number X gives an immediate quality measure: if we can also produce a tour of length X then we can be sure that it is optimal. Sounds like magic, but linear programming is indeed the method adopted in Concorde and in all of the most successful exact TSP approaches proposed to date.
The Mathematics of Banking and Finance
by
Dennis W. Cox
and
Michael A. A. Cox
Published 30 Apr 2006
Continuous Uniform Distribution Exponential Distribution 8 Normal Distribution 8.1 Introduction 8.2 Normal Distribution 8.2.1 A simple example of normal probabilities 8.2.2 A second example of normal probabilities 8.3 Addition of Normal Variables 8.4 Central Limit Theorem 8.4.1 An example of the Central Limit Theorem 8.5 Confidence Intervals for the Population Mean 8.5.1 An example of confidence intervals for the population mean 8.6 Normal Approximation to the Binomial Distribution 8.6.1 An example of the normal approximation to the binomial distribution 8.7 Normal Approximation to the Poisson Distribution 8.7.1 An example of fitting a normal curve to the Poisson distribution vii 56 57 58 59 60 60 62 64 66 67 67 67 69 69 70 70 70 71 71 72 72 72 73 9 Comparison of the Means, Sample Sizes and Hypothesis Testing 9.1 Introduction 9.2 Estimation of the Mean 9.2.1 An example of estimating a confidence interval for an experimental mean 9.3 Choice of the Sample Size 9.3.1 An example of selecting sample size 9.4 Hypothesis Testing 9.4.1 An example of hypothesis testing 9.5 Comparison of Two Sample Means 9.5.1 An example of a two-sample t test 9.6 Type I and Type II Errors 9.6.1 An example of type I and type II errors 75 75 75 10 Comparison of Variances 10.1 Introduction 10.2 Chi-Squared Test 10.2.1 An example of the chi-squared test 10.3 F Test 10.3.1 An example of the F test 10.3.2 An example considering the normal distribution 83 83 83 83 85 85 85 76 77 77 77 78 79 79 80 80 viii Contents 11 Chi-squared Goodness of Fit Test 11.1 Introduction 11.2 Contingency Tables 11.3 Multiway Tables 11.3.1 An example of a four by four table 91 91 92 94 94 12 Analysis of Paired Data 12.1 Introduction 12.2 t Test 12.3 Sign Test 12.4 The U Test 12.4.1 An example of the use of the U test 97 97 97 98 99 101 13 Linear Regression 13.1 Introduction 13.2 Linear Regression 13.3 Correlation Coefficient 13.3.1 An example of examining correlation 13.4 Estimation of the Uncertainties 13.5 Statistical Analysis and Interpretation of Linear Regression 13.6 ANOVA for Linear Regression 13.7 Equations for the Variance of a and b 13.8 Significance Test for the Slope 13.8.1 An example of slope analysis 13.8.2 A further example of correlation and linear regression 103 103 103 104 105 109 110 110 112 112 113 115 14 Analysis of Variance 14.1 Introduction 14.2 Formal Background to the ANOVA Table 14.3 Analysis of the ANOVA Table 14.4 Comparison of Two Causal Means 14.4.1 An example of extinguisher discharge times 14.4.2 An example of the lifetime of lamps 121 121 121 122 123 123 125 15 Design and Approach to the Analysis of Data 15.1 Introduction 15.2 Randomised Block Design 15.2.1 An example of outsourcing 15.3 Latin Squares 15.4 Analysis of a Randomised Block Design 15.5 Analysis of a Two-way Classification 15.5.1 An example of two-way analysis 15.5.2 An example of a randomised block 15.5.3 An example of the use of the Latin square 129 129 129 130 131 132 135 137 140 143 16 Linear Programming: Graphical Method 16.1 Introduction 149 149 Contents 16.2 Practical Examples 16.2.1 An example of an optimum investment strategy 16.2.2 An example of the optimal allocation of advertising ix 149 149 154 17 Linear Programming: Simplex Method 17.1 Introduction 17.2 Most Profitable Loans 17.2.1 An example of finance selection 17.3 General Rules 17.3.1 Standardisation 17.3.2 Introduction of additional variables 17.3.3 Initial solution 17.3.4 An example to demonstrate the application of the general rules for linear programming 17.4 The Concerns with the Approach 159 159 159 164 167 167 167 167 18 Transport Problems 18.1 Introduction 18.2 Transport Problem 171 171 171 19 Dynamic Programming 19.1 Introduction 19.2 Principle of Optimality 19.3 Examples of Dynamic Programming 19.3.1 An example of forward and backward recursion 19.3.2 A practical example of recursion in use 19.3.3 A more complex example of dynamic programming 19.3.4 The ‘Travelling Salesman’ problem 179 179 179 180 180 182 184 185 20 Decision Theory 20.1 Introduction 20.2 Project Analysis Guidelines 20.3 Minimax Regret Rule 189 189 190 192 21 Inventory and Stock Control 21.1 Introduction 21.2 The Economic Order Quantity Model 21.2.1 An example of the use of the economic order quantity model 21.3 Non-zero Lead Time 21.3.1 An example of Poisson and continuous approximation 195 195 195 196 199 200 22 Simulation: Monte Carlo Methods 22.1 Introduction 22.2 What is Monte Carlo Simulation?
…
Index a notation 103–4, 107–20, 135–47 linear regression 103–4, 107–20 slope significance test 112–20 variance 112 abscissa see horizontal axis absolute value, notation 282–4 accuracy and reliability, data 17, 47 adaptive resonance theory 275 addition, mathematical notation 279 addition of normal variables, normal distribution 70 addition rule, probability theory 24–5 additional variables, linear programming 167–70 adjusted cash flows, concepts 228–9 adjusted discount rates, concepts 228–9 Advanced Measurement Approach (AMA) 271 advertising allocation, linear programming 154–7 air-conditioning units 182–5 algorithms, neural networks 275–6 alternatives, decisions 191–4 AMA see Advanced Measurement Approach analysis data 47–52, 129–47, 271–4 Latin squares 131–2, 143–7 linear regression 110–20 projects 190–2, 219–25, 228–34 randomised block design 129–35 sampling 47–52, 129–47 scenario analysis 40, 193–4, 271–4 trends 235–47 two-way classification 135–47 variance 110–20, 121–7 anonimised databases, scenario analysis 273–4 ANOVA (analysis of variance) concepts 110–20, 121–7, 134–47 examples 110–11, 123–7, 134–40 formal background 121–2 linear regression 110–20 randomised block design 134–5, 141–3 tables 110–11, 121–3, 134–47 two-way classification 136–7 appendix 279–84 arithmetic mean, concepts 37–45, 59–60, 65–6, 67–74, 75–81 assets classes 149–57 reliability 17, 47, 215–18, 249–60 replacement of assets 215–18, 249–60 asymptotic distributions 262 ATMs 60 averages see also mean; median; mode concepts 37–9 b notation 103–4, 107–20, 132–5 linear regression 103–4, 107–20 variance 112 back propagation, neural networks 275–7 backwards recursion 179–87 balance sheets, stock 195 bank cashier problem, Monte Carlo simulation 209–12 Bank for International Settlements (BIS) 267–9, 271 banks Basel Accord 262, 267–9, 271 failures 58 loss data 267–9, 271–4 modelling 75–81, 85, 97, 267–9, 271–4 profitable loans 159–66 bar charts comparative data 10–12 concepts 7–12, 54, 56, 59, 205–6, 232–3 discrete data 7–12 examples 9–12, 205–6, 232–3 286 Index bar charts (cont.) narrative explanations 10 relative frequencies 8–12 rules 8–9 uses 7–12, 205–6, 232–3 base rates, trends 240 Basel Accord 262, 267–9, 271 bathtub curves, reliability concepts 249–51 Bayes’theorem, probability theory 27–30, 31 bell-shaped normal distribution see normal distribution bi-directional associative memory 275 bias 1, 17, 47–50, 51–2, 97, 129–35 randomised block design 129–35 sampling 17, 47–50, 51–2, 97, 129–35 skewness 41–5 binomial distribution concepts 55–8, 61–5, 71–2, 98–9, 231–2 examples 56–8, 61–5, 71–2, 98–9 net present value (NPV) 231–2 normal distribution 71–2 Pascal’s triangle 56–7 uses 55, 57, 61–5, 71–2, 98–9, 231–2 BIS see Bank for International Settlements boards of directors 240–1 break-even analysis, concepts 229–30 Brownian motion 22 see also random walks budgets 149–57 calculators, log functions 20, 61 capital Basel Accord 262, 267–9, 271 cost of capital 219–25, 229–30 cash flows adjusted cash flows 228–9 future cash flows 219–25, 227–34, 240–1 net present value (NPV) 219–22, 228–9, 231–2 standard deviation 232–4 central limit theorem concepts 70, 75 examples 70 chi-squared test concepts 83–4, 85, 89, 91–5 contingency tables 92–5 examples 83–4, 85, 89, 91–2 goodness of fit test 91–5 multi-way tables 94–5 tables 84, 91 Chu Shi-Chieh’s Ssu Yuan Y Chien 56 circles, tree diagrams 30–5 class intervals concepts 13–20, 44–5, 63–4, 241–7 histograms 13–20, 44–5 mean calculations 44–5 mid-points 44–5, 241–7 notation 13–14, 20 Sturges’s formula 20 variance calculations 44–5 classical approach, probability theory 22, 27 cluster sampling 50 coin-tossing examples, probability theory 21–3, 53–4 collection techniques, data 17, 47–52, 129–47 colours, graphical presentational approaches 9 combination, probability distribution (density) functions 54–8 common logarithm (base 10) 20 communications, decisions 189–90 comparative data, bar charts 10–12 comparative histograms see also histograms examples 14–19 completed goods 195 see also stock . . . conditional probability, concepts 25–7, 35 confidence intervals, concepts 71, 75–81, 105, 109, 116–20, 190, 262–5 constraining equations, linear programming 159–70 contingency tables, concepts 92–5 continuous approximation, stock control 200–1 continuous case, failures 251 continuous data concepts 7, 13–14, 44–5, 65–6, 251 histograms 7, 13–14 continuous uniform distribution, concepts 64–6 correlation coefficient concepts 104–20, 261–5, 268–9 critical value 105–6, 113–20 equations 104–5 examples 105–8, 115–20 costs capital 219–25, 229–30 dynamic programming 180–82 ghost costs 172–7 holding costs 182–5, 197–201, 204–8 linear programming 167–70, 171–7 sampling 47 stock control 182–5, 195–201 transport problems 171–7 trend analysis 236–47 types 167–8, 182 counting techniques, probability distribution (density) functions 54 covariance see also correlation coefficient concepts 104–20, 263–5 credit cards 159–66, 267–9 credit derivatives 97 see also derivatives Index credit risk, modelling 75, 149, 261–5 critical value, correlation coefficient 105–6, 113–20 cumulative frequency polygons concepts 13–20, 39–40, 203 examples 14–20 uses 13–14 current costs, linear programming 167–70 cyclical variations, trends 238–47 data analysis methods 47–52, 129–47, 271–4 collection techniques 17, 47–52, 129–47 continuous/discrete types 7–12, 13–14, 44–5, 53–5, 65–6, 72, 251 design/approach to analysis 129–47 errors 129–47 graphical presentational approaches 1–20, 149–57 identification 2–5, 261–5 Latin squares 131–2, 143–7 loss data 267–9, 271–4 neural networks 275–7 qualities 17, 47 randomised block design 129–35 reliability and accuracy 17, 47 sampling 17, 47–52 time series 235–47 trends 5, 10, 235–47 two-way classification analysis 135–47 data points, scatter plots 2–5 databases, loss databases 272–4 debentures 149–57 decisions alternatives 191–4 Bayes’theorem 27–30, 31 communications 189–90 concepts 21–35, 189–94, 215–25, 228–34, 249–60 courses of action 191–2 definition 21 delegation 189–90 empowerment 189–90 guesswork 191 lethargy pitfalls 189 minimax regret rule 192–4 modelling problems 189–91 Monty Hall problem 34–5, 212–13 pitfalls 189–94 probability theory 21–35, 53–66, 189–94, 215–18 problem definition 129, 190–2 project analysis guidelines 190–2, 219–25, 228–34 replacement of assets 215–18, 249–60 staff 189–90 287 steps 21 stock control 195–201, 203–8 theory 189–94 degrees of freedom 70–1, 75–89, 91–5, 110–20, 136–7 ANOVA (analysis of variance) 110–20, 121–7, 136–7 concepts 70–1, 75–89, 91–5, 110–20, 136–7 delegation, decisions 189–90 density functions see also probability distribution (density) functions concepts 65–6, 67, 83–4 dependent variables, concepts 2–5, 103–20, 235 derivatives 58, 97–8, 272 see also credit . . . ; options design/approach to analysis, data 129–47 dice-rolling examples, probability theory 21–3, 53–5 differentiation 251 discount factors adjusted discount rates 228–9 net present value (NPV) 220–1, 228–9, 231–2 discrete data bar charts 7–12, 13 concepts 7–12, 13, 44–5, 53–5, 72 discrete uniform distribution, concepts 53–5 displays see also presentational approaches data 1–5 Disraeli, Benjamin 1 division notation 280, 282 dynamic programming complex examples 184–7 concepts 179–87 costs 180–82 examples 180–87 principle of optimality 179–87 returns 179–80 schematic 179–80 ‘travelling salesman’ problem 185–7 e-mail surveys 50–1 economic order quantity see also stock control concepts 195–201 examples 196–9 empowerment, staff 189–90 error sum of the squares (SSE), concepts 122–5, 133–47 errors, data analysis 129–47 estimates mean 76–81 probability theory 22, 25–6, 31–5, 75–81 Euler, L. 131 288 Index events independent events 22–4, 35, 58, 60, 92–5 mutually exclusive events 22–4, 58 probability theory 21–35, 58–66, 92–5 scenario analysis 40, 193–4, 271–4 tree diagrams 30–5 Excel 68, 206–7 exclusive events see mutually exclusive events expected errors, sensitivity analysis 268–9 expected value, net present value (NPV) 231–2 expert systems 275 exponent notation 282–4 exponential distribution, concepts 65–6, 209–10, 252–5 external fraud 272–4 extrapolation 119 extreme value distributions, VaR 262–4 F distribution ANOVA (analysis of variance) 110–20, 127, 134–7 concepts 85–9, 110–20, 127, 134–7 examples 85–9, 110–20, 127, 137 tables 85–8 f notation 8–9, 13–20, 26, 38–9, 44–5, 65–6, 85 factorial notation 53–5, 283–4 failure probabilities see also reliability replacement of assets 215–18, 249–60 feasibility polygons 152–7, 163–4 finance selection, linear programming 164–6 fire extinguishers, ANOVA (analysis of variance) 123–7 focus groups 51 forward recursion 179–87 four by four tables 94–5 fraud 272–4, 276 Fréchet distribution 262 frequency concepts 8–9, 13–20, 37–45 cumulative frequency polygons 13–20, 39–40, 203 graphical presentational approaches 8–9, 13–20 frequentist approach, probability theory 22, 25–6 future cash flows 219–25, 227–34, 240–1 fuzzy logic 276 Garbage In, Garbage Out (GIGO) 261–2 general rules, linear programming 167–70 genetic algorithms 276 ghost costs, transport problems 172–7 goodness of fit test, chi-squared test 91–5 gradient (a notation), linear regression 103–4, 107–20 graphical method, linear programming 149–57, 163–4 graphical presentational approaches concepts 1–20, 149–57, 235–47 rules 8–9 greater-than notation 280–4 Greek alphabet 283 guesswork, modelling 191 histograms 2, 7, 13–20, 41, 73 class intervals 13–20, 44–5 comparative histograms 14–19 concepts 7, 13–20, 41, 73 continuous data 7, 13–14 examples 13–20, 73 skewness 41 uses 7, 13–20 holding costs 182–5, 197–201, 204–8 home insurance 10–12 Hopfield 275 horizontal axis bar charts 8–9 histograms 14–20 linear regression 103–4, 107–20 scatter plots 2–5, 103 hypothesis testing concepts 77–81, 85–95, 110–27 examples 78–80, 85 type I and type II errors 80–1 i notation 8–9, 13–20, 28–30, 37–8, 103–20 identification data 2–5, 261–5 trends 241–7 identity rule 282 impact assessments 21, 271–4 independent events, probability theory 22–4, 35, 58, 60, 92–5 independent variables, concepts 2–5, 70, 103–20, 235 infinity, normal distribution 67–72 information, quality needs 190–4 initial solution, linear programming 167–70 insurance industry 10–12, 29–30 integers 280–4 integration 65–6, 251 intercept (b notation), linear regression 103–4, 107–20 interest rates base rates 240 daily movements 40, 261 project evaluation 219–25, 228–9 internal rate of return (IRR) concepts 220–2, 223–5 examples 220–2 interpolation, IRR 221–2 interviews, uses 48, 51–2 inventory control see stock control Index investment strategies 149–57, 164–6, 262–5 IRR see internal rate of return iterative processes, linear programming 170 j notation 28–30, 37, 104–20, 121–2 JP Morgan 263 k notation 20, 121–7 ‘know your customer’ 272 Kohonen self-organising maps 275 Latin squares concepts 131–2, 143–7 examples 143–7 lead times, stock control 195–201 learning strategies, neural networks 275–6 less-than notation 281–4 lethargy pitfalls, decisions 189 likelihood considerations, scenario analysis 272–3 linear programming additional variables 167–70 concepts 149–70 concerns 170 constraining equations 159–70 costs 167–70, 171–7 critique 170 examples 149–57, 159–70 finance selection 164–6 general rules 167–70 graphical method 149–57, 163–4 initial solution 167–70 iterative processes 170 manual preparation 170 most profitable loans 159–66 optimal advertising allocation 154–7 optimal investment strategies 149–57, 164–6 returns 149–57, 164–6 simplex method 159–70, 171–2 standardisation 167–70 time constraints 167–70 transport problems 171–7 linear regression analysis 110–20 ANOVA (analysis of variance) 110–20 concepts 3, 103–20 equation 103–4 examples 107–20 gradient (a notation) 103–4, 107–20 intercept (b notation) 103–4, 107–20 interpretation 110–20 notation 103–4 residual sum of the squares 109–20 slope significance test 112–20 uncertainties 108–20 literature searches, surveys 48 289 loans finance selection 164–6 linear programming 159–66 risk assessments 159–60 log-normal distribution, concepts 257–8 logarithms (logs), types 20, 61 losses, banks 267–9, 271–4 lotteries 22 lower/upper quartiles, concepts 39–41 m notation 55–8 mail surveys 48, 50–1 management information, graphical presentational approaches 1–20 Mann–Whitney test see U test manual preparation, linear programming 170 margin of error, project evaluation 229–30 market prices, VaR 264–5 marketing brochures 184–7 mathematics 1, 7–8, 196–9, 219–20, 222–5, 234, 240–1, 251, 279–84 matrix plots, concepts 2, 4–5 matrix-based approach, transport problems 171–7 maximum and minimum, concepts 37–9, 40, 254–5 mean comparison of two sample means 79–81 comparisons 75–81 concepts 37–45, 59–60, 65–6, 67–74, 75–81, 97–8, 100–2, 104–27, 134–5 confidence intervals 71, 75–81, 105, 109, 116–20, 190, 262–5 continuous data 44–5, 65–6 estimates 76–81 hypothesis testing 77–81 linear regression 104–20 normal distribution 67–74, 75–81, 97–8 sampling 75–81 mean square causes (MSC), concepts 122–7, 134–47 mean square errors (MSE), ANOVA (analysis of variance) 110–20, 121–7, 134–7 median, concepts 37, 38–42, 83, 98–9 mid-points class intervals 44–5, 241–7 moving averages 241–7 minimax regret rule, concepts 192–4 minimum and maximum, concepts 37–9, 40 mode, concepts 37, 39, 41 modelling banks 75–81, 85, 97, 267–9, 271–4 concepts 75–81, 83, 91–2, 189–90, 195–201, 215–18, 261–5 decision-making pitfalls 189–91 economic order quantity 195–201 290 Index modelling (cont.) guesswork 191 neural networks 275–7 operational risk 75, 262–5, 267–9, 271–4 output reviews 191–2 replacement of assets 215–18, 249–60 VaR 261–5 moments, density functions 65–6, 83–4 money laundering 272–4 Monte Carlo simulation bank cashier problem 209–12 concepts 203–14, 234 examples 203–8 Monty Hall problem 212–13 queuing problems 208–10 random numbers 207–8 stock control 203–8 uses 203, 234 Monty Hall problem 34–5, 212–13 moving averages concepts 241–7 even numbers/observations 244–5 moving totals 245–7 MQMQM plot, concepts 40 MSC see mean square causes MSE see mean square errors multi-way tables, concepts 94–5 multiplication notation 279–80, 282 multiplication rule, probability theory 26–7 multistage sampling 50 mutually exclusive events, probability theory 22–4, 58 n notation 7, 20, 28–30, 37–45, 54–8, 103–20, 121–7, 132–47, 232–4 n!

The Golden Ticket: P, NP, and the Search for the Impossible
by
Lance Fortnow
Published 30 Mar 2013
Optimizing your choices given these kinds of requirements is a problem known as linear programming. The set of possible solutions forms what is known as a polytope in high-dimensional space. Back in 1947, Georg Dantzig created the simplex method, which solves the linear programming problem pretty quickly. The simplex algorithm takes a walk along the edges of the polytope until it finds the optimal solutions. Given the simplex algorithm, why do I put the linear programming problem in this category? Because the simplex algorithm may not solve linear programming quickly in some rare instances. In 1979, Leonid Khachiyan created the ellipsoid algorithm, which chops up the polytope into smaller and smaller pieces until it narrows it down to the optimal solution.
…
In 1979, Leonid Khachiyan created the ellipsoid algorithm, which chops up the polytope into smaller and smaller pieces until it narrows it down to the optimal solution. Kahachiyan gives a proof of efficiency of the ellipsoid algorithm, putting linear programming in P. However, the ellipsoid algorithm takes much longer than simplex in practice. The ellipsoid algorithm did inspire many other more complex algorithms in the decades to come, making the ellipsoid algorithm an extremely influential one. Figure 4-12. Polytope. So the linear programming problem has good algorithms in theory and practice—they just happen to be two very different algorithms. In 1984, Narendra Karmarkar developed the interior point algorithm.
…
Computer scientists don’t believe that factoring is in P, nor do we believe that factoring is NP-complete. Factoring is a difficult problem, but maybe not as hard as satisfiability or map coloring. The importance of primes and factoring goes way beyond mathematicians loving their numbers. Much of modern cryptography uses numbers that seem hard to factor, the topic of chapter 8. Linear Programming Frenemy Fancy Franks sells four varieties of sausages: frankfurters, Italian, bratwurst, and chorizo. Each kind of sausage has various ingredients with different costs. Different sausages take different times to manufacture, and they sell at different prices. How much of each sausage should Frenemy Fancy Franks make in order to maximize profits?
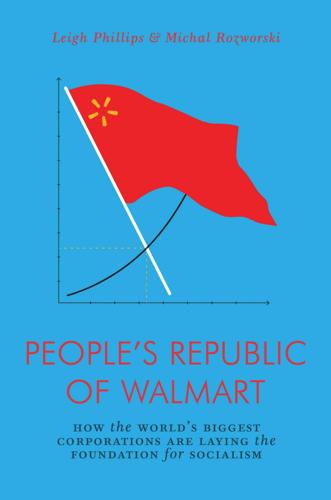
The People's Republic of Walmart: How the World's Biggest Corporations Are Laying the Foundation for Socialism
by
Leigh Phillips
and
Michal Rozworski
Published 5 Mar 2019
A third individual, US mathematician George Dantzig, again independently of the other two but slightly later, just after the war, developed a formulation of linear programming to solve planning problems for the US Air Force. In 1947, he devised the “simplex method,” or simplex algorithm, within linear programming. It would quickly be adopted by industries for their internal planning, and it remains in use today; New Scientist magazine recently called this American twist on the question of Soviet optimization “the algorithm that rules the world.” Mirroring the American arch-capitalists who saved the work of Leontief, in the Soviet Union, it was military specialists who were the first to delve into linear programming, as they were the only ones with access to foreign texts on the subject, translated into Russian though not yet published domestically.
…
This Cold War performance of dressing up American economics in Soviet drag, and vice versa, even to the point of it taking a vast and venerable American conglomerate to rescue a Soviet economic technique, entirely out of self-interest, is a trope that we will see repeated over and over. The initial development of linear programming, a branch of mathematics today available to an undergraduate in any discipline with a couple years’ worth of math, was heavily influenced by input-output analysis. Simply put, linear programming explores methods to find the best outcome given a series of constraints. It would go on to be adopted widely within microeconomics and within corporations in the West to plan production, transportation, technology and indeed any tasks that involve multiple variables and that aim at maximization of profits while minimizing costs and resources.
…
It would go on to be adopted widely within microeconomics and within corporations in the West to plan production, transportation, technology and indeed any tasks that involve multiple variables and that aim at maximization of profits while minimizing costs and resources. Firms routinely use linear programming tools to solve complex decision problems involved in supply chain logistics, production scheduling, transportation, or any form of resource allocation. Developed in the Soviet Union by Leonid Kantorovich and published in a 1939 booklet, Mathematical Methods of Organizing and Planning Production, the discovery of linear programming followed a request from a plywood factory that wanted to optimize production. The technique, by taking data from input-output matrices, offered a way to solve a whole class of similar conundrums.
Algorithms in C++ Part 5: Graph Algorithms
by
Robert Sedgewick
Published 2 Jan 1992
For example, the equation x8x7 +. 32 means that job 8 cannot start until job 7 is completed. Linear programming Assign nonnegative values to a set of variables x 0 through x n that minimize the value of a specified linear combination of the variables, subject to a set of constraints on the variables, each of which specifies that a given linear combination of the variables must be greater than or equal to a given constant. Linear programming is a widely used general approach to solving a broad class of optimization problems that we will not consider it in detail until Part 8. Clearly, the difference-constraints problem reduces to linear programming, as do many other problems.
…
We emphasize the general relevance of the problems that we consider, and the general applicability of the algorithms that solve them, by reducing other problems to them. It is also important to be aware of a hierarchy among increasingly general problem-formulation models. For example, linear programming is a general formulation that is important not just because many problems reduce to it but also because it is not known to be NP-hard. In other words, there is no known way to reduce the general shortest-paths problem (or any other NP-hard problem) to linear programming. We discuss such issues in Part 8. Not all problems can be solved, but good general models have been devised that are suitable for broad classes of problems that we do know how to solve.
…
Your goal is to generate nontrivial problems that are likely to be feasible. 21.116 Modify your interface and implementations from Exercise 21.101 to give clients the ability to pose and solve job-scheduling problems that include deadlines, using a reduction to the shortest-paths problem. • 21.117 Explain why the following argument is invalid: The shortest-paths problem reduces to the difference-constraints problem by the construction used in the proof of Property 21.15, and the difference-constraints problem reduces trivially to linear programming, so, by Property 21.17, linear programming is NP-hard. 21.118 Does the shortest-paths problem in networks with no negative cycles reduce to the job-scheduling problem with deadlines? (Are the two problems equivalent?) Prove your answer. • 21.119 Find the lowest-weight cycle (best arbitrage opportunity) in the example shown in Figure 21.27
Capital Ideas: The Improbable Origins of Modern Wall Street
by
Peter L. Bernstein
Published 19 Jun 2005
Markowitz’s reflections on diversification and risk led him to explore the subject more thoroughly in a linear programming course he was taking under Koopmans. Koopmans had asked the class to describe a resource allocation problem and state whether or not it was a linear programming problem. Markowitz took the occasion to analyze the choices facing an investor who must decide between seeking high returns and attempting to hold down risk at the same time. He concluded that the solution to this problem was even more complex than linear programming. Koopmans gave him an A on his paper and noted, “The problem does not seem that hard.
…
A Dutch economist, originally trained as a theoretical physicist, Koopmans later turned to the application to economics of complex statistical techniques; he shared the Nobel Prize in economic sciences in 1975 for his work in this area. Koopmans developed an analytic method known as linear programming or activity analysis that falls under the general heading of operations research. Linear programming solves problems that involve combinations of inputs and outputs. Assume, for example, that an airline has a limited number of airplanes, hours of flying time, crew availabilities, and gates at airports along its routes. How many flights a day to how many locations can the airline make?
…
If it aims to make, say, 200 flights a day, how can it minimize the necessary amount of flying time and crew time and number of airplanes? How would the answers to these questions differ if the airline wanted to make economizing on crew time its most important objective? Or if it wanted to make as many landings as possible in the New York City area? Linear programming identifies the combinations of inputs and outputs that are achievable, defines the combinations that minimize the inputs and maximize the outputs, and then identifies the trade-offs required if one element is increased or decreased relative to the others. When the time came to choose a topic for his doctoral dissertation, Markowitz went to see Jacob Marschak, who had preceded Koopmans as director of the Cowles Commission.

Red Plenty
by
Francis Spufford
Published 1 Jan 2007
Kantorovich’s first step was to realise that he had a criterion for choosing between the infinite solutions, in the knowledge that a + b + c + d, the total amount of work done by the machines, was to be minimised for the production of the target output of plywood in the Plywood Trust’s plan. Or you could turn the problem around, and see yourself as maximising the output target. For a textbook explanation of linear programming, adapted to American business-school students, see Saul I. Gass, Linear Programming: Methods and Applications (NewYork: McGraw-Hill, 4th edn, 1975). 7 Skyscrapers in Manhattan, and the promise of more in Moscow: for the promise of the Stalinist future, see Lev Kopelev, The Education of a True Believer (New York, 1980), quoted in Fitzpatrick, Everyday Stalinism, p. 18; for specifically architectural visions of the future, see the website Unrealised Moscow, www.muar.ru/ve/2003/moscow/index_e. htm, a gathering of the kind of images whose hypnagogic power, taken collectively, is horribly well realised in Jack Womack, Let’s Put the Future Behind Us (New York: Atlantic Monthly Press, 1996). 8 An extra 3% year after year, compounded: in an economy that consumed all the goods it produced, the 3% of extra output Kantorovich anticipates here would only have contributed a simple boost to production, not a compounding addition to the growth rate.
…
I’m sure we’re all aware that a greater degree of quantitative analysis is essential to the refinement of our planning; and you have provided tools which, in limited areas, can clearly be of great assistance. In the same way, it’s a matter of pride for all of us, I’m sure, that you should have independently originated the principles of, of –’ ‘– linear programming –’ ‘Thank you, linear programming, here in the Soviet Union, before it was discovered by scientists in the imperialist countries. Yet economics is not a science of quantity alone, is it? It is pre-eminently a science of quality, the science of quality, in which the meaning of economic phenomena, not just their magnitude, is revealed; and revealed how?
…
Kantorovich’s first step was to realise that he had a criterion for choosing between the infinite solutions, in the knowledge that a + b + c + d, the total amount of work done by the machines, was to be minimised for the production of the target output of plywood in the Plywood Trust’s plan. Or you could turn the problem around, and see yourself as maximising the output target. For a textbook explanation of linear programming, adapted to American business-school students, see Saul I. Gass, Linear Programming: Methods and Applications (NewYork: McGraw-Hill, 4th edn, 1975). 7 Skyscrapers in Manhattan, and the promise of more in Moscow: for the promise of the Stalinist future, see Lev Kopelev, The Education of a True Believer (New York, 1980), quoted in Fitzpatrick, Everyday Stalinism, p. 18; for specifically architectural visions of the future, see the website Unrealised Moscow, www.muar.ru/ve/2003/moscow/index_e. htm, a gathering of the kind of images whose hypnagogic power, taken collectively, is horribly well realised in Jack Womack, Let’s Put tuture Behind Us (New York: Atlantic Monthly Press, 1996). 8 An extra 3% year after year, compounded: in an economy that consumed all the goods it produced, the 3% of extra output Kantorovich anticipates here would only have contributed a simple boost to production, not a compounding addition to the growth rate.

In Pursuit of the Perfect Portfolio: The Stories, Voices, and Key Insights of the Pioneers Who Shaped the Way We Invest
by
Andrew W. Lo
and
Stephen R. Foerster
Published 16 Aug 2021
In his course with Koopmans on activity analysis, Markowitz had been exposed to the concept of linear programming, a technique for which Koopmans is credited as a codiscoverer.35 Linear programming is a method for determining an optimal outcome for a given model, particularly useful for those models that involve trade-offs. Koopmans had asked the class to describe a resource allocation problem and determine whether linear programming was a suitable technique to apply to such a problem.36 Markowitz described the case of an investor seeking high returns while attempting to mitigate his risk, but he concluded that the situation wasn’t appropriate for linear programming. He received an A on the assignment, but Koopmans encouraged him to try to solve the problem regardless, which provided Markowitz with further motivation for his dissertation topic.
…
.… Milton Friedman was on the right side as you came out of the elevator, and the Cowles Commission was on the left side—and I believe that was deliberate—but the left side won a lot more Nobel Prizes than the right side.”17 At the time, however, Markowitz described the commission in simpler terms, as a “small but exciting group” then led by its director, Koopmans, with Marschak as its former director.18 “I stumbled into economics, and I stumbled into economics at the University of Chicago, and I had no idea I was about to be a part of something that was going to crank out Nobel Prizes.”19 As background reading for his dissertation, Marschak had provided Markowitz with a copy of Cowles’s 1932 forecasting paper and a 1938 monograph on the history of the stock market.20 Marschak then referred him to the dean of the business school, Marshall Ketchum, for a list of suggested readings. Markowitz had never taken a course in finance before, although he had taken statistics and linear programming from Koopmans. Ketchum suggested Graham and Dodd’s now classic book Security Analysis,21 Wiesenberger’s survey of investment companies22 to provide basic background information on the industry, and another classic, less well known today, John Burr Williams’s The Theory of Investment Value.23 In his book, Williams referred to the area of investments as a new subscience of economics, addressing it to “the intelligent investor and the professional investment analyst.”
…
On the same day that Markowitz read Williams’s book in the business library, he drew a simple graph. Since he was dealing with two quantities, expected return and risk, he placed the expected return of a stock on the horizontal axis and its risk on the vertical axis and began constructing his first portfolios.37 Koopmans, in his course on linear programming, distinguished between efficient and inefficient combinations of production activities: efficient in the sense that you couldn’t get more of one thing without giving up something of something else, a classic trade-off. Markowitz labeled his portfolios of stocks as either efficient combinations of return and risk or inefficient combinations that were dominated by other combinations.

Television disrupted: the transition from network to networked TV
by
Shelly Palmer
Published 14 Apr 2006
• Because cable systems and satellite systems offer similar services, they fiercely compete for subscribers. • Television content is packaged in one of these basic ways: free, hybrid subscription, pure subscription, pay-per-view, rental and purchase. • The major components of the television business are form factors, packaging and distribution. • Linear programming is scheduled for consumers, Non-linear programming is on-demand. • There are highly evolved business rules and negotiable currencies used in the traditional television business, and these must evolve for networked, non-linear or on-demand businesses Copyright © 2006, Shelly Palmer. All rights reserved. 1-Television.Chap One v3sp.qxd 3/20/06 7:19 AM Page 24 2-Television.Chap Two v3.qxd 3/20/06 7:34 AM Page 25 2 Disrupting Television Using Existing Network Technologies In this chapter, let’s use the term “disruptive technology” to describe a system or methodology that allows the viewer to take control away from the programmers or distributors.
…
You package a form factor to make it salable. The most popular television packaging options are: Linear day-parts (early morning, daytime, family time, prime time access, etc.) Pay Per View • On-demand • Subscription • Ad-supported Distribution Traditional network television was developed to deliver linear programming using a fairly efficient one-to-many system. Alternatively, networked television systems offer one-to-one and optionally, non-linear distribution. Linear Distribution Methodology • Broadcast television – analog or DTT • Cable Television – basic or premium • Satellite television • Internet Protocol Television (IPTV) • IP Video • Public Internet Non-Linear Distribution Methodology • Video On Demand (VOD, SVOD, FVOD, Near-VOD) • Consumer-based time-shifted (personal video recorder, TiVo®, Media Center) Technically speaking, all of the linear methodologies could be used to distribute non-linear programming as well.
…
Linear Distribution Methodology • Broadcast television – analog or DTT • Cable Television – basic or premium • Satellite television • Internet Protocol Television (IPTV) • IP Video • Public Internet Non-Linear Distribution Methodology • Video On Demand (VOD, SVOD, FVOD, Near-VOD) • Consumer-based time-shifted (personal video recorder, TiVo®, Media Center) Technically speaking, all of the linear methodologies could be used to distribute non-linear programming as well. But in common practice, only cable, IPTV and the Internet are used to do so. Copyright © 2006, Shelly Palmer. All rights reserved. 1-Television.Chap One v3sp.qxd 3/20/06 7:19 AM Page 21 Linear Video – Good “Old-Fashioned” TV 21 Linear Video – Good “Old-Fashioned” TV Linear video for television (analog broadcast or DTT) and cable (basic or premium) is what most people think of as “good old-fashioned TV.”
How to Create a Mind: The Secret of Human Thought Revealed
by
Ray Kurzweil
Published 13 Nov 2012
We could fill up our entire neocortex with repeated patterns of the [E] phoneme. There is a limit, however, to useful redundancy, and a common pattern such as this clearly has reached it. There is a mathematical solution to this optimization problem called linear programming, which solves for the best possible allocation of limited resources (in this case, a limited number of pattern recognizers) that would represent all of the cases on which the system has trained. Linear programming is designed for systems with one-dimensional inputs, which is another reason why it is optimal to represent the input to each pattern recognition module as a linear string of inputs. We can use this mathematical approach in a software system, and though an actual brain is further constrained by the physical connections it has available that it can adapt between pattern recognizers, the method is nonetheless similar.
…
The algorithms that we use today for speech recognition, for natural language translation, for chess playing, for logistics planning, have evolved remarkably in the past decade…. Here is just one example, provided by Professor Martin Grötschel of Konrad-Zuse-Zentrum für Informationstechnik Berlin. Grötschel, an expert in optimization, observes that a benchmark production planning model solved using linear programming would have taken 82 years to solve in 1988, using the computers and the linear programming algorithms of the day. Fifteen years later—in 2003—this same model could be solved in roughly 1 minute, an improvement by a factor of roughly 43 million. Of this, a factor of roughly 1,000 was due to increased processor speed, whereas a factor of roughly 43,000 was due to improvements in algorithms!
…
Our systems from the 1980s and 1990s automatically pruned connections with connection weights below a certain level and also allowed for making new connections to better model the training data and to learn on the fly. A key requirement, I believe, is to allow for the system to flexibly create its own topologies based on the patterns it is exposed to while learning. We can use the mathematical technique of linear programming to optimally assign connections to new pattern recognizers. Our digital brain will also accommodate substantial redundancy of each pattern, especially ones that occur frequently. This allows for robust recognition of common patterns and is also one of the key methods to achieving invariant recognition of different forms of a pattern.

Artificial Intelligence: A Modern Approach
by
Stuart Russell
and
Peter Norvig
Published 14 Jul 2019
For example, in our airport-siting problem, we might constrain sites to be inside Romania and on dry land (rather than in the middle of lakes). The difficulty of constrained optimization problems depends on the nature of the constraints and the objective function. The best-known category is that of linear programming problems, in which constraints must be linear inequalities forming a convex set4 and the objective function is also linear. The time complexity of linear programming is polynomial in the number of variables. Linear programming is probably the most widely studied and broadly useful method for optimization. It is a special case of the more general problem of convex optimization, which allows the constraint region to be any convex region and the objective to be any function that is convex within the constraint region.
…
The general family of prioritized sweeping algorithms aims to speed up convergence to optimal policies by heuristically ordering the value and policy update calculations (Moore and Atkeson, 1993; Andre et al., 1998; Wingate and Seppi, 2005). The formulation of MDP-solving as a linear program is due to de Ghellinck (1960), Manne (1960), and D’Épenoux (1963). Although linear programming has traditionally been considered inferior to dynamic programming as an exact solution method for MDPs, de Farias and Roy (2003) show that it is possible to use linear programming and a linear representation of the utility function to obtain provably good approximate solutions to very large MDPs. Papadimitriou and Tsitsiklis (1987) and Littman et al. (1995) provide general results on the computational complexity of MDPs.
…
For example, the scheduling of experiments on the Hubble Space Telescope requires very precise timing of observations; the start and finish of each observation and maneuver are continuous-valued variables that must obey a variety of astronomical, precedence, and power constraints. The best-known category of continuous-domain CSPs is that of linear programming problems, where constraints must be linear equalities or inequalities. Linear programming problems can be solved in time polynomial in the number of variables. Problems with different types of constraints and objective functions have also been studied—quadratic programming, second-order conic programming, and so on. These problems constitute an important area of applied mathematics.

How Not to Network a Nation: The Uneasy History of the Soviet Internet (Information Policy)
by
Benjamin Peters
Published 2 Jun 2016
During the early 1960s, a third camp of thought about national economic reform began to coalesce. The economic cyberneticists championed what might be called planometrics, or a combination and application of econometric mathematical tools that included input-output models (not dissimilar from planned supply and demand), linear programming, and sophisticated statistics to the problem of economic planning. Like the liberal reforms, the economic mathematicians, cyberneticists, and econometrists comprising this loose camp conceived of the command economy as a vast information-coordination problem. Unlike the liberal economists, however, the cyberneticists were less concerned with reducing the complexity of the economy understood as an information system to a single golden index.
…
Suppose that farmers—or after Stalin in the 1930s, the managers of a collectivized farm—distribute crops across their fields and that the farmers know the cost of fertilizer and pesticide, the cost of planting, and the selling price of wheat and barley. A linear programmer can determine how much land they should devote to each to optimize their annual yield. Linear modeling—now evolved into the field of linear programming—allows the farm managers to calculate in matrix form the maximum revenue, or profit, that they can expect from their available resources and to know how best to distribute their crops (for example, how much barley and how much wheat to plant).28 Figure 2.1 Leonid Kantorovich Economists worldwide recognized the promise of this profit-by-planning model, especially after Kantorovich in 1939 and George Dantzig in 1947 separately took pains to propose methods that could scale to much larger problem sets.
…
The scaling successes of economic cybernetics in the late 1950s suggested to Anatoly Kitov, Vasily Nemchinov, Viktor Glushkov, and others that economic planning methods should be applied nationally—perhaps even, as Kitov advised, in a real-time network of computers. The promise of the scalability of the linear programming and computational methods bolstered the political appeal of the supposedly apolitical planometric calculation. The next step with a scalable computational tool is to scale it all the way up, and that would require a communication infrastructure—computer networks—for processing the nation’s economic coordination problems.

Site Reliability Engineering: How Google Runs Production Systems
by
Betsy Beyer
,
Chris Jones
,
Jennifer Petoff
and
Niall Richard Murphy
Published 15 Apr 2016
Auxon collects this information either via a user configuration language or via a programmatic API, thus translating human intent into machine-parseable constraints. Requirements can be prioritized, a feature that’s useful if resources are insufficient to meet all requirements, and therefore trade-offs must be made. These requirements—the intent—are ultimately represented internally as a giant mixed-integer or linear program. Auxon solves the linear program, and uses the resultant bin packing solution to formulate an allocation plan for resources. Figure 18-1 and the explanations that follow it outline Auxon’s major components. Figure 18-1. The major components of Auxon Performance Data describes how a service scales: for every unit of demand X in cluster Y, how many units of dependency Z are used?
…
Resource Supply provides data about the availability of base-level, fundamental resources: for example, the number of machines expected to be available for use at a particular point in the future. In linear program terminology, the resource supply acts as an upper bound that limits how services can grow and where services can be placed. Ultimately, we want to make the best use of this resource supply as the intent-based description of the combined group of services allows. Resource Pricing provides data about how much base-level, fundamental resources cost. For instance, the cost of machines may vary globally based upon the space/power charges of a given facility. In linear program terminology, the prices inform the overall calculated costs, which act as the objective that we want to minimize.
…
It applies light sanity checking to the configuration, and is designed to act as the gateway between the human-configurable intent definition and the machine-parseable optimization request. Auxon Solver is the brain of the tool. It formulates the giant mixed-integer or linear program based upon the optimization request received from the Configuration Language Engine. It is designed to be very scalable, which allows the solver to run in parallel upon hundreds or even thousands of machines running within Google’s clusters. In addition to mixed-integer linear programming toolkits, there are also components within the Auxon Solver that handle tasks such as scheduling, managing a pool of workers, and descending decision trees.
Algorithms to Live By: The Computer Science of Human Decisions
by
Brian Christian
and
Tom Griffiths
Published 4 Apr 2016
solving the continuous versions of these problems: There are certain kinds of continuous optimization problems that can be solved in polynomial time; the most prominent example is linear programming problems, in which both the metric to be optimized and the constraints on the solution can be expressed as a linear function of the variables involved. See Khachiyan, “Polynomial Algorithms in Linear Programming,” and Karmarkar, “A New Polynomial-Time Algorithm for Linear Programming.” However, continuous optimization is no panacea: there are also classes of continuous optimization problems that are intractable. For example, see Pardalos and Schnitger, “Checking Local Optimality in Constrained Quadratic Programming is NP-hard.”
…
The idea itself is considered to have emerged in the work of Michael Held (of IBM) and Richard Karp (of UC Berkeley) on the traveling salesman problem in 1970—see Held and Karp, “The Traveling-Salesman Problem and Minimum Spanning Trees,” and Held and Karp, “The Traveling-Salesman Problem and Minimum Spanning Trees: Part II.” Earlier precursors, however, also exist—for instance, Lorie and Savage, “Three Problems in Rationing Capital”; Everett III, “Generalized Lagrange Multiplier Method”; and Gilmore and Gomory, “A Linear Programming Approach to the Cutting Stock Problem, Part II.” For an overview and reflections see Fisher, “The Lagrangian Relaxation Method for Solving Integer Programming Problems,” as well as Geoffrion, “Lagrangian Relaxation for Integer Programming.” “If you end up with fractional games”: Michael Trick, personal interview, November 26, 2013.
…
“Nash and Correlated Equilibria: Some Complexity Considerations.” Games and Economic Behavior 1, no. 1 (1989): 80–93. Gillispie, Charles Coulston. Pierre-Simon Laplace, 1749–1827: A Life in Exact Science. Princeton, NJ: Princeton University Press, 2000. Gilmore, Paul C., and Ralph E. Gomory. “A Linear Programming Approach to the Cutting Stock Problem, Part II.” Operations Research 11, no. 6 (1963): 863–888. Gilovich, Thomas. How We Know What Isn’t So. New York: Simon & Schuster, 2008. Ginsberg, Allen. Howl and Other Poems. San Francisco: City Lights Books, 1956. Gittins, John C. “Bandit Processes and Dynamic Allocation Indices.”

Theory of Games and Economic Behavior: 60th Anniversary Commemorative Edition (Princeton Classic Editions)
by
John von Neumann
and
Oskar Morgenstern
Published 19 Mar 2007
We divided up the chapters of the Bible, the TGEB, as handed down by von Neumann and Morgenstern, and lectured to each other in one of the seminar rooms of the old Fine Hall, then the home of the mathematics department at Princeton. By the end of the summer, we had established that, mathematically, linear programming and the theory of zero-sum two-person games are equivalent. Enthused by the research potential of the subject we had just learned, we wanted lo spread the gospel. We initialed a weekly seminar in the department centered on the subjects of game theory and linear programming. To understand the importance of this development, one must contrast the situations today and then. Today, the seminar lists of the university and the Institute of Advanced Studies contain over twenty weekly seminars in subjects such as number theory, topology, analysis, and statistical mechanics.
…
We shall concentrate on the activity in the mathematics department at Princeton, a story that illustrates the strong element of chance in human affairs. The story starts with two visits by George Dantzig to visit John von Neumann in the fall of 1947 and the spring of 1948. In the first visit Dantzig described his new theory of “linear programming” only to be told dismissively by von Neumann that he had encountered similar problems in his study of zero-sum two-person games. In his second visit, Dantzig proposed an academic project to study the relationship between these two fields and asked von Neumann’s advice about universities in which such a project might be pursued.
…
Tucker (a topologist who was associate chairman of the mathematics department at that time). On the ride, Dantzig gave a quick exposition of his new discoveries, using the Transportation Problem [13] as a lively example. This recalled to Tucker his earlier work on electrical networks and Kirkhoff’s Law and planted the idea that the project to study the relationship between linear programming and the theory of games might be established in the mathematics department at Princeton University. In those halcyon days of no red tape, before a month had elapsed Tucker hired two graduate students, David Gale and myself, and the project was set up through Solomon Lefshelz’s project on non-linear differential equations until a formal structure could be established through the Office of Naval Research’s Logistics Branch.
The Myth of the Rational Market: A History of Risk, Reward, and Delusion on Wall Street
by
Justin Fox
Published 29 May 2009
His statistics professor at Chicago was Leonard “Jimmie” Savage, a veteran of the wartime Statistical Research Group at Columbia, who was described by his sometime collaborator Milton Friedman as “one of the few people I have met whom I would unhesitatingly call a genius.”11 He studied the mathematics of tradeoffs with Tjalling Koopmans, a Dutch physicist-turned-economist and future Nobelist. During the war, Koopmans had developed the technique later dubbed “linear programming” to determine the most efficient use of merchant ships crisscrossing the Atlantic.12 Markowitz’s adviser, macroeconomics professor, and guide to the ideas of von Neumann and Morgenstern was Jacob Marschak. “When I first read the von Neumann axioms, I was not convinced,” Markowitz recalled. “Somebody at Cowles said, ‘Well, you ought to read Marschak’s version of the von Neumann axioms.’
…
Markowitz’s translation: “It said that the riskiness of the portfolio had to do not only with the riskiness of the individual securities therein, but also to the extent that they moved up and down together.” From there, Markowitz was a few equations away from separating an “efficient” portfolio—one that delivered the maximum potential reward for a given amount of risk—from an inefficient one. The terminology, and the math, came straight from his linear programming class with Tjalling Koopmans.16 Markowitz had not only a dissertation topic but an idea that would transform investing. Before he could get his degree, though, he had to put up with an unexpected razzing from Friedman at his dissertation defense. “Two minutes into the defense, Friedman says, ‘Well, I don’t find any mistake in the mathematics, but this isn’t a dissertation in economics and we can’t give you a Ph.D. in economics.’”
…
But half a century later, Friedman stood by what he had said. “Every statement there is correct. It’s not economics; it’s not mathematics; it’s not business. It is something different. It’s finance.” THERE WASN’T A BIG MARKET for this new, quantitative version of finance in 1952. After finishing up at Chicago, Markowitz took a job doing linear programming at RAND—a think tank set up by the air force after the war that threw together mathematicians (von Neumann was a regular), physicists, economists, political scientists, and computer programmers to study the big questions of war and diplomacy. His portfolio theory article attracted the attention, though, of the same Merrill Foundation that had bankrolled Holbrook Working’s research.

System Error: Where Big Tech Went Wrong and How We Can Reboot
by
Rob Reich
,
Mehran Sahami
and
Jeremy M. Weinstein
Published 6 Sep 2021
Nowhere does the text invite a reader to ask what problems are worth solving or whether there are important problems that cannot be reduced to a computational solution. Computer science was influenced by work in decision theory and linear programming that dates back to the 1940s and 1950s. George Dantzig, a pioneer of optimization methods and professor at Stanford who retired in 1997, wrote in a 2002 retrospective that “Linear programming can be viewed as part of a great revolutionary development which has given mankind the ability to state general goals and to lay out a path of detailed decisions to take in order to ‘best’ achieve its goals when faced with practical situations of great complexity.
…
Our tools for doing this are ways to formulate real-world problems in detailed mathematical terms (models), techniques for solving the models (algorithms), and engines for executing the steps of algorithms (computers and software).” He dated that effort to 1947—the year he published the celebrated Simplex algorithm for linear programming—and observed that “what seems to characterize the pre-1947 era was lack of any interest in trying to optimize.” In order to optimize, computer scientists often form mathematical abstractions of the world to create computational problems. A classic problem that nearly all computer scientists encounter at some point in their education is the “Traveling Salesman Problem” (more recently renamed the “Traveling Salesperson Problem”), or TSP.
…
“The ideas of economists”: John Maynard Keynes, The Collected Writings of John Maynard Keynes, ed. Elizabeth Johnson and Donald Moggridge, vol. 7, The General Theory (London: Cambridge University Press, 1978), 383. “tool for solving”: Thomas H. Cormen et al., Introduction to Algorithms, 3rd ed. (Cambridge, MA: MIT Press, 2009), 5. George Dantzig: George B. Dantzig, “Linear Programming,” Operations Research 50, no. 1 (February 2002): 42–47, https://doi.org/10.1287/opre.50.1.42.17798. algorithmic insights as a form of wisdom: Brian Christian and Tom Griffiths, Algorithms to Live By: The Computer Science of Human Decisions (New York: Henry Holt, 2016). “Google should not be in the business of war”: Scott Shane and Daisuke Wakabayashi, “‘The Business of War’: Google Employees Protest Work for the Pentagon,” New York Times, April 4, 2018, https://www.nytimes.com/2018/04/04/technology/google-letter-ceo-pentagon-project.html.

The Man From the Future: The Visionary Life of John Von Neumann
by
Ananyo Bhattacharya
Published 6 Oct 2021
Dantzig, a former liaison between the Air Force and AMP, wanted to solve the daunting logistical problem of matching the military’s needs to the resources available as quickly and efficiently as possible. Air Force budgeting in the 1940s was so baroque that producing a plan to requisition the appropriate manpower and materiel for a task could take seven months or more. Eventually Dantzig would help to invent an entirely new discipline called ‘linear programming’ to deal with the process. But in 1947, he had begun with a relatively simple objective: to devise a diet that met a soldier’s nutritional needs as cheaply as possible.21 The numbers involved in even this supposedly straightforward problem had, however, spiralled rapidly out of control, and he had decided to ask von Neumann, expert in computing techniques, for help.
…
Annoyed himself, Dantzig then ‘slapped the geometric and the algebraic version of the problem on the blackboard’ in ‘under one minute’. Dantzig recalls what happened next: Von Neumann stood up and said, ‘Oh that!’ Then for the next hour and a half, he proceeded to give me a lecture on the mathematical theory of linear programs. At one point, seeing me sitting there with my eyes popping and my mouth open – after all I had searched the literature and found nothing, von Neumann said: ‘I don’t want you to think I am pulling all this out of my sleeve on the spur of the moment like a magician. I have just recently completed a book with Oscar Morgenstern on the theory of games.
…
The theory that I am outlining for your problem is the analog of the one we have developed for games.’22 Von Neumann had instantly recognized that Dantzig’s optimization problem was mathematically related to his minimax theorem for two-person zero-sum games. The insight helped determine the conditions under which logistical problems of the type Dantzig was interested in could or could not be solved. Linear programming is now a staple approach to such problems – from the placement of servers inside data centres to the purchase and distribution of vaccines. The twin influences of these military mathematicians and the Air Force meant that RAND’s interests in 1948 were completely aligned with von Neumann’s three main obsessions of the time: computing, game theory and the bomb.

Principles of Corporate Finance
by
Richard A. Brealey
,
Stewart C. Myers
and
Franklin Allen
Published 15 Feb 2014
BEYOND THE PAGE ● ● ● ● ● Capital rationing models brealey.mhhe.com/c05 One way to tackle such a problem is to work through all possible combinations of projects. For each combination you first check whether the projects satisfy the constraints and then calculate the net present value. But it is smarter to recognize that linear programming (LP) techniques are specially designed to search through such possible combinations. Uses of Capital Rationing Models Linear programming models seem tailor-made for solving capital budgeting problems when resources are limited. Why then are they not universally accepted either in theory or in practice? One reason is that these models can turn out to be very complex.
…
Here we want to deploy an investor’s funds to give the highest expected return for a given standard deviation. In principle, both problems can be solved by hunting and pecking—but only in principle. To solve the capital rationing problem, we can employ linear programming; to solve the portfolio problem, we would turn to a variant of linear programming known as quadratic programming. Given the expected return and standard deviation for each stock, as well as the correlation between each pair of stocks, we could use a standard quadratic computer program to calculate the set of efficient portfolios. Three of these efficient portfolios are marked in Figure 8.4.
…
The problem in this case is to find the package of investment projects that satisfies the capital constraint and has the largest net present value. The IRR rule will not identify this package. As we will show in the next section, the only practical and general way to do so is to use the technique of linear programming. When we have to choose between projects F and G, it is easiest to compare the net present values. But if your heart is set on the IRR rule, you can use it as long as you look at the internal rate of return on the incremental flows. The procedure is exactly the same as we showed above. First, you check that project F has a satisfactory IRR.

Smart and Gets Things Done: Joel Spolsky's Concise Guide to Finding the Best Technical Talent
by
Joel Spolsky
Published 1 Jun 2007
To the Mountain, Jeeves! Think about where the people you want to hire are hanging out. What conferences do they go to? Where do they live? What organizations do they belong to? What websites do they read? 1. Donald J. Albers and Constance Reid, “An Interview of George B. Dantzig: The Father of Linear Programming,” College Mathematics Journal 17, no. 4 (1986), pp. 293–314. 23 24 Smart and Gets Things Done Instead of casting a wide net with a job search on Monster.com, use the Joel on Software job board (jobs.joelonsoftware.com) and limit your search to the smart developers who read my website. Go to the really interesting tech conferences.
…
See also developers; Mac developers; open-source programmers; Windows programmers attitude of people they meet at interview, 52–53 avoiding preconceived notions about, 101–102 benefits of quiet working space for, 163–165 bottom line in hiring, 120 different types of contributors, 127–128 effect of firing underperformers on morale, 129–130 handling underperformers, 130–131 hiring cheap vs. quality, 3–4 hiring right ones for the job, 93–97 Index 179 importance of identifying with company to, 60–63 interviewing about recent project, 102–103 measuring productivity of, 5–10 more are not always better, 11 motivating to identify with company goals, 147–150 putting yourself into the candidate’s head, 47–48 questioning a candidate on code writing, 111–113 screening for diversity in thinking about projects, 75–76 screening for experience in difficult technologies, 74–75 some don’t pull their weight, 128–129 things they don’t care about, 63–64 toys as great recruiting tools for, 50 treating them like Samurai, 118–119 treatment of inside the organization, 51–52 typical plan for interviewing, 100–101 understanding of basic programming concepts, 107–108 using cool new technologies unnecessarily, 59–60 programming-intensive course (CS323), taught at Yale, 5 projects, letting top recruits pick their own, 58–59 Q Quiz Show Interviewer, 99 R recruiting identifying idealistic aspects of company for, 60–63 importance of interesting projects to, 57–58 importance of people applicants meet at interview, 52–53 180 Index recursion and pointers, programmers understanding of, 108–111 importance of understanding, see recursion Reid, Constance and Donald J. Albers, An Interview of George B. Dantzig: The Father of Linear Programming by, 23 resumes additional screening for, 77–78 criteria for sorting, 68–76 evaluating for technology experience, 78–81 extracurricular activities as clue to intelligence, 72–73 Fog Creek rules for screening, 67–68 importance of custom cover letters to, 70–71 passion as important criteria for programmers, 69–70 scoring by English skills, 71–72 selectivity as criteria for programmers, 73 Reselman, Bob, blog post about Microsoft interview, 119 rubber rooms, use of to neutralize bad employees, 130–131 Ruby on Rails, use of by 37signals for applications, 61 S Santa Teresa Laboratory (IBM), 44 schedules, importance of having up-to-date, 160–161 selectivity, as part of criteria for programmers, 73 Seven Samurai, Akira Kurosawa movie, 118 shipping build, 154–155 software companies, bible on how to run, 42 software company, creation of Fog Creek Software, 2 Index 181 software developers importance of interesting projects to, 57–58 social life of, 51–57 software developers.

Against the Gods: The Remarkable Story of Risk
by
Peter L. Bernstein
Published 23 Aug 1996
His approach reflects the spirit of the early years after the Second World War, when many social scientists set about reviving the Victorian faith in measurement and the belief that the world's problems could be solved. Strangely, Markowitz had no interest in equity investment when he first turned his attention to the ideas dealt with in "Portfolio Selection." He knew nothing about the stock market. A self-styled "nerd" as a student, he was working in what was then the relatively young field of linear programming. Linear programming, which happened to be an innovation to which John von Neumann had made significant contributions, is a means of developing mathematical models for minimizing costs while holding outputs constant, or for maximizing outputs while holding costs constant. The technique is essential for dealing with problems like those faced by an airline that aims to keep a limited number of aircraft as busy as possible while flying to as many destinations as possible.
…
The technique is essential for dealing with problems like those faced by an airline that aims to keep a limited number of aircraft as busy as possible while flying to as many destinations as possible. One day, while waiting to see his professor to discuss a topic for his doctoral dissertation, Markowitz struck up a conversation with a stock broker sharing the waiting room who urged him to apply linear programming to the problems investors face in the stock market. Markowitz's professor seconded the broker's suggestion, enthusiastically, though he himself knew so little about the stock market that he could not advise Markowitz on how or where to begin the project. He referred Markowitz to the dean of the business school, who, he hoped, might know something about the subject.
…
Markowitz reserved the term "efficient" for portfolios that combine the best holdings at the price with the least of the variance"optimization" is the technical word. The approach combines two cliches that investors learn early in the game: nothing ventured, nothing gained, but don't put all your eggs in one basket. It is important to recognize that there is no one efficient portfolio that is more efficient than all others. Thanks to linear programing, Markowitz's method produces a menu of efficient portfolios. Like any menu, this one has two sides: what you want is on one side and the cost of what you want is on the other. The higher the expected return, the greater the risks involved. But each efficient portfolio on the menu will have the highest expected return for any given level of risk or the lowest level of risk for any expected return.

From Airline Reservations to Sonic the Hedgehog: A History of the Software Industry
by
Martin Campbell-Kelly
Published 15 Jan 2003
Nonetheless, Kubie recognized that the market for technical applications was somewhat limited, so he began to broaden the firm’s base by tendering for business applications and systems software. The portfolio of its early projects was impressively diverse: “Among these were oil reservoir simulation, nuclear reactor design, structural design, space technology, chemical engineering, supersonic air flow, circuit and logical design of complex electronic equipment, linear programming, inventory control, sales analysis, cost analysis, payroll, trust accounting, statistical analysis, information storage and retrieval, cataloguing, traffic analysis, production planning, insurance accounting, computer simulation, computer operating systems, and development of interpretive, compiler, and assembly programming languages.”71 Kubie estimated that “About 50–60 percent of our development work is in the business application area, 20–30 percent in [systems] software, and the remainder in scientific applications.”72 By 1959, CUC had a staff of 59 and had opened a branch office in Washington.
…
This had a further benefit for IBM: It would make it much harder for independent software firms to compete, because they generally did not have access to leasing funds. The situation with regard to Type II application programs was much more complex, mainly because of the hazy distinction between a software package and a software product. Some application packages—especially the more scientific and mathematical ones, such as linear programming and project-management packages—presented little difficulty. These were already self-contained packages that required negligible support and were therefore easy to unbundle. However, most of the industry-specific programs had long been supplied as illustrative examples rather than finished products, and they usually required extensive customization by IBM’s systems engineers.
…
Most often the middle course of a perpetual but revocable license was favored by software vendors because it represented the best compromise between recovery of development costs and control of the product’s use. Time-sharing services offered a per-use charging mechanism. Time-sharing services were mostly used by engineers and scientists as “super calculators” for stress analysis, linear programming, matrix analysis, and other mathematical applications. Financial workers also made use of time-sharing services—particularly financial analysis packages, which were the real forerunners of spreadsheet programs for personal computers.17 The program catalogs of the major time-sharing companies contained hundreds of programs.

Commodity Trading Advisors: Risk, Performance Analysis, and Selection
by
Greg N. Gregoriou
,
Vassilios Karavas
,
François-Serge Lhabitant
and
Fabrice Douglas Rouah
Published 23 Sep 2004
Following Banker, Charnes, and Cooper (BCC) (1984) we can measure the output-oriented efficiency of the ith DMU by solving this linear programming problem:17 Max fi Subject to N ∑ λ j yrj j =1 N ∑ λ j xsj j =1 N ∑ λj ≥ φi yri r = 1, 2, . . . , m ≤ x si s = 1, 2, . . . , n (5.1) =1 j =1 λj ≥ 0 j = 1, 2, . . . , N For an efficient DMU fi = 1, whereas for an inefficient DMU fi > 1. On the other hand, an input-oriented measure of efficiency can be obtained for the ith DMU by solving the linear programming problem: 16The concept of efficiency used here is that of technical efficiency. It is used in the context of an expanded efficient frontier with n variables across n dimensions, rather than just the two familiar mean and variance dimensions. 17While the Charnes, Cooper, and Rhodes, (1978) model assumes constant returns to scale, the model proposed by Banker, Charnes, and Cooper (1984) allows for variable returns to scale.
…
How the inputs and outputs are used in the efficiency analysis are essential because they establish the grounds on which the efficiency of the fund is calculated. The most extensively used DEA technique to measure efficiency takes the weighted sum of outputs and divides it by the weighted sum of inputs (Golany and Roll, 1994). In its simplest form, DEA calculates weights from a linear program that maximizes relative efficiency with a set 2Pareto optimality means the best that can be attained without putting any group at a disadvantage. In other words, a group of funds becomes better off if an individual fund becomes better off and none becomes worse off. Simple and Cross-Efficiency of CTAs Using Data Envelopment Analysis 133 of minimal weight constraints.3 Charnes, Cooper, and Rhodes (1978) proposed reducing the multiple-input, multiple-output model to a ratio with a single virtual input and a single virtual output.
…
Cross-Efficiency The cross-evaluation, or cross-efficiency, model was first seen in Sexton, Silkman, and Hogan (1986) and later in Oral, Ketani, and Lang (1991), Doyle and Green (1994), and Thanassoulis, Boussofiane, and Dyson (1995). It establishes the ranking procedure and computes the efficiency score of each CTA n times using optimal weights measured by the linear programs. A cross-evaluation matrix is a square matrix of dimension equal to the number of CTAs in the analysis. The efficiency of CTA j is computed with the optimal weights for CTA k. The higher the values in column k, the more likely that CTA k is efficient using superior operating techniques. Therefore, calculating the mean of each column will provide the peer appraisal score of each CTA.

Scarcity: The True Cost of Not Having Enough
by
Sendhil Mullainathan
Published 3 Sep 2014
needing to navigate a world that is computationally more complex: The notion of computational complexity here can be understood by contrasting linear programming to integer programming. In linear programming, items can be infinitely subdivided—the logical extension of granularity. In integer programming, items must be packed in fixed units—the logical extension of bulkiness. Computer scientists have shown in a precise mathematical sense that integer programming is inherently harder than linear programming. A detailed introduction to these ideas can be found in Alexander Schrijver, Theory of Linear and Integer Programming (West Sussex, England: John Wiley & Sons, 1998).
Cogs and Monsters: What Economics Is, and What It Should Be
by
Diane Coyle
Published 11 Oct 2021
In an extended blog post reviewing Red Plenty, Cosma Shalizi worked out the computational requirements for Soviet central planning to have been effective.1 The problem is formally computable in that the number of computations required increases polynomially rather than exponentially with the number of goods and services; but in the USSR of 1983, even with its limited product range compared to the United States, would have needed a computer a thousand times faster than the best then available to work out an economic plan in less than twelve months of computation. ‘Formally possible’ does not mean ‘practical’. Increasing the number of variables in the linear programming problem—the number of goods—would increase the time needed by a polynomially greater factor. Of course, the power and speed of computers has increased in line with Moore’s law since 1983, giving new hope to the advocates of socialist calculation. Surely AI can finally deliver us an efficient central planner?
…
As described in Chapter Five, high fixed costs of starting up and network effects in digital business mean there are often these very large increasing returns to scale. As Shalizi observes: ‘[T]here are no general-purpose algorithms for optimizing under non-convex constraints. Non-convex programming isn’t roughly as tractable as linear programming, it’s generally quite intractable.’ This may be overstating the impossibility, as algorithms manage to address similar problems such as how should a logistics firm collect and deliver millions of parcels across the world; but at the scale of the whole economy with all the varieties it contains, it is certainly challenging.

Protocol: how control exists after decentralization
by
Alexander R. Galloway
Published 1 Apr 2004
As Branden Hookway writes: “The shift is occurring across the spectrum of information technologies as we move from models of the global application of intelligence, with their universality and frictionless dispersal, to one of local applications, where intelligence is site-specific and fluid.”5 Computer scientists reference this historical shift when they describe the change from linear programming to object-oriented programming, the latter a less centralized and more modular way of writing code. This shift toward distribution has also been documented in such diverse texts as those of sociologist Manuel Castells, American Deleuzian Hakim Bey, and the Italian “autonomist” political movement of the 1970s.
…
The coinage “robot” is attributed to the writer Karel Čapek and derives from a Czech word meaning “serf.” For more on robots and other automata, see Julien Offray de la Mettrie, Power 107 from being primarily linear calculation machines to being clusters of parallel, distributed submachines. In computer science, this shift is characterized by the change from “procedural” (or linear) programming to so-called object-oriented programming. In procedural programming, one inputs data and then operates on that data in a linear manner. Loops may occur, but in general a series of commands are read, interpreted, and executed as a consecutive chain of events. Object-oriented programming, on the other hand, treats all code as a series of simultaneously generated entities, with each entity possessing its own qualities and actions.

The Mathematics of Love: Patterns, Proofs, and the Search for the Ultimate Equation
by
Hannah Fry
Published 3 Feb 2015
Monte Carlo methods offer a way of sampling without having to check every possible combination. 14. Examples include the simulated annealing algorithm and the Nelder-Mead simplex procedure, which both provide efficient ways to search for optimal solutions. 15. The CPLEX solver employs an algorithm from linear programming and uses the happiness scores to create a feasible region in solution space. It skips over anything on the inside of this convex polytope by assuming the optimal result will lie on the surface of the simplex. 16. Known as the Specific Affect Coding System, or ‘SPAFF’ for short. 17. A full overview of the scoring system can be found in Coan and Gottman, ‘The Specific Affect Coding System (SPAFF)’ (1995). 18.

Practical C Programming, 3rd Edition
by
Steve Oualline
Published 15 Nov 2011
Decision and Control Statements Once a decision was made, I did not worry about it afterward. —Harry Truman Calculations and expressions are only a small part of computer programming. Decision and control statements are needed. They specify the order in which statements are to be executed. So far, we have constructed linear programs, that is, programs that execute in a straight line, one statement after another. In this chapter, we will see how to change the control flow of a program with branching statements and looping statements. Branching statements cause one section of code to be executed or not executed, depending on a conditional clause.
…
#define, #define vs. const continue statement, continue Statement, switch, break, and continue control flow, Decision and Control Statements control statements, How C Works control variables, for Statement conversion routines, Conversion Routines cpp program, #define Statement cprint printer, Electronic Archaeology CR (carriage return), The End-of-Line Puzzle cross-reference programs, Electronic Archaeology ctype.h, Rest of Program curly braces, if Statement and arrays, Initializing Variables D data declarations, How C Works, Elements of a Program data types enumerated, enum Type dbx debugger, Interactive Debuggers commands, Interactive Debuggers debug statement, Conditional Compilation debugging, How to Learn C, Style, Programming Process, Testing, Answers binary search, Debugging a Binary Search breakpoints, Debugging a Binary Search command-line switch, Debug Command-Line Switch conditional compilation, Debug-Only Code with cdb, Interactive Debuggers with dbx, Interactive Debuggers with sdb, Interactive Debuggers debugging, divide and conquer method, Divide and Conquer debugging, going through output, Going Through the Output debugging, interactive, Interactive Debuggers debugging, save file, Debugging decision statements, How This Book is Organized declarations, Style, Elements of a Program pointer, Simple Pointers declarations, array, How C Works declarations, data, How C Works declarations, integer, Integers declarations, structures, How C Works declarations, variable, Variables and Storage, Variable Declarations default statement, switch Statement, switch Statement defining bit values, Setting, Clearing, and Testing Bits dereference operator (*), Simple Pointers derrived class, Line Counter Submodule (lc) diagnostic printf, Debugging dimensions, array, Arrays directories, Setting Up divide by error, Runtime Errors divide operator (/), Simple Expressions, Floating Point Versus Integer Divide division, floating point, Division do/while statement, do/while documents, government, How Programming Works DOS Makefile, The Makefile for Multiple Files double, Determining Accuracy, Precision and Speed linked list, Double-Linked Lists double quotes, Characters, Strings dynamic data structures, Advanced Pointers E elements, Arrays, Structures else statement, else Statement English language, How Programming Works enum, enum Type enumerated data types, enum Type EOF, File Input/Output escape character, Characters Evaluation order problems, Side Effects EVEN macro, The and Operator (&) exclusive or (^), Bit Operators, The Bitwise Exclusive or (^) executable statements, Basic Program Structure exercises, How to Learn C extern, The extern Modifier F factorial (program), Recursion far pointers, Simple Pointers fclose, File Input/Output fflush, Buffering Problems, Runtime Errors fgetc, File Input/Output fgets, File Input/Output standard function, Reading Strings fgets, newline problem, Reading Strings Fibonacci (program), while Statement fields, Structures bit, Bit Fields or Packed Structures file, source, How C Works files, File Input/Output, Answers binary, Byte Order Problem closing, File Input/Output FILE, File Input/Output formats, Style, Designing File Formats header, Headers naming, File Input/Output, Filename Problems opening, File Input/Output types, File Types variables, File Input/Output files, ASCII, Binary and ASCII Files files, binary, Binary and ASCII Files float, Precision and Speed float.h include file, Determining Accuracy floating point, Floating Point floating point accuracy, Accuracy, Determining Accuracy floating point addition, Floating Addition/Subtraction floating point division, Division floating point multiplication, Multiplication floating point overflow, Overflow and Underflow floating point precision, Precision and Speed floating point speed, Precision and Speed floating point subtraction, Floating Addition/Subtraction floating point underflow, Overflow and Underflow floating point, float.h, Determining Accuracy floating point, guard digit, Floating-Point Format floating point, roundoff error, Roundoff Error, Minimizing Roundoff Error floating-point, Types of Floats declaration, Floating Point division, Floating Point Versus Integer Divide exception, Runtime Errors numbers, Characters floating-point underflow, Overflow and Underflow fopen, File Input/Output for statement, for Statement FORTRAN, How Programming Works, for Statement fprintf, Conversion Routines fputc, File Input/Output fputs, File Input/Output fread, Binary I/O free, free Function fscanf, Conversion Routines FTP, obtaining exercises via, FTP FTPMAIL, FTPMAIL FTPMAIL, obtaining exercises via, FTPMAIL functions, How This Book is Organized, Functions library, Basic Program Structure functions, standard, How C Works fwrite, Binary I/O G generic pointer, Pointers and Structures global variables, Variable Scope and Functions, Scope and Class government documents, How Programming Works graphics, bitmapped, Bitmapped Graphics grind printer, Electronic Archaeology guard digit, floating point, Floating-Point Format H header files, Headers heading comments, Style, Basic Program Structure hello (program), Style helmet law, How Programming Works help, Getting Help on UNIX hexadecimal, Bit Operations numbers, Hexadecimal and Octal Constants high level languages, How Programming Works histogram program, Using the Infinite Array I if statement, if Statement include file, float.h, Determining Accuracy include files, include Files indent program, Electronic Archaeology indentation, Indentation and Code Format tools, Electronic Archaeology indexes (and arrays), Arrays infinite arrays, Modules, A Program to Use Infinite Arrays, Using the Infinite Array initializing strings, Initializing Variables structures, Structures variables, Initializing Variables initializing, multiple-dimensional arrays, Initializing Variables instructions, How C Works int, long, Types of Integers int, unsigned, Types of Integers integer declarations, Integers division, Floating Point Versus Integer Divide overflow, Answers types, Types of Integers integer, very short (char), Types of Integers interactive debugging, Interactive Debuggers isalpha, Rest of Program K Kernigham, Brian, Brief History of C L labels, goto, goto language, assembly, How Programming Works language, assembly, translation, How Programming Works language, C, Brief History of C language, C++, Brief History of C language, COBOL, How Programming Works language, English, How Programming Works language, FORTRAN, How Programming Works language, machine, How Programming Works language, PASCAL, How Programming Works languages, high level, How Programming Works law, helmet, How Programming Works learning C++, How to Learn C left shift (), Bit Operators, The Left- and Right-Shift Operators (<<, >>) lex utility, Compiler lexical analysis, Compiler LF (line feed), The End-of-Line Puzzle libraries, How C Works library functions, Basic Program Structure limit error, Answers line feed, The End-of-Line Puzzle linear~programs, Decision and Control Statements lines, in coding, Basic Program Structure linked lists, Linked List, A Program to Use Infinite Arrays linked lists, add element, Linked List linked lists, locate element, Linked List list command (dbx), Interactive Debuggers local header files, Headers include files, include Files variables, Variable Scope and Functions, Scope and Class long double integers, Types of Floats long int, Types of Integers and portability, Word Size looping statements, How C Works, Decision and Control Statements, Looping Statements M machine language, How Programming Works macros definitions, Summary replacement, #define Statement macros, and parameters, Parameterized Macros magic numbers, Designing File Formats main, Basic Program Structure maintaining code, Style maintaining programs, Programming Process make, Makefile, The Makefile for Multiple Files targets, The Makefile for Multiple Files with multiple files, The Makefile for Multiple Files Makefile, Makefile, The Makefile for Multiple Files DOS, The Makefile for Multiple Files malloc, Pointers and Structures man pages (UNIX), Getting Help on UNIX math operators, Simple Expressions mechanics of programming, How This Book is Organized memory, How C Works memset, The Power of Powers of 2, Using the Infinite Array min macro, The ?
Tools for Computational Finance
by
Rüdiger Seydel
Published 2 Jan 2002
Springer (2001). M. Dai: A closed-form solution for perpetual American floating strike lookback options. J. Computational Finance 4,2 (2000) 63-68. R.-A. Dana, M. Jeanblanc: Financial Markets in Continuous Time. Springer, Berlin (2003). M.A.H. Dempster, J.P. Hutton: Pricing American stock options by linear programming. Mathematical Finance 9 (1999) 229–254. M.A.H. Dempster, J.P. Hutton, D.G. Richards: LP valuation of exotic American options exploiting structure. J. Computational Finance 2,1 (1998) 61-84. H.-P. Deutsch: Derivatives and Internal Models. Palgrave, Houndmills (2002). L. Devroye: Non–Uniform Random Variate Generation.
…
.: Complex Dynamics Arnold, V. I.: Lectures on Partial Differential Equations Cecil, T. E.: Lie Sphere Geometry: With Applications of Submanifolds Audin, M.: Geometry Chae, S. B.: Lebesgue Integration Aupetit, B.: A Primer on Spectral Theory Chandrasekharan, K.: Classical Fourier Transform Bachem, A.; Kern, W.: Linear Programming Duality Bachmann, G.; Narici, L.; Beckenstein, E.: Fourier and Wavelet Analysis Borkar, V. S.: Probability Theory Charlap, L. S.: Bieberbach Groups and Flat Manifolds Badescu, L.: Algebraic Surfaces Chern, S.: Complex Manifolds without Potential Theory Balakrishnan, R.; Ranganathan, K.: A Textbook of Graph Theory Chorin, A.
An Extraordinary Time: The End of the Postwar Boom and the Return of the Ordinary Economy
by
Marc Levinson
Published 31 Jul 2016
To some extent, planning was unavoidable: where foreign currency to buy imports was scarce at the war’s end, someone had to decide whether importing fuel or food was more essential. But the planning bureaucracies that developed in the late 1940s were meant to be anything but temporary. Skilled in new quantitative tools such as linear programming and equipped with the techniques perfected by operations researchers to plot bombing runs, the planners claimed to know which industries, if properly fostered, could do the most for economic growth. Following the advice of economists, France’s government laid out grands plans for new auto plants and steel mills.
…
The government’s job was not to run it, but to use its tax and spending powers to fine-tune it for optimal performance. This would be accomplished with techniques such as input-output analysis, which showed how a million marks of government spending on highways would trickle through the economy, and linear programming, which could reveal which type of tax cut might create the most jobs. Highly trained experts conversant with new methods of statistical analysis would evaluate the data and make the critical decisions. In 1956, Schiller put forth his ideas in legislation requiring the government to maintain full employment and steady economic growth while keeping prices stable.

How I Became a Quant: Insights From 25 of Wall Street's Elite
by
Richard R. Lindsey
and
Barry Schachter
Published 30 Jun 2007
The regulatory authorities laid down a lattice of investment restrictions in an attempt to ensure that financial firms, such as the trust company, would be solvent and able to redeem their paper in a timely manner. The trust company met these restrictions with a set of manual heuristics, ensuring compliance by adding cushions to most, if not all, such restrictions. Could a computer allocate the funds in a more efficient manner? This seemed to be an ideal opportunity for a linear programming application: Maximize expected return while meeting all regulatory restrictions. The results demonstrated that manual adherence to each restriction with cushions was expensive in terms of opportunity costs. The appropriate matching of liabilities with asset classes was also a process worth exploring.
…
The essence of these deals (as is the case with so many supposed arbitrages) was the sale of insurance. Gordon Capital didn’t realize it at the time, but it was short billions of dollars of Government of Canada bonds and long a portfolio of high-quality bank paper that had been carefully constructed by an advisor who used a linear program JWPR007-Lindsey May 7, 2007 17:9 Julian Shaw 231 to match the coupon flows. (The advisor has since been indicted on unrelated charges.) To use an Australian expression, this was “a nice little earner” until bank credit spreads deteriorated and Gordon Capital wanted to reduce its exposure.
If Then: How Simulmatics Corporation Invented the Future
by
Jill Lepore
Published 14 Sep 2020
And see TBM to AB, JC, ELG, IP, and others, Memo, November 17, 1961, Pool Papers, Box 143, Folder “Media Mix: Publicity.” TBM discusses the upcoming meeting with Ramond at the foundation: “For this meeting, Dr. Charles Ramond has invited David Lerner of BBD&O who will introduce Milt Godfrey of C-E-I-R to talk about linear programming and Ben Lipstein of Benton and Bowles who will introduce Alex Bernstein of Simulmatics to talk about simulation.” ELG, “Simulmatics Media-Mix I: First General Description,” November 22, 1961, Pool Papers, Box 143, Folder “Media Mix: Publicity.” “The Simulmatics Corporation,” brochure, c. 1965, p. 6, Pool Papers, Box 67, Folder “Simulmatics Correspondence.”
…
On attendance, see Ray Berland to IP, March 27, 1962, Pool Papers, Box 142, Folder “3/6 1962.” ELG, “Simulmatics Media-Mix I: General Description,” February 1962, p. 2, Pool Papers, Box 67, Folder “Simulmatics Correspondence.” Feniger writes, after reading a draft of the Media-Mix brochure, “I would expand at greater length on the difference between your plan and linear programming since you will obviously be putting your service on the market at the same time as CEIR is selling their plan.” Jerome Feniger to ELG, March 19, 1962, Pool Papers, Box 142, Folder “3/6 1962.” “Y&R, BBDO Unleash Media Computerization,” Advertising Age, October 1, 1962, Pool Papers, Box 142, Folder “NAEA meeting Chicago, 1963, Jan. 21.”

Smart Grid Standards
by
Takuro Sato
Published 17 Nov 2015
Here, we will briefly outline the research approaches and the most important findings related to the role of variable generators in the future grid. 9.3.1.1 Decarbonizing Scenarios for the Western Electricity Coordinating Council (WECC) This study was performed using the SWITCH model that has been developed by researchers in our Renewable and Appropriate Energy Laboratory at the University of California – Berkeley [16–18]. SWITCH is a capacity expansion and dispatch model developed to study policy options for decarbonizing the power sector in the entire geographic extent of the Western Electricity Coordinating Council (WECC). The model is a mixed-integer linear program whose objective function is to minimize the cost of meeting electricity demand between the present day and some future time, say the year 2030. Figure 9.4 shows the diagram summarizing the model’s input, optimization, and output, while Figure 9.5 provides the objective function together with necessary information.
…
In general, the study concludes that designing the storage according to the seasonal and diurnal matching of intermittent renewable output profile to the load profile carries a significant role in achieving very high penetration and high system performance. 9.4.2 Storage Design and Dispatch – Case of Interconnected Grid In order to assess the possibility of reaching a very high penetration in an interconnected grid we have developed a noneconomic mathematical model (based on a linear program), which was also instrumental in assessing the potential impact of storage design and dispatch as we increase the capacity of variable generators. The model was designed in a way that enables optimizing the renewable penetration while minimizing the corresponding storage energy and power capacity requirements.
Competing on Analytics: The New Science of Winning
by
Thomas H. Davenport
and
Jeanne G. Harris
Published 6 Mar 2007
Optimization of locations for stores, distribution centers, manufacturing plants, and so on. Increasingly uses geographic analysis and digital maps to, for example, relate company locations to customer locations. Modeling. Creating models to simulate, explore contingencies, and optimize supply chains. Many of these approaches employ some form of linear programming software and solvers, which allow programs to seek particular goals, given a set of variables and constraints. Routing. Finding the best path for a delivery vehicle around a set of locations. Many of these approaches are versions of the “traveling salesman problem.” Scheduling. Creating detailed schedules for the flow of resources and work through a process.
The Inner Lives of Markets: How People Shape Them—And They Shape Us
by
Tim Sullivan
Published 6 Jun 2016
Shi had been a devoted attendee of the public meetings to discuss school assignment reform, chatting with parents and activists to better understand the sources of dissatisfaction with the current system and what sorts of changes would be palatable to them. Shi’s initial proposal involved an attempt to, in his words, “define equality of access rigorously.” Based on his rigorous definition, he devised a solution that involved linear programming methods (a branch of mathematical optimization) to minimize the distance traveled by Boston students subject to an equitable access constraint. If this is incomprehensible to you, the committee shared your reaction. One school committee member pulled Shi aside later and explained that, if you want something to actually get implemented, you had better be able to explain it to a fifth grader.

The New Rules of Lifting: Six Basic Moves for Maximum Muscle
by
Lou Schuler
and
Alwyn Cosgrove
Published 29 Dec 2005
In fact, some T H E B E S T M U S C L E - B U I L D I N G S YS T E M F O R A L M O S T E V E RY B O DY new research shows that undulating programs develop strength and size faster than linear systems. Consider this study in the May 2002 issue of the Journal of Strength and Conditioning Research: The researchers took a group of college-age lifters with an average of five years’ training experience. Half did a linear program—three sets of eight reps one month, three sets of six the next, three sets of four the last. The other group did something called “daily undulating periodization” (or DUP, surely among the most unfortunate acronyms in the entire language). They did three sets of eight on Monday, three sets of six on Wednesday, and three sets of four on Friday.

Green Metropolis: Why Living Smaller, Living Closer, and Driving Less Are Thekeys to Sustainability
by
David Owen
Published 16 Sep 2009
The domed roof would be made of triangular glass panels and would owe a design debt to R. Buckminster Fuller. “Most houses in Compact City would have two floors in order to conserve base area,” the authors wrote, with the self-assurance of professionally logical men who are certain they have thought of everything (Dantzig was an inventor of linear programming). “Design of both the interior and exterior of these houses would vary according to the preferences of the residents. The ringway would provide access to the rear of the upper floor of a house. To facilitate home deliveries by electric-battery-powered trucks from the ringway, it would probably be convenient to have the upper floor of a house built to open directly onto the ringway.

The Fractalist
by
Benoit Mandelbrot
Published 30 Oct 2012
For me, he was the most important IBMer in every way. His Ph.D. from Princeton was also in a classic subfield of pure mathematics that he immediately abandoned as being too mature. He then solved a famous problem of applied mathematics by finding an algorithm that gives integer, not fractional, solutions to linear programming problems. Integer solutions are required in many actual applications, and solving this problem made Ralph extremely well known. IBM hired him and he achieved several other breakthroughs. We met not long after his arrival, when my elder son joined a play group run by his wife. We became good friends, and I moved into his department.

The World's First Railway System: Enterprise, Competition, and Regulation on the Railway Network in Victorian Britain
by
Mark Casson
Published 14 Jul 2009
Introduction and Summary 11 The computational problems involved in the construction of counterfactual networks have never been fully addressed. While Fogel refers to the use of linear programming in network optimization, he acknowledges that he has not actually implemented the technique (Fogel 1964, p. 26). The method by which his counterfactual canal system was derived is not fully explained in the Appendix, and his estimate of its performance is based on guesswork (p. 38). Network optimization cannot be eVected by linear programming, as Fogel mistakenly suggests. Making a connection between two locations involves a binary decision: the two locations are either connected or they are not.

Chaos Engineering: System Resiliency in Practice
by
Casey Rosenthal
and
Nora Jones
Published 27 Apr 2020
It is relatively straightforward to convert a collection of traces of successful executions into such a formula, and once we have done so the problem of choosing a “good experiment” (one that is likely to either reveal a bug or reveal redundancy that we have not yet modeled) is something we can pose as a decision problem to an efficient, off-the-shelf Boolean satisfiability (SAT) solver. Similarly, in order to prioritize our experiments we can encode ranking information based on the topology of graphs or the likelihood of failure of a particular service or piece of hardware. Using this ranking, we can present the same Boolean formula to an integer linear programming (ILP) solver, and ask it to find the best solution (experiment) that maximizes the rankings. By fine-tuning the ranking function, we can encode a heuristic such as “explore the most likely faults first, but among equally likely faults, explore those experiments that (based on topological information) are likely to rule the most out future experiments.”

Hit Makers: The Science of Popularity in an Age of Distraction
by
Derek Thompson
Published 7 Feb 2017
A good headline, they said, is not overly familiar, but rather familiar enough; a welcome surprise expressed in the vernacular of its intended audience; a promise to advance understanding in a broadly acceptable subject—MAYA.8 • • • If a television is a piece of furniture, a mobile device is an appendage—not just familiar, but personal and even intimate. A one-screen world targets the mainstream. But now people get music, news, and everything else from the piece of glass in their pockets. This billion-screen world, not bounded by the limits of linear programming, is tailored to individuals. And although everybody has an appetite for the familiar, appetites can vary. With more than eighty-one million listeners and twenty-one billion hours of played music each year, Pandora is the most popular digital radio app in the world. Name the bands you like, and Pandora builds a radio station around their sound.

Free Ride
by
Robert Levine
Published 25 Oct 2011
In December 2009, the House Judiciary Committee held a hearing on online sports piracy with testimony from executives from the Ultimate Fighting Championship and Major League Baseball, which has built a thriving business streaming games over the Internet itself. “Whatever features may have in the past distinguished live sports from other forms of content in terms of its susceptibility to online infringement are being rendered increasingly irrelevant by new technological means for misappropriating linear programming,” said ESPN’s executive vice president Ed Durso. “And the quality of these sites is improving to the point that programming can be streamed in a form that is almost on par with that accessed through legitimate distribution channels.”24 Live sports piracy isn’t a big problem on computers, since it’s not much fun to watch the big game on a small screen.

Fuller Memorandum
by
Stross, Charles
Published 14 Jan 2010
But that's flawed: if you posit an uncontrolled outbreak, then people can see their neighbors, random strangers, being possessed. And that in turn weakens the observer-mediated grid ultrastructure, making it easier for the preta to tunnel into our reality. It's a feedback loop: the more people succumb, the weaker everyone else's resistance becomes. I modeled it using linear programming and the results are, well, they speak for themselves." "And the closer we come to the Transient Weak Anomaly the more outbreaks we're going to see, and the--it contributes to the strength of the TWA?" She looks at him sharply. "Substantially, yes." Dr. Mike shuffles uncomfortably in his chair.

The Crux
by
Richard Rumelt
Published 27 Apr 2022
A university faculty may be committed to the principle of free speech but, at the same time, have a majority that wants to limit “hate speech.” In such cases, there does not seem to be a feasible policy satisfying these conflicting desires. Strategies are usually what I call “corner solutions.” The phrase comes from linear programming, where the solution to a problem is normally a set of actions defined by the intersection of various constraints—geometrically, a corner of intersecting lines or planes. When the constraints are so strong that no solution is possible, I call the strategy a “null set.” There is no solution without relaxing at least one of the constraints.

Growth: A Reckoning
by
Daniel Susskind
Published 16 Apr 2024
Not only did some of the most fierce critics of capitalism nevertheless see the merits of growth – Karl Marx, as we saw in Chapter 7, wrote of his reverence for the ‘wonders’ it had achieved – but many of those critics’ historical peers played an important role in developing our understanding of how to pursue it.21 Many of the techniques that support modern economics, which today’s Left might want to dismiss as ‘neoclassical nonsense’, were in fact the product of socialist mathematicians trying to figure out how to efficiently plan economic affairs from the top down. ‘Linear programming’, for instance, a fundamental part of any economist’s toolkit, was originally developed by a Soviet economist named Leonid Kantorovich in order to help the Plywood Trust of Leningrad maximize production in their factories. He would win the Lenin Prize for this work in 1965 and the Nobel Prize in 1975.
The Elements of Statistical Learning (Springer Series in Statistics)
by
Trevor Hastie
,
Robert Tibshirani
and
Jerome Friedman
Published 25 Aug 2009
If p ≥ N , they both yield the least squares solution with minimum L1 norm. However for smaller values of t, the DS procedure produces a different path of solutions than the lasso. Candes and Tao (2007) show that the solution to DS is a linear programming problem; hence the name Dantzig selector, in honor of the late 90 3. Linear Methods for Regression George Dantzig, the inventor of the simplex method for linear programming. They also prove a number of interesting mathematical properties for the method, related to its ability to recover an underlying sparse coefficient vector. These same properties also hold for the lasso, as shown later by Bickel et al. (2008).

Understanding Sponsored Search: Core Elements of Keyword Advertising
by
Jim Jansen
Published 25 Jul 2011
In comparison, maximization means trying to attain the highest or maximum result or outcome without regard to cost or expense. Practice of optimization is restricted by the lack of full information and the lack of time to evaluate what information is available (see bounded reality for details). In computer simulation (modeling) of business problems, optimization is achieved usually by using linear programming techniques of operations research (Source: modified from Advertising.com and BusinessDictionary) (see Chapter 7 analytics). Opt-in: refers to an individual giving a company permission to use data collected from or about the individual for a particular reason, such as to market the company’s products and services.

The Theory That Would Not Die: How Bayes' Rule Cracked the Enigma Code, Hunted Down Russian Submarines, and Emerged Triumphant From Two Centuries of Controversy
by
Sharon Bertsch McGrayne
Published 16 May 2011
While Brillinger and Wallace called their NBC polling Bayesian, Tukey said it was “borrowing strength.”23 “Anything he did, he’d call something else,” Wallace said, even if it already had a straightforward, well-established name. New names drew attention to ideas, and a colleague counted 50 terms coined by Tukey. Among those that stuck are linear programming, ANOVA, and data analysis. In one article, Mosteller had difficulty talking him out of using musical notation—sharps, flats, and naturals. Another colleague threatened to call him J. W. Cutie for terms such as “saphe cracking,” “quefrency,” and “alanysis.” As Wallace said, “It was not always the best way to win friends and influence people. . . .

Plutocrats: The Rise of the New Global Super-Rich and the Fall of Everyone Else
by
Chrystia Freeland
Published 11 Oct 2012
In their incarnation as engineers, they overwhelmingly populate the Communist Party leadership in China, where political nous is a surer path to wealth than filing patents. The Russian oligarchs are a textbook example of crony capitalism, yet six of the original seven earned degrees in math, physics, or finance before becoming natural resource tycoons. Carlos Slim, who studied engineering in college and taught algebra and linear programming as an undergraduate, attributes his fortune to his facility with numbers. So does Steve Schwarzman, who told me he owed his success to his “ability to see patterns that other people don’t see” in large collections of numbers. People inside the super-elite think the rise of the data geeks is just beginning.

Against Intellectual Monopoly
by
Michele Boldrin
and
David K. Levine
Published 6 Jul 2008
Certainly the idea of how to build a wheel is much easier to communicate than the idea of how to build an atomic bomb. Basically, inventions range from the trivial, such as the idea of a using a single click to buy an item on the Internet, to the complex, such as Karmarkar’s algorithm for solving linear programming problems. Trivial ideas are cheap to communicate, but, of course, they are also cheap to create. Complex ideas are expensive to create, but they are also difficult to communicate, so they are scarce and will command a substantial premium for a long period of time. In both cases, the cost of producing the ideas and the competitive rents are commensurate, and some ideas will be produced without intellectual monopoly, while perhaps others will not.

Water: A Biography
by
Giulio Boccaletti
Published 13 Sep 2021
The next day, Revelle, Wiesner, and Salam met in Washington to formulate a plan. Revelle assembled a team of about twenty people, including Harold A. Thomas Jr. from the Division of Applied Science at Harvard. Thomas was the director of Harvard’s water program, which had recently applied systems analysis and linear programming to water resource problems. Computational methods would prove essential to solving the issue. The task force went to Pakistan several times, visiting Punjab and Sindh. Revelle recounted flying over that landscape and seeing the devastation: “Salt lying like snow on the surface and villages of the canal colony grid, here and there derelict, like holes in a punched card.”

Visions of Inequality: From the French Revolution to the End of the Cold War
by
Branko Milanovic
Published 9 Oct 2023
Like the engineers of societal production, they are in charge of output maximization under conditions of given endowments and technology. Markets generate incomes and economists leave the task of further redistribution to those more qualified than them: the politicians. 28 Production and market-determined prices are technical, not historical, categories. This is akin to the situation in linear programming: there are resources, there is demand, there is an optimal output mix—and then there is distribution of what has been produced, with factor rewards just another set of prices. For Marx, as we have seen, the laws of production and the laws of distribution are the same laws, just expressed under different forms.
Handbook of Modeling High-Frequency Data in Finance
by
Frederi G. Viens
,
Maria C. Mariani
and
Ionut Florescu
Published 20 Dec 2011
Moody and Saffell (2001) found that a trading system using direct reinforcement learning outperforms a Q-trader for the asset allocation problem between the S&P500 and T-bill. Dempster and Romahi (2002) compared four methods for foreign exchange trading (reinforcement learning, genetic algorithms, Markov chain linear programming, and simple heuristic) and concluded that a combination of technical indicators leads to better performance than using only individual indicators. Dempster and Leemans (2006) reached a similar conclusion using adaptive reinforcement learning. Bates et al. (2003) used Watkin’s Q-learning algorithm to maximize profits; these authors compared order flow and order book data and compared with technical trading rules.

Trend Following: How Great Traders Make Millions in Up or Down Markets
by
Michael W. Covel
Published 19 Mar 2007
That is to say, mathematicians and physicists have overlooked dynamical systems as random and unpredictable. The only systems that could be understood in the past were those that were believed to be linear, that is to say, systems that follow predictable patterns and arrangements. Linear equations, linear functions, linear algebra, linear programming, and linear accelerators are all areas that have been understood and mastered by the human race. However, the problem arises that we humans do not live in an even remotely linear world; in fact, our world must indeed be categorized as nonlinear; hence, proportion and linearity is scarce. How may one go about pursuing and understanding a nonlinear system in a world that is confined to the easy, logical linearity of everything?

The end of history and the last man
by
Francis Fukuyama
Published 28 Feb 2006
The complexity of modern economies proved to be simply beyond the capabilities of centralized bureaucracies to manage, no matter how advanced their technical capabilities. In place of a demand-driven price system, Soviet planners have tried to decree a “socially just” allocation of resources from above. For many years, they believed that bigger computers and better linear programming would make possible an efficient centralized allocation of resources. This proved to be an illusion. Goskomtsen, the former Soviet state committee on prices, had to review some 200,000 prices every year, or three or four prices per day for every official working in that bureaucracy. This represented only 42 percent of the total number of price decisions made by Soviet officials every year,6 which in turn was only a fraction of the number of pricing decisions that would have to have been made were the Soviet economy able to offer the same diversity of products and services as a Western capitalist economy.

Thank You for Being Late: An Optimist's Guide to Thriving in the Age of Accelerations
by
Thomas L. Friedman
Published 22 Nov 2016
“Technology creates possibilities for new behaviors and experiences and connection,” he added, “but it takes human beings to make the behaviors principled, the experiences meaningful and connections deeper and rooted in shared values and aspirations. Unfortunately, there is no Moore’s law for human progress and moral development. That work is messy and there is no linear program for it. It goes up and down and zigs and zags. It is hard—but there is no other way.” This is especially challenging as cyberspace enters the home. Recall the November 2015 story from Cañon City, Colorado, where more than one hundred students in the local high school were caught trading nude photos and hiding them in secret photo-vault smartphone applications.
Statistics in a Nutshell
by
Sarah Boslaugh
Published 10 Nov 2012
This textbook emphasizes the logical and philosophical problems behind decision making while discussing different approaches to decision analysis. The Economist Newspaper. 1997. Numbers Guide: The Essentials of Business Numeracy. Hoboken, NJ: Wiley. This handy pocket guide describes numerical operations useful in business, including index numbers, interest and mortgage problems, forecasting, hypothesis testing, decision theory, and linear programming. Gordon, Robert J. 1999. “The Boskin Commission Report and its aftermath.” Paper presented at the Conference on the Measurement of Inflation, Cardiff, Wales. http://faculty-web.at.northwestern.edu/economics/gordon/346.pdf. This summarizes criticisms regarding the U.S. Consumer Price Index, including those identified by the 1995 Boskin Commission report, which suggested that the CPI overstated inflation.

A Beautiful Mind
by
Sylvia Nasar
Published 11 Jun 1998
“So we had to invent or perfect the tools.”15 Mostly, according to Duncan Luce, a psychologist who was a consultant at RAND, “RAND capitalized on ideas that surfaced during the war.”16 These were scientific, or at least systematic, approaches to problems that had been previously considered the exclusive province of men of “experience.” They included such topics as logistics, submarine research, and air defense. Operations research, linear programming, dynamic programming, and systems analysis were all techniques that RAND brought to bear on the problem of “thinking the unthinkable.” Of all the new tools, game theory was far and away the most sophisticated. The spirit of quantification, however, was contagious, and it was at RAND, more than anywhere else, that game theory in particular and mathematical modeling in general entered the mainstream of postwar thinking in economics.

The Friendly Orange Glow: The Untold Story of the PLATO System and the Dawn of Cyberculture
by
Brian Dear
Published 14 Jun 2017
It’s also notable that Thorndike’s vision was published more than forty years before Skinner built his first machine, and yet Skinner’s machine lacked that “miracle of mechanical ingenuity,” limiting his machines to the same linear presentation of problems and questions for all students who sat down to use the machine. The idea of a machine that can achieve that miracle, breaking from its linear program to address the truly individual needs of each particular student, was an educational Holy Grail that eluded Skinner’s work. Over the course of his career, Skinner would extend this notion of reinforcement in shaping behavior from rats and pigeons to learning in animals in general, including human learning.
Masterminds of Programming: Conversations With the Creators of Major Programming Languages
by
Federico Biancuzzi
and
Shane Warden
Published 21 Mar 2009
Unfortunately to learn some things, you not only have to think about them but you have to sort of practice, so there’s some stuff—you can go to the Internet and you read it and you say, “Oh, yeah, that works.” And then there’s some stuff where there’s just no substitute for years of hard work. So here you are in the middle of some project and you decide you need to understand linear programming to solve your problem; probably what you’ll get from the Internet will not be helpful, and if you have to solve this problem within a week, you’re unlikely to choose a method that requires a lot of work to learn unless you already know about that—even if it were much better. And that happens.
The Art of Computer Programming: Fundamental Algorithms
by
Donald E. Knuth
Published 1 Jan 1974
As a typical example of a nontrivial algorithm dealing with sparse matrices in this form, we will consider the pivot step operation, which is an important part of algorithms for solving linear equations, for inverting matrices, and for ( 50 10 0 V-30 0 0 0 0 0 20 0 -60 0> 0 0 2.2.6 ARRAYS AND ORTHOGONAL LISTS 303 -1 -f- 1 1 50 2 1 10 -1 -f -1 L '.:!*>.' -1 2 3 20 4 1 -30 4 3 -60 4 4 5 Fig. 14. Representation of matrix A2), with nodes in the format List heads appear at the left and at the top. LEFT UP ROW COL VAL solving linear programming problems by the simplex method. A pivot step is the following matrix transformation: / Pivot row Any other row • • Before pivot step After Any Pivot other Pivot column column column : : \ / : a • ¦ • b • • • c ¦ ¦ ¦ d ••• I/a • ¦ • —c/a pivot step Any other column • b/a • ¦ • d — be/a \ It is assumed that the pivot element, a, is nonzero.

Strategy: A History
by
Lawrence Freedman
Published 31 Oct 2013
Where it initially took root was in the operations research community, to the point that it was described in an early postwar survey as a branch of mathematics special to this field. Here von Neumann appears to have been particularly influential. As one of the government’s top scientific advisers until his premature death from cancer in 1959, he encouraged all means, including linear programming and the increased use of computers, of raising the quality of the scientific input. He saw RAND as an institution that could showcase the new techniques.21 Von Neumann and Morgenstern also found their popularizer. John McDonald’s Strategy in Poker, Business and War is curiously neglected in the histories of game theory.

Engineering Security
by
Peter Gutmann
Some of these criticisms may be warranted, since as pretty much any committee can demonstrate, achieving consensus among participants doesn’t necessarily correspond to the solution that’s decided upon being correct. The fact that soft OR borrows heavily from the social sciences while hard OR is built around game theory, queuing theory, linear programming, and simulation hasn’t helped boost its credibility among the hard OR crowd. In addition being able to quantify the success level (or lack thereof) of a method that’s trying to solve a wicked problem can be quite difficult, so that the effectiveness of soft OR methods can seem rather subjective.

Programming Python
by
Mark Lutz
Published 5 Jan 2011
During the wait, the Tk GUI library runs an event loop that watches for mouse clicks, keyboard presses, and so on. All application program processing happens in the registered callback handlers in response to events. Further, any information needed across events must be stored in long-lived references such as global variables and class instance attributes. The notion of a traditional linear program control flow doesn’t really apply in the GUI domain; you need to think in terms of smaller chunks. In Python, Tk also becomes object oriented simply because Python is object oriented: the tkinter layer exports Tk’s API as Python classes. With tkinter, we can either use a simple function-call approach to create widgets and interfaces, or apply object-oriented techniques such as inheritance and composition to customize and extend the base set of tkinter classes.