
Empirical Market Microstructure: The Institutions, Economics and Econometrics of Securities Trading
by
Joel Hasbrouck
Published 4 Jan 2007
Equity Markets 166 Notes 179 References 183 Index 196 ix This page intentionally left blank Empirical Market Microstructure This page intentionally left blank 1 Introduction 1.1 Overview Market microstructure is the study of the trading mechanisms used for financial securities. There is no “microstructure manifesto,” and historical antecedents to the field can probably be found going back to the beginning of written language, but at some point, the field acquired a distinct identity. As good a starting point as any is the coinage of the term market microstructure in the paper of the same title by Garman (1976): We depart from the usual approaches of the theory of exchange by (1) making the assumption of asynchronous, temporally discrete market activities on the part of market agents and (2) adopting a viewpoint which treats the temporal microstructure, i.e., moment-to-moment aggregate exchange behavior, as an important descriptive aspect of such markets.
…
Amihud, Yakov, and Haim Mendelson, 1987, Trading mechanisms and stock returns: An empirical investigation, Journal of Finance 42, 533–53. Amihud, Yakov, and Haim Mendelson, 1991. Market microstructure and price discovery on the Tokyo Stock Exchange, in William T. Ziemba, Warren Bailley, and Yasushi Hamao, eds., Japanese Financial Market Research, Contributions to Economic Analysis, no. 205 (North Holland, Amsterdam). Amihud, Yakov, Haim Mendelson, and Maurizio Murgia, 1990, Stock market microstructure and return volatility: Evidence from Italy, Journal of Banking and Finance 14, 423–40. Amihud, Yakov, Haim Mendelson, and Lasse Heje Pedersen, 2005, Market microstructure and asset pricing (Stern School, New York University). 183 184 REFERENCES Angel, James J., 1994, Limit versus market orders (School of Business Administration, Georgetown University).
…
Empirical Market Microstructure This page intentionally left blank Empirical Market Microstructure The Institutions, Economics, and Econometrics of Securities Trading Joel Hasbrouck 1 2007 1 Oxford University Press, Inc., publishes works that further Oxford University’s objective of excellence in research, scholarship, and education. Oxford New York Auckland Cape Town Dar es Salaam Hong Kong Karachi Kuala Lumpur Madrid Melbourne Mexico City Nairobi New Delhi Shanghai Taipei Toronto With offices in Argentina Austria Brazil Chile Czech Republic France Greece Guatemala Hungary Italy Japan Poland Portugal Singapore South Korea Switzerland Thailand Turkey Ukraine Vietnam Copyright © 2007 by Oxford University Press Published by Oxford University Press, Inc. 198 Madison Avenue, New York, New York 10016 www.oup.com Oxford is a registered trademark of Oxford University Press All rights reserved.

High-Frequency Trading
by
David Easley
,
Marcos López de Prado
and
Maureen O'Hara
Published 28 Sep 2013
Marcos holds two doctorate degrees from Complutense University, is a recipient of the National Award for Excellence in Academic Performance (Government of Spain), and was admitted into American Mensa with a perfect test score. Maureen O’Hara is the Robert W. Purcell professor of finance at the Johnson Graduate School of Management, Cornell University. Her research focuses on market microstructure, and she is the author of numerous journal articles as well as the book Market Microstructure Theory. Maureen serves on several corporate boards, and is chairman of the board of ITG, a global agency brokerage firm. She is a member of the CFTC-SEC Emerging Regulatory Issues Task Force (the “flash crash” committee), the Global Advisory Board of the Securities Exchange Board of India (SEBI) and the Advisory Board of the Office of Financial Research, US Treasury.
…
Alex holds a PhD in computer science from the University of Geneva and has gained further research experience by working at the University of Oxford and at ETH. Anton Golub has worked at OLSEN since the summer of 2012 as a member of the research team. He performs research in the field of market micro-structure, leveraging the methodology developed at OLSEN. Anton previously worked at the Manchester Business School as a researcher on high-frequency trading, market microstructure and flash crashes. In 2012, he was invited to participate in an international project on computerised trading funded by the ix i i i i i i “Easley” — 2013/10/8 — 11:31 — page x — #10 i i HIGH-FREQUENCY TRADING UK Treasury.
…
US Securities and Exchange Commission and the Commodity Futures Trading Commission, 2010, “Finding Regarding the Market Events of May 6”, Technical Report, September. 89 i i i i i i “Easley” — 2013/10/8 — 11:31 — page 90 — #110 i i i i i i i i “Easley” — 2013/10/8 — 11:31 — page 91 — #111 i i 5 Machine Learning for Market Microstructure and High-Frequency Trading Michael Kearns and Yuriy Nevmyvaka University of Pennsylvania In this chapter, we give an overview of the uses of machine learning for high-frequency trading (HFT) and market microstructure data and problems. Machine learning is a vibrant subfield of computer science that draws on models and methods from statistics, algorithms, computational complexity, artificial intelligence, control theory and a variety of other disciplines.
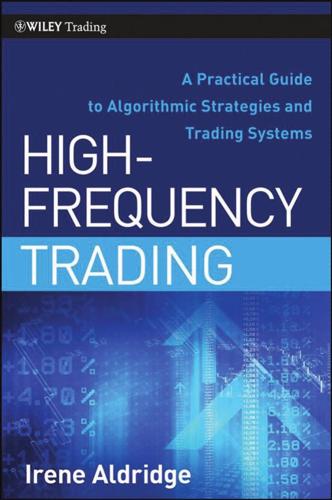
High-Frequency Trading: A Practical Guide to Algorithmic Strategies and Trading Systems
by
Irene Aldridge
Published 1 Dec 2009
., 274, 275, 277, 281, 292–293, 298 Management fees, 32 Margin call close order, 70 Market-aggressiveness selection, 274, 275–276 Market breadth, 62 Market depth, 62, 133 Market efficiency: predictability and, 78–79 profit opportunities and, 75–78 testing for, 79–89 MarketFactory, 25 Market impact costs, 290–293 Market microstructure trading, 4, 127–128 Market microstructure trading, information models, 129, 145–164 asymmetric information measures, 146–148 INDEX bid-ask spreads, 149–157 order aggressiveness, 157–160 order flow, 160–163 Market microstructure trading, inventory models, 127–143 liquidity provision, 133–134, 139–143 order types, 130–131 overview, 129–130 price adjustments, 127–128 profitable market making problems, 134–139 trader types, 131–133 Market-neutral arbitrage, 192–195 Market orders, versus limit orders, 61–63 Market participants, 24–26 Market resilience, inventory trading, 133 Market risk, 252, 253 hedging and, 269–270 measuring of, 254–260 stop losses and, 266 Markov switching models, 110–111 Markowitz, Harry, 202, 209, 213, 214, 295 Mark to market, risk measurement and, 263 Martell, Terrence, 158–159 Martingale hypothesis, market efficiency tests based on, 86–88 MatLab, 25 Maximum drawdown, 50–51 McQueen, Grant V., 179 Mean absolute deviation (MAD), 220–221 Mean absolute percentage error (MAPE), 221 Mean-reversion.
…
HG4529.A43 2010 332.64–dc22 2009029276 Printed in the United States of America 10 9 8 7 6 5 4 3 2 1 To my family Contents Acknowledgments xi CHAPTER 1 Introduction 1 CHAPTER 2 Evolution of High-Frequency Trading 7 Financial Markets and Technological Innovation Evolution of Trading Methodology CHAPTER 3 Overview of the Business of High-Frequency Trading 7 13 21 Comparison with Traditional Approaches to Trading 22 Market Participants 24 Operating Model 26 Economics 32 Capitalizing a High-Frequency Trading Business 34 Conclusion 35 CHAPTER 4 Financial Markets Suitable for High-Frequency Trading 37 Financial Markets and Their Suitability for High-Frequency Trading Conclusion 38 47 v vi CHAPTER 5 CONTENTS Evaluating Performance of High-Frequency Strategies 49 Basic Return Characteristics 49 Comparative Ratios 51 Performance Attribution 57 Other Considerations in Strategy Evaluation 58 Conclusion 60 CHAPTER 6 Orders, Traders, and Their Applicability to High-Frequency Trading 61 Order Types 61 Order Distributions 70 Conclusion 73 CHAPTER 7 Market Inefficiency and Profit Opportunities at Different Frequencies 75 Predictability of Price Moves at High Frequencies 78 Conclusion 89 CHAPTER 8 Searching for High-Frequency Trading Opportunities 91 Statistical Properties of Returns 91 Linear Econometric Models 97 Volatility Modeling 102 Nonlinear Models 108 Conclusion 114 CHAPTER 9 Working with Tick Data 115 Properties of Tick Data 116 Quantity and Quality of Tick Data 117 Bid-Ask Spreads 118 Contents vii Bid-Ask Bounce 120 Modeling Arrivals of Tick Data 121 Applying Traditional Econometric Techniques to Tick Data 123 Conclusion 125 CHAPTER 10 Trading on Market Microstructure: Inventory Models 127 Overview of Inventory Trading Strategies 129 Orders, Traders, and Liquidity 130 Profitable Market Making 134 Directional Liquidity Provision 139 Conclusion 143 CHAPTER 11 Trading on Market Microstructure: Information Models 145 Measures of Asymmetric Information 146 Information-Based Trading Models 149 Conclusion 164 CHAPTER 12 Event Arbitrage 165 Developing Event Arbitrage Trading Strategies 165 What Constitutes an Event?
…
However, several researchers find that technical analysis still has legs: Brock, Lakonishok, and LeBaron (1992) find that moving averages can predict future abnormal returns, while Aldridge (2009a) shows 14 HIGH-FREQUENCY TRADING that moving averages, “stochastics” and relative strength indicators (RSI) may succeed in generating profitable trading signals on intra-day data sampled at hourly intervals. In a way, technical analysis was a precursor of modern microstructure theory. Even though market microstructure applies at a much higher frequency and with a much higher degree of sophistication than technical analysis, both market microstructure and technical analysis work to infer market supply and demand from past price movements. Much of the contemporary high-frequency trading is based on detecting latent market information from the minute changes in the most recent price movements.
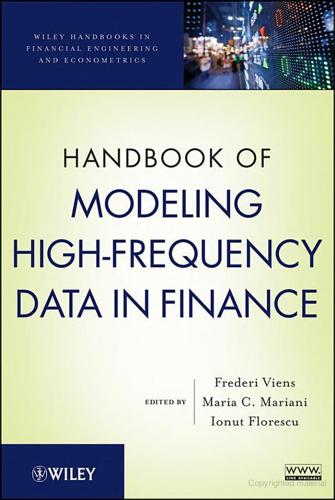
Handbook of Modeling High-Frequency Data in Finance
by
Frederi G. Viens
,
Maria C. Mariani
and
Ionut Florescu
Published 20 Dec 2011
Comment on P. R. Hansen and A. Lunde: realized variance and market microstructure noise. J Bus Econ Stat 2006;24:173–179. Andersen T, Bollerslev T, Meddahi N. Realized volatility forecasting and market microstructure noise. J Econometrics 2010;160:220–234. Bandi FM, Russel JR. Realized covariation, realized beta and microstructure noise. Working Paper, Graduate School of Business, University of Chicago, 2005. Bandi FM, Russel JR. Separating market microstructure noise from volatility. J Financ Econ 2006;79:655–692. Bandi FM, Russell JR. Market microstructure noise, integrated variance estimators, and the accuracy of asymptotic approximations.
…
., xiv, 347, 383 Market capitalization index, 128 Market completeness assumption, 302 Market complexity, modeling of, 99 Market crash, 346 2008, 136 Market index (indices) exponents calculated for, 345 squared returns of, 220 technique for producing, 110 Market index decrease, spread and, 105 Market inefficiencies, for small-space and mid-volume classes, 44 Market microstructure effects, 263 Market microstructure, effects on Fourier estimator, 245 Market microstructure contaminations, 273 Market microstructure model, of ultra high frequency trading, 235–242 Market model, 296–297 Market movement, indicators of, 110 Market reaction, to abnormal price movements, 45 Market-traded option prices, 219 Markov chain, stochastic volatility process with, 401 Markowitz-type optimization, 286 Martingale-difference process, 178.
…
ACKNOWLEDGMENTS The authors are most grateful for the comments and suggestions received from the anonymous reviewers of this chapter and to other participants at the Conference on Modeling High Frequency Data II at the Stevens Institute of Technology. Support funding for this research is also acknowledged to ICASA (Institute of Complex Additive Systems Analysis), New Mexico Institute of Mining and Technology. 242 CHAPTER 9 A Market Microstructure Model REFERENCES Ait-Shalia Y, Yu J. High frequency market microstructure noise estimates and liquidity measures. Ann Appl Stat 2009;1:422–457. Campbell JY, Lo AW, MacKinlay C. The econometrics of financial markets. Princeton, NJ: Princeton University Press; 1997. CFTC-SEC. Findings regarding the market events of May 6, 2010; September 30, 2010.
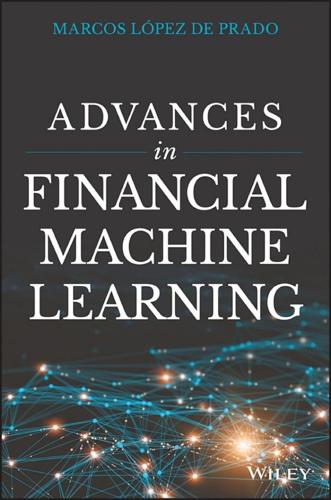
Advances in Financial Machine Learning
by
Marcos Lopez de Prado
Published 2 Feb 2018
Instead, the bar size could be adjusted dynamically as a function of the free-floating market capitalization of a company (in the case of stocks), or the outstanding amount of issued debt (in the case of fixed-income securities). 2.3.2 Information-Driven Bars The purpose of information-driven bars is to sample more frequently when new information arrives to the market. In this context, the word “information” is used in a market microstructural sense. As we will see in Chapter 19, market microstructure theories confer special importance to the persistence of imbalanced signed volumes, as that phenomenon is associated with the presence of informed traders. By synchronizing sampling with the arrival of informed traders, we may be able to make decisions before prices reach a new equilibrium level.
…
They conclude that on timescales of less than a few hours, the persistence of order flow is overwhelmingly due to splitting rather than herding. Given that market microstructure theory attributes the persistency of order flow imbalance to the presence of informed traders, it makes sense to measure the strength of such persistency through the serial correlation of the signed volumes. Such a feature would be complementary to the features we studied in Section 19.5. 19.7 What Is Microstructural Information? Let me conclude this chapter by addressing what I consider to be a major flaw in the market microstructure literature. Most articles and books on this subject study asymmetric information, and how strategic agents utilize it to profit from market makers.
…
Let us review some of the stations involved in the chain of production within a modern asset manager. 1.3.1.1 Data Curators This is the station responsible for collecting, cleaning, indexing, storing, adjusting, and delivering all data to the production chain. The values could be tabulated or hierarchical, aligned or misaligned, historical or real-time feeds, etc. Team members are experts in market microstructure and data protocols such as FIX. They must develop the data handlers needed to understand the context in which that data arises. For example, was a quote cancelled and replaced at a different level, or cancelled without replacement? Each asset class has its own nuances. For instance, bonds are routinely exchanged or recalled; stocks are subjected to splits, reverse-splits, voting rights, etc.; futures and options must be rolled; currencies are not traded in a centralized order book.

Topics in Market Microstructure
by
Ilija I. Zovko
Published 1 Nov 2008
CONTENTS 3.5 Supplementary Material . . . . . . . . . . . . . . . . 3.5.1 Literature review . . . . . . . . . . . . . . . . 3.5.2 Dimensional analysis . . . . . . . . . . . . . . 3.5.3 The London Stock Exchange (LSE) data set . 3.5.4 Opening auction, real order types, time . . . 3.5.5 Measurement of model parameters . . . . . . 3.5.6 Estimating the errors for the regressions . . . 3.5.7 Market impact . . . . . . . . . . . . . . . . . 3.5.8 Extending the model . . . . . . . . . . . . . . . . . . . . . . . 4 Correlation and clustering in the trading of the members of the LSE 4.1 Introduction . . . . . . . . . . . . . . . . . . . . . . . . 4.1.1 The LSE dataset . . . . . . . . . . . . . . . . . 4.1.2 Measuring correlations between strategies . . . 4.2 Significance and structure in the correlation matrices . 4.2.1 Density of the correlation matrix eigenvalue distribution . . . . . . . . . . . . . . . . . . . . 4.2.2 Bootstrapping the largest eigenvalues . . . . . 4.2.3 Clustering of trading behaviour . . . . . . . . . 4.2.4 Time persistence of correlations . . . . . . . . . 4.3 Conclusions . . . . . . . . . . . . . . . . . . . . . . . . 37 37 40 41 43 44 48 52 56 59 59 60 60 64 64 67 68 71 75 5 Market imbalances and stock returns: heterogeneity of order sizes at the LSE 5.1 Introduction . . . . . . . . . . . . . . . . . . . . . . . . 5.2 Distribution of order sizes . . . . . . . . . . . . . . . . 5.3 Order size heterogen. and stock returns . . . . . . . . 5.4 Conclusions . . . . . . . . . . . . . . . . . . . . . . . . 77 77 80 82 94 6 Conclusions 97 vi Chapter 1 Introduction The topic of this thesis is Market microstructure. Market microstructure is an area of finance that studies the dynamics and processes through which investors’ forecasts about future asset values are ultimately translated into the assets’ current prices and trading volumes. The field encompasses also the study of trading rules which regulate the markets and constrain the actions of traders. In even broader terms, research directions that deal with the interrelation between institutional structure, strategic behavior, prices and welfare are all considered market microstructure. The topics investigated in this thesis are also related to the field of Econophysics.
…
Topics in Market Microstructure Ilija I. Zovko Topics in M a rk et Microstru c t u re ! The publication of this book is in part made possible by the Center for Nonlinear Dynamics in Economics and Finance (CeNDEF) at the University of Amsterdam Lay out: LaTeX, http://www.latex-project.org/ Cover design: René Staelenberg, Amsterdam Cover illustration: Wordle by Jonathan Feinberg, http://wordle.net/ ISBN 978 90 5629 538 7 NUR 780 © I. I. Zovko / Vossiuspers UvA – Amsterdam University Press, 2008 All rights reserved. Without limiting the rights under copyright reserved above, no part of this book may be reproduced, stored in or introduced into a retrieval system, or transmitted, in any form or by any means (electronic, mechanical, photocopying, recording or otherwise) without the written permission of both the copyright owner and the author of the book. !
…
Without limiting the rights under copyright reserved above, no part of this book may be reproduced, stored in or introduced into a retrieval system, or transmitted, in any form or by any means (electronic, mechanical, photocopying, recording or otherwise) without the written permission of both the copyright owner and the author of the book. ! Topics in Market Microstructure Academisch Proefschrift ter verkrijging van de graad van doctor aan de Universiteit van Amsterdam op gezag van de Rector Magnificus prof. dr. D.C. van den Boom ten overstaan van een door het college voor promoties ingestelde commissie, in het openbaar te verdedigen in de Agnietenkapel op dinsdag 4 november 2008, te 12.00 uur door Ilija I.
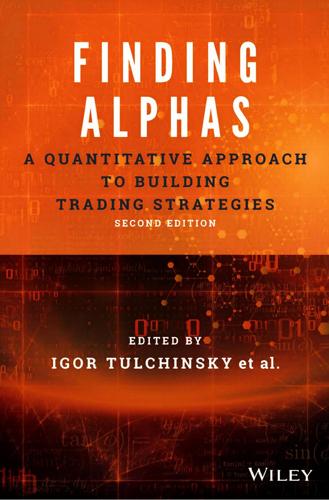
Finding Alphas: A Quantitative Approach to Building Trading Strategies
by
Igor Tulchinsky
Published 30 Sep 2019
These patterns affect the realized return most trivially via the effects of trading turnover – the channel referred to as impact – but they also have indirect effects on alpha performance and can themselves be sources of alpha signals, through characteristics related to the intraday dynamics of the traded assets. Collectively, these properties of the asset market define the market microstructure. Research in market microstructure, as its name suggests, aims to capture the structure of investors by separating distinct classes that differ in their behavior or motivation for trading. Since the milestone paper of Glosten and Milgrom (1985), a wide variety of microstructural patterns has been discovered and documented to significantly affect the expected returns of assets.
…
Second, we discuss the notion of the illiquidity premium that stands for the positive relationship between expected returns and liquidity, with examples for potential alphas. Third, we present mainstream market microstructure models and their implications for asset prices. Finding Alphas: A Quantitative Approach to Building Trading Strategies, Second Edition. Edited by Igor Tulchinsky et al. and WorldQuant Virtual Research Center. © 2020 Tulchinsky et al., WorldQuant Virtual Research Center. Published 2020 by John Wiley & Sons, Ltd. 208 Finding Alphas DATA IN MARKET MICROSTRUCTURE Capital markets can be broadly classified as two types, based on their trading structure. In quote-driven markets, specialists – market participants, also known as market makers or dealers, who serve as counterparties for transactions at their quoted price – provide investors with the opportunity to trade and guarantee the execution at their unique bid and ask prices: the prices at which they are willing to buy and sell, respectively.
…
Trivially, alphas whose trading is concentrated in periods when volume is high and spreads are low perform better after costs. The aforementioned empirical evidence for a positive intraday correlation between spreads and return volatility leads us to question its theoretical basis – that is, how spreads are determined and, in particular, how market microstructure is involved in these patterns. MARKET MICROSTRUCTURE AND EXPECTED RETURNS Apart from allowing us to model the dynamics of liquidity, intraday data enables analysis of the interaction among market participants. In fact, the goal of the latter research direction is often set to find theoretical explanations for empirical patterns documented by the former. 212 Finding Alphas The theories of microstructure take into account the price discovery process and, in general, differentiate among informed traders, uninformed traders, and specialists.

Trading and Exchanges: Market Microstructure for Practitioners
by
Larry Harris
Published 2 Jan 2003
Martin and J. William Petty Debt Management: A Practitioner’s Guide John D. Finnerty and Douglas R. Emery Real Estate Investment Trusts: Structure, Performance, and Investment Opportunities Su Han Chan, John Erickson, and Ko Wang Trading and Exchanges: Market Microstructure for Practitioners Larry Harris Trading and Exchanges market microstructure for Practitioners LARRY HARRIS Oxford New York Auckland Bangkok Buenos Aires Cape Town Chennai Dar es Salaam Delhi Hong Kong Istanbul Karachi Kolkata Kuala Lumpur Madrid Melbourne Mexico City Mumbai Nairobi São Paulo Shanghai Singapore Taipei Tokyo Toronto Copyright © 2003 by Oxford University Press, Inc.
…
We will not consider how to value them, who should trade them, how to design them, or how to issue them. Books about investments and corporate finance examine these questions. Market microstructure is the branch of financial economics that investigates trading and the organization of markets. This field of study has substantially grown in size and importance since the October 1987 stock market crash. This book presents the economics of market microstructure in simple English prose. Although some simple mathematics and graphics appear in a few supplementary examples, I fully explain all essential concepts in the main text. 1.2 OBJECTIVES This book will help you understand how markets work, and how governments and exchanges regulate them.
…
The omission of many excellent works from this bibliography therefore reflects more on me than on them. General Works Belonsky, Gail M., and David M. Modest. 1993. Market microstructure: An empirical retrospective. Working paper, Haas School of Business, University of California, Berkeley. Cohen, Kalman J., Steven F. Maier, Robert A. Schwartz, and David K. Whitcomb. 1986. The Microstructure of Securities Markets (Prentice-Hall, Englewood Cliffs, NJ). Coughenour, Jay, and Kuldeep Shastri. 1999. Symposium on market microstructure: A review of empirical research. Financial Review 34(4), 1–28. Dalton, John M., ed. 1993. How the Stock Market Works (New York Institute of Finance, New York).

Flash Crash: A Trading Savant, a Global Manhunt, and the Most Mysterious Market Crash in History
by
Liam Vaughan
Published 11 May 2020
“Andrei had this grand ambition to build a research enterprise to address that.” Kirilenko prided himself on being a dispassionate scientist, but there was something about the industry’s “nothing to see here” attitude that stuck in his craw. The general public and the press may not have been able to grapple with the finer points of market microstructure, but he sure as hell could; and his work on the crash had shown him that some of the biggest HFT firms weren’t just selflessly providing liquidity. It was a convenient illusion. In late 2012, Adam Clark-Joseph, a young Harvard PhD who spent time at the CFTC, issued a paper titled “Exploratory Trading” that posited that HFT firms routinely fired small, loss-making orders into the market like sonar to gather what he described as “private” information about market conditions before placing much larger orders when they knew they were more likely to profit.
…
He was certainly well positioned to understand the issues at hand. In spring 2012, Thakkar was one of two dozen or so experts from across the futures industry invited to join a new committee set up by the CFTC to examine how regulators might better understand and oversee high-frequency trading. The subcommittee Thakkar was a part of, Market Microstructure, was tasked with exploring the negative and positive ways automated trading impacted markets, and its members talked about spoofing during their regular conference calls and meetings. (Thakkar would remain on the committee for two years, during which Edge continued working on different iterations of NAVTrader.)
…
Others conceded there had been an oversight. We “should have seen this,” said Cornell University’s Maureen O’Hara, who sat on the committee set up by CFTC chairman Gary Gensler to oversee the first inquiry. “Nowadays, market manipulation doesn’t just involve the trades. It’s about the orders.” For academics interested in market microstructure, Sarao’s case reignited a long-running debate about the extent to which unconsummated orders, including spoofs, really impact prices. The University of Houston’s Craig Pirrong, who blogs under the name “The Streetwise Professor,” suggested that Terry Hendershott, the UC Berkeley finance professor and expert witness for the government, had shown that Sarao’s trading had such a small bearing on prices that it served only to undermine the CFTC’s case.
Trading at the Speed of Light: How Ultrafast Algorithms Are Transforming Financial Markets
by
Donald MacKenzie
Published 24 May 2021
Had that meaning survived in today’s everyday usage, which it has not, the entire perspective I’m taking could simply be called “mundane political economy,” even if that might not help boost this book’s sales. 24. What participants mean by “market structure” is similar to what financial economists (following Garman 1976) call “market microstructure”—i.e., “the process by which investors’ latent demands are ultimately translated into prices and volumes” (Madhavan 2000: 205)—a field of study that is touched on briefly at the start of chapter 3. The literature in economics on financial-market microstructure is valuable, but is largely “depoliticized”: although contributors to it are certainly aware that there is often intense conflict over market structure, that conflict, and especially its political aspects, is only occasionally the focus of their analytical attention.
…
HFT firms had boosted trading volumes on exchanges and other trading venues with HFT-friendly features, while other venues were, first, forced by competition to adopt those features, and then chose to embrace them as ways of earning revenue. ATD’s chief inspiration was cofounder David Whitcomb, an academic economist. He taught finance at Rutgers University until his retirement in 1999, and was one of the pioneers of market microstructure theory. While much of economics “abstracts from the mechanics of trading” (O’Hara 1997: 1), researchers in this new field modeled and investigated empirically how particular ways of organizing trading can influence outcomes, and how intermediaries such as market-makers set their prices.1 A crucial step in Whitcomb’s path from this academic specialism to the practice of high-frequency trading was a consultancy contract.
…
Basingstoke, Hants: Palgrave Macmillan. Gabor, Daniela. 2016. “The (Impossible) Repo Trinity: The Political Economy of Repo Markets.” Review of International Political Economy 23/6: 967–1000. Galison, Peter. 2003. Einstein’s Clocks, Poincaré’s Maps: Empires of Time. New York: Norton. Garman, Mark B. 1976. “Market Microstructure.” Journal of Financial Economics 3/3: 257–275. Godechot, Olivier. 2007. Working rich: Salaires, bonus et appropriation du profit dans l’industrie financière. Paris: La Découverte. ________. 2012. “Is Finance Responsible for the Rise in Wage Inequality in France?” Socio-Economic Review 10/3: 447–470. ________. 2013.
Analysis of Financial Time Series
by
Ruey S. Tsay
Published 14 Oct 2001
Tsay Copyright 2002 John Wiley & Sons, Inc. ISBN: 0-471-41544-8 CHAPTER 5 High-Frequency Data Analysis and Market Microstructure High-frequency data are observations taken at fine time intervals. In finance, they often mean observations taken daily or at a finer time scale. These data have become available primarily due to advances in data acquisition and processing techniques, and they have attracted much attention because they are important in empirical study of market microstructure. The ultimate high-frequency data in finance are the transaction-by-transaction or trade-by-trade data in security markets.
…
Nonlinear Models and Their Applications 126 4.1 Nonlinear Models, 128 4.2 Nonlinearity Tests, 152 4.3 Modeling, 161 4.4 Forecasting, 161 4.5 Application, 164 Appendix A. Some RATS Programs for Nonlinear Volatility Models, 168 Appendix B. S-Plus Commands for Neural Network, 169 5. High-Frequency Data Analysis and Market Microstructure 175 5.1 Nonsynchronous Trading, 176 5.2 Bid-Ask Spread, 179 5.3 Empirical Characteristics of Transactions Data, 181 5.4 Models for Price Changes, 187 5.5 Duration Models, 194 5.6 Nonlinear Duration Models, 206 5.7 Bivariate Models for Price Change and Duration, 207 Appendix A. Review of Some Probability Distributions, 212 Appendix B.
…
In Chapter 4, we address nonlinearity in financial time series, introduce test statistics that can discriminate nonlinear series from linear ones, and discuss several nonlinear models. The chapter also introduces nonparametric estimation methods and neural networks and shows various applications of nonlinear models in finance. Chapter 5 is concerned with analysis of high-frequency financial data and its application to market microstructure. It shows that nonsynchronous trading and bid-ask bounce can introduce serial correlations in a stock return. It also studies the dynamic of time duration between trades and some econometric models for analyzing transactions data. In Chapter 6, we introduce continuous-time diffusion models and Ito’s lemma.

How I Became a Quant: Insights From 25 of Wall Street's Elite
by
Richard R. Lindsey
and
Barry Schachter
Published 30 Jun 2007
Being the newbie that I was, I had no idea that Evan was “the father of program trading.”9 He had done the first package trade at Keystone and later moved to Batterymarch, where those early trades involved running across town with decks of punched cards. The athletic aspect to Evan’s electronic trading continued long past the time it was needed for data communications. Few others have been observed doing cartwheels in trading rooms. In between gymnastic events, Evan taught me a great deal about market microstructure, and the incentives of the various participants in the markets. His pioneering work in creating electronic markets, by direct computer links to brokers before the exchanges had moved beyond telephones, presaged much of the complexity of current network of electronic markets, while illuminating the critical relationships and incentives.
…
Prices are determined by agents acting in their singular self-interest. The only way anyone knows a fair, equilibrium price has been established is for prices to overreact in both directions. I have set out to profit by making this process more efficient. In the two areas I really know anything about, options pricing and market microstructure, I read virtually every book and article published on those subjects and then find things to exploit that are not written about. Lastly, no model or mathematical insight can make money on its own. One needs a team that collectively understands every aspect of running a trading business. Becoming a quant is not an individual sport.
…
Prior to joining Cooper Neff, Mr. Sterge was employed by CoreStates Financial Corporation where he was assistant vice president, trading interest rate options from September 1986 to November 1989. In 1991, Mr. Sterge founded a new variety of short term equity trading based on models of stock market microstructure, or how stocks’ bids and offers evolve over time and in response to order flow and other information. Called Active Portfolio Strategies, this business flourished following the acquisition of Cooper Neff by Banque Nationale de Paris (now BNP Paribas) in 1995. Effectively, an internal hedge fund strategy, Active Portfolio Strategies at times managed well over $20 billion in global equity positions for BNP Paribas.

Market Risk Analysis, Quantitative Methods in Finance
by
Carol Alexander
Published 2 Jan 2007
More generally, a considerable body of financial econometrics research has focused on discrete time models for the theory of asset pricing which depends on the assumptions of no arbitrage, single agent optimality and market equilibrium. Indeed, two out of five of the volumes of classic research papers in financial econometrics collected by Lo (2007) are devoted to this issue. I.4.6.2 Analysing Empirical Market Behaviour Market microstructure is the study of price formation and how this is related to trading protocols and trading volume. It is the study of market liquidity, of how prices are formed, of the times between trades and of the determinants of the bid–ask spread. A good survey of research papers in this field is given by Biais et al. (2005).
…
Bernoulli, D. (1738) Specimen theoria novae de mensura sortis. Commentarii Academiae Scientarum Imperialis Petropolitnae 5(2), 175–192. Translated into English by L. Sommer (1954): Exposition of a new theory on the measurement of risk, Econometrica, 22, 23–26. Biais, B.R., Glosten, L. and Spatt, C. (2005) Market microstructure: A survey of micro-foundations, empirical results, and policy implications. Journal of Financial Markets 8, 217–264. Bilmes, J.A. (1998) A gentle tutorial of the EM algorithm and its application to parameter estimation for Gaussian mixture and hidden Markov models. http://crow.ee.washington.edu/people/bulyko/papers/ em.pdf (accessed October 2007).
…
(independent and identically distributed) variables central limit theorem 121 error process 148 financial modelling 186 GEV distribution 101 regression 148, 157, 175 stable distribution 106 stochastic process 134–5 Implicit function 185 Implied volatility 194, 196, 200–1 Implied volatility surface 200–1 Incremental change 31 Indefinite integral 15 Independent events 74 Independent and identically distributed (i.i.d.) variables central limit theorem 121 error process 148 financial modelling 186 GEV distribution 101 regression 148, 157, 175 stable distribution 106 stochastic process 134–5 284 Index Independent variable 72, 143 random 109–10, 115, 140 Index tracking regression model 182–3 Indicator function 6 Indices, laws 8 Indifference curves 248–9 Inequality constraint, minimum variance portfolio 245–6 Inference 72, 118–29, 141 central limit theorem 120–1 confidence intervals 72, 118–24 critical values 118–20, 122–3, 129 hypothesis tests 124–5 means 125–7 non-parametric tests 127–9 quantiles 118–20 variance 126–7 Inflexion points 14, 35 Information matrix 133, 203 Information ratio 257, 259 Instability, finite difference approximation 209–10 Integrated process, discrete time 134–6 Integration 3, 15–16, 35 Intensity, Poisson distribution 88 Interest rate 34, 171–3 Interest rate sensitivity 34 Interpolation 186, 193–200, 223 cubic spline 197–200 currency option 195–7 linear/bilinear 193–5 polynomial 195–7 Intrinsic value of option 215 Inverse function 6–7, 35 Inverse matrix 41, 43–4, 133 Investment bank 225 Investment 2, 256–7 Investor risk tolerance 230–1, 237 Irrational numbers 7 Isoquants 248 Iteration 186–93, 223 bisection method 187–8 gradient method 191–3 Newton–Raphson method 188–91 Itô’s lemma 138–9, 219 iTraxx Europe credit spread index 172 Jacobian matrix 202 Jarque–Bera normality test Jensen’s alpha 257–8 158 Joint density function 114–15 Joint distribution function 114–15 Joint probability 73 Jumps, Poisson process 139 Kappa indices 263–5 Kernel 106–7 Kolmogorov–Smirnoff test 128 Kuhn–Tucker conditions 30 Kurtosis 81–3, 94–6, 205–6 Lagrange multiplier (LM) test 124, 167 Lagrange multiplier 29–30, 244 Lagrangian function 29–30 Lattice 186, 210–16, 223 Laws of indices 8 Least squares OLS estimation 143–4, 146–50, 153–61, 163, 170–1, 176 problems 201–2 weighted 179 Leptokurtic density 82–3 Levenberg–Marquardt algorithm 202 Lévy distribution 105 Likelihood function 72, 130–31 MLE 72, 130–34, 141, 202–3 optimization 202–3 ratio test 124, 167 Linear function 4–5 Linear interpolation 193–5 Linear portfolios 33, 35 correlation matrix 55–60 covariance matrix 55–61 matrix algebra 55–61 P&L 57–8 returns 25, 56–8 volatility 57–8 Linear regression 143–84 Linear restrictions, hypothesis tests 165–6 Linear transformation 48 Linear utility function 233 LM (Lagrange multiplier) 29–30, 124, 167, 244 Local maxima 14, 28–9 Local minima 14, 28–9 Logarithmic utility function 232 Logarithm, natural 1, 9, 34–5 Log likelihood 131–2 Lognormal distribution 93–4, 213–14, 218–20 Log returns 16, 19–25 Index Long portfolio 3, 17, 238–40 Long-short portfolio 17, 20–1 Low discrepancy sequences 217 Lower triangular square matrix 62, 64 LR (likelihood ratio) test 124, 167 LU decomposition, matrix 63–4 Marginal densities 108–9 Marginal distributions 108–9 Marginal probability 73–4 Marginal utility 229–30 Market behaviour 180–1 Market beta 250 Market equilibrium 252 Market maker 2 Market microstructure 180 Market portfolio 250–1 Market risk premium, CAPM 253 Markets complete 212 regime-specific behaviour 96–7 Markowitz, Harry 226, 238, 266 Markowitz problem 200–1, 226, 244–5 Matrix algebra 37–70 application 38–47 decomposition 61–4, 70 definite matrix 37, 46–7, 54, 58–9, 70 determinant 41–3, 47 eigenvalues/vectors 37–8, 48–54, 59–61, 70 functions of several variables 27–31 general linear model 161–2 hypothesis testing 165–6 invariant 62 inverse 41, 43–4 law 39–40 linear portfolio 55–61 OLS estimation 159–61 PCA 64–70 product 39–40 quadratic form 37, 45–6, 54 regression 159–61, 165–6 simultaneous equation 44–5 singular matrix 40–1 terminology 38–9 Maxima 14, 28–31, 35 Maximum likelihood estimation (MLE) 72, 130–4, 141, 202–3 Mean confidence interval 123 Mean excess loss 104 Mean reverting process 136–7 Mean 78–9, 125–6, 127, 133–4 285 Mean square error 201 Mean–variance analysis 238 Mean–variance criterion, utility theory 234–7 Minima 14, 28–31, 35 Minimum variance portfolio 3, 240–7 Mixture distribution 94–7, 116–17, 203–6 MLE (maximum likelihood estimation) 72, 130–4, 141, 202–3 Modified duration 2 Modified Newton method 192–3 Moments probability distribution 78–83, 140 sample 82–3 Sharpe ratio 260–3 Monotonic function 13–14, 35 Monte Carlo simulation 129, 217–22 correlated simulation 220–2 empirical distribution 217–18 random numbers 217 time series of asset prices 218–20 Multicollinearity 170–3, 184 Multiple restrictions, hypothesis testing 166–7 Multivariate distributions 107–18, 140–1 bivariate 108–9, 116–17 bivariate normal mixture 116–17 continuous 114 correlation 111–14 covariance 110–2 independent random variables 109–10, 114 normal 115–17, 220–2 Student t 117–18 Multivariate linear regression 158–75 BHP Billiton Ltd 162–5, 169–70, 174–5 confidence interval 167–70 general linear model 161–2 hypothesis testing 163–6 matrix notation 159–61 multicollinearity 170–3, 184 multiple regression in Excel 163–4 OLS estimation 159–61 orthogonal regression 173–5 prediction 169–70 simple linear model 159–61 Multivariate Taylor expansion 34 Mutually exclusive events 73 Natural logarithm 9, 34–5 Natural spline 198 Negative definite matrix 46–7, 54 Newey–West standard error 176 286 Index Newton–Raphson iteration 188–91 Newton’s method 192 No arbitrage 2, 179–80, 211–12 Non-linear function 1–2 Non-linear hypothesis 167 Non-linear portfolio 33, 35 Non-parametric test 127–9 Normal confidence interval 119–20 Normal distribution 90–2 Jarque–Bera test 158 log likelihood 131–2 mixtures 94–7, 140–1, 203–6 multivariate 115–16, 220–2 standard 218–19 Normalized eigenvector 51–3 Normalized Student t distribution 99 Normal mixture distribution 94–7, 116–17, 140–1 EM algorithm 203–6 kurtosis 95–6 probabilities of variable 96–7 variance 94–6 Null hypothesis 124 Numerical methods 185–223 binomial lattice 210–6 inter/extrapolation 193–200 iteration 186–93 Objective function 29, 188 Offer price 2 Oil index, Amex 162–3, 169–70, 174 OLS (ordinary least squares) estimation 143–4, 146–50 autocorrelation 176 BHP Billiton Ltd case study 163 heteroscedasticity 176 matrix notation 159–61 multicollinearity 170–1 properties of estimator 155–8 regression in Excel 153–5 Omega statistic 263–5 One-sided confidence interval 119–20 Opportunity set 246–7, 251 Optimization 29–31, 200–6, 223 EM algorithm 203–6 least squares problems 201–2 likelihood methods 202–3 numerical methods 200–5 portfolio allocation 3, 181 Options 1–2 American 1, 215–16 Bermudan 1 call 1, 6 currency 195–7 European 1–2, 195–6, 212–13, 215–16 finite difference approximation 206–10 pay-off 6 plain vanilla 2 put 1 Ordinary least squares (OLS) estimation 143–4, 146–50 autocorrelation 176 BHP Billiton Ltd case study 163 heteroscedasticity 176 matrix notation 159–61 multicollinearity 170–1 properties of estimators 155–8 regression in Excel 153–5 Orthogonal matrix 53–4 Orthogonal regression 173–5 Orthogonal vector 39 Orthonormal matrix 53 Orthonormal vector 53 Out-of-sample testing 183 P&L (profit and loss) 3, 19 backtesting 183 continuous time 19 discrete time 19 financial returns 16, 19 volatility 57–8 Pairs trading 183 Parabola 4 Parameter notation 79–80 Pareto distribution 101, 103–5 Parsimonious regression model 153 Partial derivative 27–8, 35 Partial differential equation 2, 208–10 Pay-off, option 6 PCA (principal component analysis) 38, 64–70 definition 65–6 European equity indices 67–9 multicollinearity 171 representation 66–7 Peaks-over-threshold model 103–4 Percentage returns 16, 19–20, 58 Percentile 83–5, 195 Performance measures, RAPMs 256–65 Period log returns 23–5 Pi 7 Index Piecewise polynomial interpolation 197 Plain vanilla option 2 Points of inflexion 14, 35 Poisson distribution 87–9 Poisson process 88, 139 Polynomial interpolation 195–7 Population mean 123 Portfolio allocation 237–49, 266 diversification 238–40 efficient frontier 246–9, 251 Markowitz problem 244–5 minimum variance portfolio 240–7 optimal allocation 3, 181, 247–9 Portfolio holdings 17–18, 25–6 Portfolio mathematics 225–67 asset pricing theory 250–55 portfolio allocation 237–49, 266 RAPMs 256–67 utility theory 226–37, 266 Portfolios bond portfolio 37 delta-hedged 208 linear 25, 33, 35, 55–61 minimum variance 3, 240–7 non-linear 33, 35 rebalancing 17–18, 26, 248–9 returns 17–18, 20–1, 91–2 risk factors 33 risk free 211–12 stock portfolio 37 Portfolio volatility 3 Portfolio weights 3, 17, 25–6 Positive definite matrices 37, 46–7, 70 correlation matrix 58–9 covariance matrix 58–9 eigenvalues/vectors 54 stationary point 28–9 Posterior probability 74 Post-sample prediction 183 Power series expansion 9 Power utility functions 232–3 Prediction 169–70, 183 Price discovery 180 Prices ask price 2 asset price evolution 87 bid price 2 equity 172 generating time series 218–20 lognormal asset prices 213–14 market microstructure 180 offer price 2 stochastic process 137–9 Pricing arbitrage pricing theory 257 asset pricing theory 179–80, 250–55 European option 212–13 no arbitrage 211–13 Principal cofactors, determinants 41 Principal component analysis (PCA) 38, 64–70 definition 65–6 European equity index 67–9 multicollinearity 171 representation 66–7 Principal minors, determinants 41 Principle of portfolio diversification 240 Prior probability 74 Probability and statistics 71–141 basic concepts 72–85 inference 118–29 laws of probability 73–5 MLE 130–4 multivariate distributions 107–18 stochastic processes 134–9 univariate distribution 85–107 Profit and loss (P&L) 3, 19 backtesting 183 continuous time 19 discrete time 19 financial returns 16, 19 volatility 57–8 Prompt futures 194 Pseudo-random numbers 217 Put option 1, 212–13, 215–16 Quadratic convergence 188–9, 192 Quadratic form 37, 45–6, 54 Quadratic function 4–5, 233 Quantiles 83–5, 118–20, 195 Quartiles 83–5 Quasi-random numbers 217 Random numbers 89, 217 Random variables 71 density/distribution function 75 i.i.d. 101, 106, 121, 135, 148, 157, 175 independent 109–10, 116, 140–1 OLS estimators 155 sampling 79–80 Random walks 134–7 Ranking investments 256 287 288 Index RAPMs (risk adjusted performance measures) 256–67 CAPM 257–8 kappa indices 263–5 omega statistic 263–5 Sharpe ratio 250–1, 252, 257–63, 267 Sortino ratio 263–5 Realization, random variable 75 Realized variance 182 Rebalancing of portfolio 17–18, 26, 248–9 Recombining tree 210 Regime-specific market behaviour 96–7, 117 Regression 143–84 autocorrelation 175–9, 184 financial applications 179–83 heteroscedasticity 175–9, 184 linear 143–84 multivariate linear 158–75 OLS estimator properties 155–8 simple linear model 144–55 Relative frequency 77–8 Relative risk tolerance 231 Representation, PCA 66–7 Residuals 145–6, 157, 175–8 Residual sum of squares (RSS) 146, 148–50, 159–62 Resolution techniques 185–6 Restrictions, hypothesis testing 165–7 Returns 2–3, 16–26 absolute 58 active 92, 256 CAPM 253–4 compounding 22–3 continuous time 16–17 correlated simulations 220 discrete time 16–17, 22–5 equity index 96–7 geometric Brownian motion 21–2 linear portfolio 25, 56–8 log returns 16, 19–25 long-short portfolio 20–1 multivariate normal distribution 115–16 normal probability 91–2 P&L 19 percentage 16, 19–20, 59–61 period log 23–5 portfolio holdings/weights 17–18 risk free 2 sources 25–6 stochastic process 137–9 Ridge estimator, OLS 171 Risk active risk 256 diversifiable risk 181 portfolio 56–7 systematic risk 181, 250, 252 Risk adjusted performance measure (RAPM) 256–67 CAPM 257–8, 266 kappa indices 263–5 omega statistic 263–5 Sharpe ratio 251, 252, 257–63, 267 Sortino ratio 263–5 Risk averse investor 248 Risk aversion coefficients 231–4, 237 Risk factor sensitivities 33 Risk free investment 2 Risk free portfolio 211 Risk free returns 2 Risk loving investors 248–9 Risk neutral valuation 211–12 Risk preference 229–30 Risk reversal 195–7 Risk tolerance 230–1, 237 Robustness 171 Roots 3–9, 187 RSS (residual sum of squares) 146, 148–50, 159–62 S&P 100 index 242–4 S&P 500 index 204–5 Saddle point 14, 28 Sample 76–8, 82–3 Sampling distribution 140 Sampling random variable 79–80 Scalar product 39 Scaling law 106 Scatter plot 112–13, 144–5 SDE (stochastic differential equation) 136 Security market line (SML) 253–4 Self-financing portfolio 18 Sensitivities 1–2, 33–4 Sharpe ratio 257–63, 267 autocorrelation adjusted 259–62 CML 251, 252 generalized 262–3 higher moment adjusted 260–2 making decision 258 stochastic dominance 258–9 Sharpe, William 250 Short portfolio 3, 17 22, 134, Index Short sales 245–7 Short-term hedging 182 Significance level 124 Similarity transform 62 Similar matrices 62 Simple linear regression 144–55 ANOVA and goodness of fit 149–50 error process 148–9 Excel OLS estimation 153–5 hypothesis tests 151–2 matrix notation 159–61 OLS estimation 146–50 reporting estimated model 152–3 Simulation 186, 217–22 Simultaneous equations 44–5 Singular matrix 40–1 Skewness 81–3, 205–6 Smile fitting 196–7 SML (security market line) 253–4 Solver, Excel 186, 190–1, 246 Sortino ratio 263–5 Spectral decomposition 60–1, 70 Spline interpolation 197–200 Square matrix 38, 40–2, 61–4 Square-root-of-time scaling rule 106 Stable distribution 105–6 Standard deviation 80, 121 Standard error 80, 169 central limit theorem 121 mean/variance 133–4 regression 148–9 White’s robust 176 Standard error of the prediction 169 Standardized Student t distribution 99–100 Standard normal distribution 90, 218–19 Standard normal transformation 90 Standard uniform distribution 89 Stationary point 14–15, 28–31, 35 Stationary stochastic process 111–12, 134–6 Stationary time series 64–5 Statistical arbitrage strategy 182–3 Statistical bootstrap 218 Statistics and probability 71–141 basic concepts 72–85 inference 118–29 law of probability 73–5 MLE 130–4 multivariate distribution 107–18 stochastic process 134–9 univariate distribution 85–107 Step length 192 Stochastic differential equation (SDE) 22, 134, 136 Stochastic dominance 227, 258–9 Stochastic process 72, 134–9, 141 asset price/returns 137–9 integrated 134–6 mean reverting 136–7 Poisson process 139 random walks 136–7 stationary 111–12, 134–6 Stock portfolio 37 Straddle 195–6 Strangle 195–7 Strictly monotonic function 13–14, 35 Strict stochastic dominance 258 Structural break 175 Student t distribution 97–100, 140 confidence intervals 122–3 critical values 122–3 equality of means/variances 127 MLE 132 multivariate 117–18 regression 151–3, 165, 167–8 simulation 220–2 Sum of squared residual, OLS 146 Symmetric matrix 38, 47, 52–4, 61 Systematic risk 181, 250, 252 Tail index 102, 104 Taylor expansion 2–3, 31–4, 36 applications 33–4 approximation 31–4, 36 definition 32–3 multivariate 34 risk factor sensitivities 33 Theory of asset pricing 179–80, 250–55 Tic-by-tic data 180 Time series asset prices/returns 137–9, 218–20 lognormal asset prices 218–20 PCA 64–5 Poisson process 88 regression 144 stochastic process 134–9 Tobin’s separation theorem 250 Tolerance levels, iteration 188 Tolerance of risk 230–1, 237 Total derivative 31 Total sum of square (TSS) 149, 159–62 289 290 Index Total variation, PCA 66 Tower law for expectations 79 Traces of matrix 62 Tradable asset 1 Trading, regression model 182–3 Transition probability 211–13 Transitive preferences 226 Transposes of matrix 38 Trees 186, 209–11 Treynor ratio 257, 259 TSS (total sum of squares) 149, 159–62 Two-sided confidence interval 119–21 Unbiased estimation 79, 81, 156–7 Uncertainty 71 Unconstrained optimization 29 Undiversifiable risk 252 Uniform distribution 89 Unit matrix 40–1 Unit vector 46 Univariate distribution 85–107, 140 binomial 85–7, 212–13 exponential 87–9 generalized Pareto 101, 103–5 GEV 101–3 kernel 106–7 lognormal 93–4, 213–14, 218–20 normal 90–7, 115–16, 131–2, 140, 157–8, 203–6, 217–22 normal mixture 94–7, 140, 203–6 Poisson 87–9 sampling 100–1 stable 105–6 Student t 97–100, 122–3, 126, 132–3, 140–1, 151–3, 165–8, 220–2 uniform 89 Upper triangular square matrix 62, 64 Utility theory 226–37, 266 mean–variance criterion 234–7 properties 226–9 risk aversion coefficient 231–4, 237 risk preference 229–30 risk tolerance 230–1, 237 Value at risk (VaR) 104–6, 185, 194 Vanna–volga interpolation method 196 Variance ANOVA 143–4, 149–50, 154, 159–60, 164–5 confidence interval 123–4 forecasting 182 minimum variance portfolio 3, 240–7 mixture distribution 94–6 MLE 133 normal mixture distribution 95–6 portfolio volatility 3 probability distribution 79–81 realized 182 tests on variance 126–7 utility theory 234–7 VaR (value at risk) 104–6, 185, 194 Vector notation, functions of several variables 28 Vectors 28, 37–9, 48–54, 59–61, 70 Venn diagram 74–5 Volatility equity 3, 172–3 implied volatility 194, 196–7, 200–1 interpolation 194, 196–7 linear portfolio 57–8 long-only portfolio 238–40 minimum variance portfolio 240–4 portfolio variance 3 Volpi, Leonardo 70 Vstoxx index 172 Waiting time, Poisson process 88–9 Wald test 124, 167 Weakly stationary process 135 Weak stochastic dominance 258–9 Weibull distribution 103 Weighted least squares 179 Weights, portfolio 3, 17, 25–6 White’s heteroscedasticity test 177–8 White’s robust standard errors 176 Wiener process 22, 136 Yield 1, 197–200 Zero matrix 39 Z test 126
Mathematics of the Financial Markets: Financial Instruments and Derivatives Modelling, Valuation and Risk Issues
by
Alain Ruttiens
Published 24 Apr 2013
For a time sub-interval of width h, a realized volatility can be modeled by starting from the following relationship, assuming a continuous sample path over h: Clearly, going further would exceed the framework of this book.10 Entering into such time sub-intervals is relevant to the broader field of market microstructure, which studies how successive market prices (called tick data) are actually affected by the successive trading orders. Market microstructure represents one of the most ambitious and sophisticated research areas in the field of modeling of the financial markets. 12.4 MODELING THE CORRELATION It makes sense to also deal in this chapter with correlation modeling.
…
Figure 15.5 Diagram of a neural network performing a multi-linear regression The major problem with the application of NNs to forecast financial time series is that, as has already appeared in previous sections, financial time series are all but stable in their behavior over time. Hence the revival of this technique, aiming at applying it short term as a tool for market microstructure analysis.7 15.2 POTENTIAL TROUBLES WITH DERIVATIVES VALUATION It's puzzling why bankers have come up with these new ways to lose money when the old ways were working so well. John STUMPF, CEO Wells Fargo8 Throughout this book, we have presented the main quantitative methods to value financial instruments, and outlined some more sophisticated ones, that represent the unceasing research to improve them.

Trend Following: How Great Traders Make Millions in Up or Down Markets
by
Michael W. Covel
Published 19 Mar 2007
Larry Harris, Trading and Exchanges: Market Microstructure for Practitioners. New York: Oxford University Press, 2003. 8. David Greising, How Managed Funds Managed to Do So Poorly. Business Week, No. 3294 (November 23, 1992), 112. 9. Daniel P. Collins, The Return of Long-Term Trend Following. Futures, Vol. 32, No. 4 (March 2003), 68–73. 10. Desmond McRae, Top Traders. Managed Derivatives (May 1996). 11. Trend Following: Performance, Risk and Correlation Characteristics. White Paper, Graham Capital Management. 12. Larry Harris, Trading and Exchanges: Market Microstructure for Practitioners. New York: Oxford University Press, 2003. 13.
…
Ginger Szala, Tom Shanks: Former “Turtle” Winning Race the Hard Way. Futures, Vol. 20, No. 2 (January 15, 1991), 78. 29. Carla Cavaletti, Turtles on the Move. Futures, Vol. 27 (June 1998), 79. 30. Laurie Kaplan, Turning Turtles into Traders. Managed Derivatives (May 1996). 31. Larry Harris, Trading and Exchanges: Market Microstructure for Practioners. New York: Oxford University Press, 2003. 32. Larry Harris, The Winners and Losers of the Zero-Sum Game: The Origins of Trading Profits, Price Efficiency and Market Liquidity. Draft 0.911, May 7, 1993. 33. Larry Harris, The Winners and Losers of the Zero-Sum Game: The Origins of Trading Profits, Price Efficiency and Market Liquidity.
…
Active Trader (July 2000). 6. Mark Rzepczynski, Portfolio Diversification: Investors Just Don’t Seem to Have Enough. JWH Journal. 7. Jack Reerink, The Power of Leverage. Futures, Vol. 24, No. 4 (April 1995). 8. Edward O. Thorp, The Mathematics of Gambling. Hollywood, CA, 1984. 9. Larry Harris, Trading and Exchanges: Market Microstructure for Practitioners. New York: Oxford University Press, 2003. 10. Going Once, Going Twice. Discover (August 2002), 23. 11. Jim Little, Sol Waksman, A Perspective on Risk. Barclay Managed Futures Report. 12. Craig Pauley, How to Become a CTA. Based on Chicago Mercantile Exchange Seminars, 1992–1994.
Nerds on Wall Street: Math, Machines and Wired Markets
by
David J. Leinweber
Published 31 Dec 2008
Being the newbie that I was, I had no idea that Evan was “the father of program trading.”14 He had done the first package trade, at Keystone, and later moved to Batterymarch, where those early trades involved running across town with decks of punched cards. The athletic aspect to Evan’s electronic trading continued long past the time it was needed for data communications. Few others have been observed doing cartwheels in trading rooms. In between gymnastic events, Evan taught me a great deal about market microstructure, and the incentives of the various participants in the markets. His pioneering work in creating electronic markets, by direct computer links to brokers before the exchanges had moved beyond telephones, presaged much of the complexity of the current network of electronic markets, while illuminating the critical relationships and incentives.
…
People set up jumbo magnifying lens devices to project them onto walls. Back then, people traded faster than the machines could keep up with, so delay meters were installed on the floor. Delay indicators are still found on modern electronic feeds. People saved tapes and studied them. You could say they were the first high-frequency market microstructure studies. Here’s a fellow doing just that. This looks like my office, but neater—a foreshock of the information explosion we have today. 20 Nerds on Wall Str eet On the floor, there were “human Quotrons” who used to pick up the most recent end of tape and follow it back in time to find the latest price quotes for specific stocks.
…
He apparently realized that, despite his instincts as a former academic, some things are more valuable unpublished. Subsequent in-house developments made D.E. Shaw a leader (reportedly) in electronic market making, statistical arbitrage, and other fast electronic trading strategies. David Whitcomb, a market microstructure economist at Rutgers University and coauthor of a 1988 book on electronic trading strategies,8 faced the same sort of skepticism selling his ideas to Wall Street. Finding no institutional backing, he joined forces with a computer scientist colleague to found Automated Trading Desk (ATD) in the proverbial garage in Charleston, South Carolina.
The End of Theory: Financial Crises, the Failure of Economics, and the Sweep of Human Interaction
by
Richard Bookstaber
Published 1 May 2017
New York: Perennial. Kyle, Albert S. 1985. “Continuous Auctions and Insider Trading.” Econometrica 53, no. 6: 1315–35. http://www.jstor.org/stable/1913210. Kyle, Albert S., and Anna A. Obizhaeva. 2011a. “Market Microstructure Invariants: Empirical Evidence from Portfolio Transitions.” Social Science Research Network, December 12. doi: 10.2139/ssrn.1978943. ———. 2011b. “Market Microstructure Invariants: Theory and Implications of Calibration.” Social Science Research Network, December 12. doi: 10.2139/ssrn.1978932. Kyle, Albert S., and Wei Xiong. 2001. “Contagion as a Wealth Effect.” Journal of Finance 56, no. 4: 1401–40. doi: 10.1111/0022-1082.00373.
Alpha Trader
by
Brent Donnelly
Published 11 May 2021
Then you are smarter, more knowledgeable and more nimble than the competition and built to survive in the long run. Part Three is a study of the specific methodologies and mathematics you need to understand to achieve these goals. Let’s go to Chapter 8, where we will go into some depth on a topic I have always found supremely fascinating: market microstructure. 99. Leung, Woon Sau and Wong, Gabriel and Wong, Woon K., “Social-Media Sentiment, Portfolio Complexity, and Stock Returns” (2019). 100. A Macro Tourist is a trader or investor who takes a position in a market they don’t know very well, in an attempt to profit from a popular narrative. The appearance of macro tourists often makes the locals want to run for the hills.
…
If your products are deep and your volume is easily absorbed, life is good. If not, be thoughtful and strategic about what time of day you execute, and partner with a market maker you trust. This concludes our discussion of liquidity and how activity varies by time of day. The last facet of market microstructure we will cover is volatility. First row of x-axis label is GMT, second row is NYC time 4. Volatility The next step in understanding how your market moves is to understand your product’s volatility. Market professionals often call volatility “vol”. Vol is a critical part of a market’s microstructure.
…
A solid understanding of microstructure will improve your executions, increase the payout on your good ideas and reduce the cost of your bad ones. Even if you are confident in your knowledge of your market’s microstructure, be on the lookout for changes and stay abreast of developments that might change how your market behaves. Simple changes to market microstructure can often lead to significant changes in your P&L and can turn profitable strategies into duds. Now, let’s move to the next step. In Chapter 9, I will tell you how I stay in touch with the narrative, and how that helps me forecast future moves and come up with trade ideas. 101. If you are a huge Elon Musk fan or if you really can’t stand him for some reason, don’t trade TSLA.
Beyond the Random Walk: A Guide to Stock Market Anomalies and Low Risk Investing
by
Vijay Singal
Published 15 Jun 2004
Sarig Value Based Management: The Corporate Response to Shareholder Revolution John D. Martin and J. William Petty Debt Management: A Practitioner’s Guide John D. Finnerty and Douglas R. Emery Real Estate Investment Trusts: Structure, Performance, and Investment Opportunities Su Han Chan, John Erickson, and Ko Wang Trading and Exchanges: Market Microstructure for Practitioners Larry Harris BEYOND THE RANDOM WALK A Guide to Stock Market Anomalies and Low-Risk Investing VIJAY SINGAL PH.D., CFA 2003 Oxford New York Auckland Bangkok Buenos Aires Cape Town Chennai Dar es Salaam Delhi Hong Kong Istanbul Karachi Kolkata Kuala Lumpur Madrid Melbourne Mexico City Mumbai Nairobi São Paulo Shanghai Taipei Tokyo Toronto Copyright © 2003 by Oxford University Press, Inc.
…
., and Jeff Madura. 2003. What Drives Stock Price Behavior Following Extreme One-Day Returns. Journal of Financial Research 26(1), 129–46. Nofsinger, John R. 2001. The Impact of Public Information on Investors. Journal of Banking and Finance 25, 1139–366. Short-Term Price Drift Park, Jinwoo. 1995. A Market Microstructure Explanation for Predictable Variations in Stock Returns Following Large Price Changes. Journal of Financial and Quantitative Analysis 30, 241–56. Pritamani, Mahesh, and Vijay Singal. 2001. Return Predictability Following Large Price Changes and Information Releases. Journal of Banking and Finance 25(4), 631–56.

Flash Boys: Not So Fast: An Insider's Perspective on High-Frequency Trading
by
Peter Kovac
Published 10 Dec 2014
As you’d expect, they are looking out for their own interests, not ours. Conspiracy of Press Releases “The game is now clear to me,” Brad said. “There’s not a press release I don’t understand.” Lewis presents us with a curious standard: if one can understand press releases, it qualifies one as an expert in capital market microstructure. More curious still is the understanding of press releases that is required. Apparently, every press release is a coded message from the high-frequency conspiracy. According to Lewis, NASDAQ’s missive on their August 22, 2013, outage – “what they said was a technical glitch in the SIP” – wasn’t really about a technical glitch in the SIP.
Trend Commandments: Trading for Exceptional Returns
by
Michael W. Covel
Published 14 Jun 2011
Mauboussin and Kristen Bartholdson, “Integrating the Outliers: Two Lessons from the St. Petersburg Paradox.” The Consilient Observer. Vol. 2, No. 2, January 28, 2003. 5. “Trend Following: Performance, Risk, and Correlation Characteristics.” White Paper, Graham Capital Management. See http://www.grahamcapital.com. Zero-Sum 1. Larry Harris, Trading and Exchanges: Market Microstructure for Practitioners. New York: Oxford University Press, 2003. 2. Larry Harris, “The Winners and Losers of the Zero-Sum Game: The Origins of Trading Profits, Price Efficiency and Market Liquidity.” Draft 0.911, May 7, 1993. 3. Ibid. 4. Dave Druz interview with Covel, 2011. 5. Ibid. 6.
The Middleman Economy: How Brokers, Agents, Dealers, and Everyday Matchmakers Create Value and Profit
by
Marina Krakovsky
Published 14 Sep 2015
See “Home Buyers and Sellers Survey Shows Lingering Impact of Tight Credit” (National Association of Realtors, press release, November 13, 2013). 10.Brooks Barnes and Hunter Atkins, “Hollywood’s Old-Time Star Makers Are Swooping In on YouTube’s Party,” New York Times, September 15, 2014; and Katherine Rosman, “Grumpy Cat Has an Agent, and Now a Movie Deal,” Wall Street Journal, May 31, 2013. 11.Noam Cohen, “When Stars Twitter, a Ghost May Be Lurking,” New York Times, March 26, 2009; and Evan Dashevsky, “Who’s Writing Your Favorite Celebrity’s Tweets,” PC World, November 2013. 12.Daniel F. Spulber, Market Microstructure: Intermediaries and the Theory of the Firm (New York: Cambridge University Press, 1999), 21. 13.E-mail correspondence with Daniel Spulber, September 28, 2011. See also Daniel F. Spulber, “Should Business Method Inventions Be Patentable?” Journal of Legal Analysis 3, no. 1(2011): 279. 14.Interview with Mike Maples Jr., September 17, 2014. 15.The notion that middlemen accelerate connections might be called the catalyst view of middlemen.

Matchmakers: The New Economics of Multisided Platforms
by
David S. Evans
and
Richard Schmalensee
Published 23 May 2016
Malcom Gladwell, “The Terrazzo Jungle,” New Yorker, March 15, 2004, http://www.newyorker.com/magazine/2004/03/15/the-terrazzo-jungle; M. Jeffery Hardwick, Mall Maker (Philadelphia: University of Pennsylvania Press, 2010). 5. Market makers are sometimes known as liquidity providers, and buyers and sellers are sometimes known as liquidity takers. See Larry Harris, Trading & Exchanges: Market Microstructure for Practitioners (Oxford, UK: Oxford University Press, 2002). 6. In the United States, regulation drove the shift to decimalization (tick sizes of one cent). See US Securities and Exchange Commission, “Report to Congress on Decimalization,” July 2012, 4–6, https://www.sec.gov/news/studies/2012/decimalization-072012.pdf. 7.

Networks, Crowds, and Markets: Reasoning About a Highly Connected World
by
David Easley
and
Jon Kleinberg
Published 15 Nov 2010
Journal, 2(2):143–146, 1953. [204] Garrett Hardin. The tragedy of the commons. Science, 162(3859):1243–1248, 1968. [205] Larry Harris. Trading and Exchanges: Market Microstructure for Practitioners. Oxford University Press, 2002. [206] John C. Harsanyi. Game with incomplete information played by “Bayesian” players, I–III. Part I: The basic model. Management Science, 14(3):159–182, November 1967. [207] Joel Hasbrouck. Empirical Market Microstructure: The Institutions, Economics, and Econometrics of Securities Trading. Oxford University Press, 2007. [208] Kjetil K. Haugen. The performance-enhancing drug game.
…
The discovery of pluralistic ignorance: An ironic lesson. Journal of the History of the Behavioral Sciences, 22:333–347, 1986. [325] Hubert J. O’Gorman and Stephen L. Garry. Pluralistic ignorance — A replication and extension. Public Opinion Quarterly, 40:449–458, 1976. [326] Maureen O’Hara. Market Microstructure Theory. Wiley, 1998. [327] Steve Olson. Mapping Human History: Genes, Race, and our Common Origins. Houghton Mifflin, 2002. [328] J.-P. Onnela, J. Saramaki, J. Hyvonen, G. Szabo, D. Lazer, K. Kaski, J. Kertesz, and A.-L. Barabasi. Structure and tie strengths in mobile communication networks.

Python for Finance
by
Yuxing Yan
Published 24 Apr 2014
Yan has actively done research with several publications in Journal of Accounting and Finance, Journal of Banking and Finance, Journal of Empirical Finance, Real Estate Review, Pacific Basin Finance Journal, Applied Financial Economics, and Annals of Operations Research. For example, his latest publication, co-authored with Shaojun Zhang, will appear in the Journal of Banking and Finance in 2014. His research areas include investment, market microstructure, and open source finance. He is proficient at several computer languages such as SAS, R, MATLAB, C, and Python. From 2003 to 2010, he worked as a technical director at Wharton Research Data Services (WRDS), where he debugged several hundred computer programs related to research for WRDS users.
Learn Algorithmic Trading
by
Sebastien Donadio
Published 7 Nov 2019
For the scope of this book, we provide some intuition behind this matching algorithm and provide a hypothetical matching scenario. The underlying intuition between pro-rata matching is that it favors larger orders over smaller orders at the same price and ignores the time at which the orders were entered. This changes the market's microstructure quite a bit, and the participants are favored to enter larger orders to gain priority instead of entering orders as fast as possible: BIDS ASKS Order A: Buy 100 @ 10.00 Order X: Sell 100 @ 11.00 Order B: Buy 200 @ 10.00 Order Y: Sell 200 @ 11.00 Order C: Buy 700 @ 10.00 Order Z: Sell 200 @ 12.00 Order D: Buy 100 @ 9.00 Consider a market state as shown earlier.
Python for Algorithmic Trading: From Idea to Cloud Deployment
by
Yves Hilpisch
Published 8 Dec 2020
This chapter introduces vectorization both with NumPy and pandas and applies it to backtest three types of trading strategies: strategies based on simple moving averages, momentum, and mean reversion. The chapter admittedly makes a number of simplifying assumptions, and a rigorous backtesting of trading strategies needs to take into account more factors that determine trading success in practice, such as data issues, selection issues, avoidance of overfitting, or market microstructure elements. However, the major goal of the chapter is to focus on the concept of vectorization and what it can do in algorithmic trading from a technological and implementation point of view. With regard to all concrete examples and results presented, the problems of data snooping, overfitting, and statistical significance need to be considered.

Reinventing the Bazaar: A Natural History of Markets
by
John McMillan
Published 1 Jan 2002
“A Multistage Model of Bargaining.” Review of Economic Studies 50, 411–426. Sobel, Robert. 1970. The Curbstone Brokers: The Origins of the American Stock Exchange. New York, Macmillan. Spence, A Michael. 1973. “Job Market Signaling.” Quarterly Journal of Economics 87, 355–374. Spulber, Daniel F. 1996. “Market Microstructure and Intermediation.” Journal of Economic Perspectives 10, 135–152. Squires, Dale, Kirkley, James, and Tisdell, Clement A. 1995. “Individual Transferable Quotas as a Fisheries Management Tool.” Reviews in Fisheries Science 3, 141–169. Steinbeck, John. 1996. Sweet Thursday. New York, Penguin.

The New Science of Asset Allocation: Risk Management in a Multi-Asset World
by
Thomas Schneeweis
,
Garry B. Crowder
and
Hossein Kazemi
Published 8 Mar 2010
“Market Timing Ability and Volatility Implied in Investment Newsletters’ Asset Allocation Recommendations.” Journal of Financial Economics 42, Issue 3 (November 1996): 397–421. Bibliography 281 Grubel, Herbert. “Internationally Diversified Portfolio: Welfare Gains and Capital Flows.” The American Economic Review Vol. 58, No. 5 (December 1968): 1299–1314. Harris, L. Trading and Exchanges: Market Microstructure for Practitioners. New York: Oxford University Press, 2003. Hill, J.M., V. Balasubramanian, K. Gregory, and I. Tierens. “Finding Alpha via Covered Index Writing.” Financial Analysts Journal 62, No. 5 (Sept./Oct. 2006): 29–46. Hryshko, D., M.J. Luengo-Prado, and B.E. Sorensen. “Childhood Determinants of Risk Aversion.” www.ssrn.com, 2009.
The Misbehavior of Markets: A Fractal View of Financial Turbulence
by
Benoit Mandelbrot
and
Richard L. Hudson
Published 7 Mar 2006
Zoom in on the fast episodes, and they are seen to have sub-clusters of fast and slow sub-intervals—clusters within clusters within clusters. It is a classic multifractal pattern. Its scaling stretches, through every focal length of our mathematical zoom lens, from about two hours to 180 days—an unusually long zone of regularity. At shorter time-intervals, a new pattern emerges: What economists call market “microstructure” starts to kick in. Here, the average price change is up or down by just 0.14 pfennig, only twice the spread of 0.7 pfennig between bid and ask. With such narrow profit opportunities, some traders do not bother changing their quotes instantly, so you would expect the data to look differently.

Dark Pools: The Rise of the Machine Traders and the Rigging of the U.S. Stock Market
by
Scott Patterson
Published 11 Jun 2012
The year before, the onetime Island CEO had left his high-paying job at Citadel to launch his own computer-trading outfit in Chicago, Headlands Technologies. Andresen told his audience that top-shelf traders today need to know much more than quant strategies—they also need to have a deep understanding of market microstructure. They need to know the plumbing. Another speaker was Andrei Kirilenko, who’d conducted in-depth research into the Flash Crash for the Commodity Futures Trading Commission. Kirilenko had discovered that high-speed gunners typically traded in the direction of the price movement of a stock for the first five seconds of a move, then flipped and traded in the opposite direction after ten seconds.

The Missing Billionaires: A Guide to Better Financial Decisions
by
Victor Haghani
and
James White
Published 27 Aug 2023
Hardest to estimate are the returns of investments or strategies whose performance is driven by market inefficiencies, whether they arise from frictions and segmentations or from investor foibles. Our estimates for these investments will necessarily rely heavily on historical performance, which is a cause for concern. Estimating the return distributions for these investments will rely on the challenging task of forecasting changes in market microstructures, investor behavior, and the amount of risk‐capital that will be attracted to these opportunities, each of which can change rapidly and unpredictably. To help cut through all this complexity, we find ourselves always coming back to these three related hypotheses: The efficient markets hypothesis: The markets, especially large and liquid ones, are fairly efficient.

Red-Blooded Risk: The Secret History of Wall Street
by
Aaron Brown
and
Eric Kim
Published 10 Oct 2011
Large, diversified portfolios have also been blamed for investors not providing oversight to their investments, and for feeding bubbles and crashes. The MPT focus on returns measured periodically, mainly monthly, may have led to underappreciation for both long-term economics and short-term market microstructure. Hedge funds are much better than index funds at determining fundamental value, at providing oversight, for operating at a variety of time scales from microseconds to decades, for reining in bubbles, and at rushing in to repair after crashes. Of course, just because hedge funds can do these things it doesn’t follow that all, or even most, hedge funds actually do these things.

The Invisible Hands: Top Hedge Fund Traders on Bubbles, Crashes, and Real Money
by
Steven Drobny
Published 18 Mar 2010
Commodity markets now tend to gap more quickly, showing evidence of what I call “single point volatility.” And there is some evidence of a greater prevalence of serial correlation in pricing, so trends are established much more quickly. This doesn’t necessarily mean commodities are riskier, but it is a change in the market microstructure that you have to stay on top of. As a result of spot shortages and outages, is it easier to be long commodities than short? Although none of this could be described as “easy,” each manager may have a different comfort zone, which is a function of how trades are structured, what the asymmetry is, the risk versus reward, etc.

Money Free and Unfree
by
George A. Selgin
Published 14 Jun 2017
Quarterly Journal of Economics 7 (1): 55–77. ——— (1904) Economic Essays. New York: Macmillan. ——— (1922) The Theory and History of Banking, 4th ed. New York: G. P. Putnam’s Sons. Dunne, G. T. (1964) “A Christmas Present for the President.” Federal Reserve Bank of St. Louis. Dunne, P. G.; Fleming, M.; and Zholos, A. (2009) “Repo Market Microstructure in Unusual Monetary Policy Conditions.” Working Paper (December 16). Dwyer, G. P. Jr. (1996) “Wildcat Banking, Banking Panics, and Free Banking in the United States.” Federal Reserve Bank of Atlanta Economic Review 81 (1): 1–20. Dwyer, G. P. Jr., and Gilbert, A. R. (1989) “Bank Runs and Private Remedies.”

Derivatives Markets
by
David Goldenberg
Published 2 Mar 2016
Some of the highlights of the text are: 1. an emphasis on the quote mechanism, and understanding where to find and how to read and interpret the data that underlies this field; 2. an early presentation of the hedging role of forward contracts in Chapter 2, with the use of Microsoft Excel charts as visual aids; 3. an early emphasis on FX markets to develop a global perspective, as opposed to the usual stock market focus; 4. separating out forward contract valuation in the no-dividend case from the dividend case, as exemplified in Chapters 3 and 4; 5. recognizing the alternative derivative valuation problems: at initiation, at expiration, and at an intermediate time; 6. an emphasis on market microstructure in Chapter 5 on futures markets, with due attention to the limit order book and Globex; 7. a portfolio approach to hedging with futures contracts in Chapter 6, with a discussion of most of the approaches to hedging, including carrying charge hedging; 8. discussion of difficult to explain, yet important concepts such as storage, the price of storage, and the all-important spreads notion; 9. an extensive Chapter 7 on financial futures contracts, with particular emphasis on Eurodollar spot and futures, since these are the basis for understanding swaps in Chapter 8; 10. a complete discussion of stock index futures in Chapter 8, and their uses in alternative hedging strategies.
Debunking Economics - Revised, Expanded and Integrated Edition: The Naked Emperor Dethroned?
by
Steve Keen
Published 21 Sep 2011
Baba (2000) ‘The application of cellular automata and agent models to network externalities in consumers’ theory: a generalization of life game,’ in W. A. Barnett, C. Chiarella, S. Keen, R. Marks and H. Schnabl (eds), Commerce, Complexity and Evolution, New York: Cambridge University Press. O’Hara, M. (1995) Market Microstructure Theory, Cambridge: Blackwell. Ormerod, P. (1997) The Death of Economics, 2nd edn, New York: John Wiley & Sons. Ormerod, P. (2001) Butterfly Economics: A New General Theory of Social and Economic Behavior, London: Basic Books. Ormerod, P. (2004) ‘Neoclassical economic theory: a special and not a general case,’ in E.
Expected Returns: An Investor's Guide to Harvesting Market Rewards
by
Antti Ilmanen
Published 4 Apr 2011
Takeaways from the vast literature on equity momentum • As noted above, past performance dependence across equities includes a multi-month momentum pattern as well as short-term and long-term reversal patterns. On paper, the strongest result is that past month winners tend to strongly underperform past month losers over the subsequent month. This first-month reversal effect is sometimes attributed to market microstructure effects such as bid–ask bounce, or to price overreaction to firm-specific news, but the most compelling explanation is price concession caused by large trades. Liquidity providers facing low trading costs can exploit this pattern. Return reversals are even stronger over shorter horizons (day and week), for less liquid stocks, when using industry-adjusted returns, and amidst high volatility