Data Action: Using Data for Public Good
by
Sarah Williams
Published 14 Sep 2020
Social media data and tools like Humanitarian Tracker have been used for monitoring everything from smoking cessation patterns to infectious disease. This method is often referred to as “nowcasting,” a term used to describe the ability to predict a range of phenomena happening in the present, near future, or recent past such as the spread of diseases, economic analyses or forecasting,55 and weather.56 Aside from its typical use of social media data, nowcasting can also draw from the data exhaust, such as search history or logs of purchases on Amazon, generated by interacting with digital technologies. The use of data exhaust has become commonplace in public health research because of its potential for predicting seasonal epidemics such as influenza, which could have impacts on the public.57 In 2009, for instance, Google announced it used its vast database of search terms to predict with very high accuracy the number of cases of the flu as well as their locations, claiming that these statistics were comparable to CDC reports for the same period.58 The data analytics model, called Google Flu Trends (GFT), worked by comparing the pattern of the search term with the known CDC reported physician visits for influenza-like illness (ILI) for the five-year period from 2003 to 2008, and Google made sure to remove seasonally related terms such as high-school basketball.59 The research was heralded as the next revolution in public health research using big data.60 But even though Google's initial results proved successful, the algorithms began to fail over time because the model relied too heavily on seasonal search terms and search terms associated with illnesses such as bronchitis and pneumonia.
…
Kass-Hout and Hend Alhinnawi, “Social Media in Public Health,” British Medical Bulletin 108, no. 1 (2013): 5–24. 54 “Humanitarian Tracker,” Humanitarian Tracker, October 15, 2018, https://www.humanitariantracker.org. 55 Domenico Giannone, Lucrezia Reichlin, and David Small, “Nowcasting: The Real-Time Informational Content of Macroeconomic Data,” Journal of Monetary Economics 55, no. 4 (May 2008): 665–676, https://doi.org/10.1016/j.jmoneco.2008.05.010. 56 Marta Banbura et al., “Now-Casting and the Real-Time Data Flow,” Handbook of Economic Forecasting 2, no. Part A (2013): 195–237. 57 Ali Alessa and Miad Faezipour, “A Review of Influenza Detection and Prediction through Social Networking Sites,” Theoretical Biology & Medical Modelling 15 (February 1, 2018), https://doi.org/10.1186/s12976-017-0074-5. 58 Jeremy Ginsberg et al., “Detecting Influenza Epidemics Using Search Engine Query Data,” Nature 457, no. 7232 (February 2009): 1012–1014, https://doi.org/10.1038/nature07634. 59 Ginsberg et al., “Detecting Influenza Epidemics.” 60 Miguel Helft, “Google Uses Web Searches to Track Flu's Spread,” New York Times, November 11, 2008, https://www.nytimes.com/2008/11/12/technology/internet/12flu.html; “The Next Chapter for Flu Trends,” Google AI Blog (blog), October 15, 2018, http://ai.googleblog.com/2015/08/the-next-chapter-for-flu-trends.html. 61 Samantha Cook et al., “Assessing Google Flu Trends Performance in the United States during the 2009 Influenza Virus A (H1N1) Pandemic,” PLOS ONE 6, no. 8 (August 19, 2011): e23610, https://doi.org/10.1371/journal.pone.0023610. 62 Donald R.
…
This emerging field is often framed as digital humanitarianism.67 Applications and analyses have been deployed to understand natural disasters such as wildfires, floods, earthquakes,68 and even terrorist attacks,69 since social media can provide real-time information from those on the ground and responding—and allowing people to know where to respond. The work is similar to the “nowcasting” described earlier in the chapter, as it helps identify the problems associated with a disaster. But rather than being predictive, disaster response tells us what is actually happening on the ground based on messages interpreted by those affected. Jakob Rogstadius, who studies and develops disaster systems for IBM, categorizes disaster response systems that use social media in three ways: First, those that address disaster management directly, sending information through social media about rescue or evacuation efforts.
The COVID-19 Catastrophe: What's Gone Wrong and How to Stop It Happening Again
by
Richard Horton
Published 31 May 2020
Jasper Fuk-Woo Chan et al., A familial cluster of pneumonia associated with the 2019 novel coronavirus indicating person-to-person transmission, The Lancet, 24 January 2020. 2. Chaolin Huang et al., Clinical features of patients infected with 2019 novel coronavirus in Wuhan, China, The Lancet, 24 January 2020. 3. Joseph T. Wu et al., Nowcasting and forecasting the potential domestic and international spread of the 2019-nCoV outbreak originating in Wuhan, China, The Lancet, 31 January 2020. 4. Adam Kucharski, The Rules of Contagion: Why Things Spread – and Why They Stop (London: Profile Books, 2020). 5. Adam J. Kucharski et al., Early dynamics of transmission and control of COVID-19, Lancet Infectious Diseases, 11 March 2020. 6.
…
Jasper Fuk-Woo Chan et al., A familial cluster of pneumonia associated with the 2019 novel coronavirus indicating person-to-person transmission, The Lancet, 24 January 2020. 3. Roujian Lu et al., Genomic characterisation and epidemiology of 2019 novel coronavirus: implications for virus origins and receptor binding, The Lancet, 29 January 2020. 4. Joseph T. Wu et al., Nowcasting and forecasting the potential domestic and international spread of the 2019-nCoV outbreak originating in Wuhan, China, The Lancet, 31 January 2020. 5. Huijun Chen et al., Clinical characteristics and intrauterine vertical transmission potential of COVID-19 infection in nine pregnant women, The Lancet, 12 February 2020. 6.
These Strange New Minds: How AI Learned to Talk and What It Means
by
Christopher Summerfield
Published 11 Mar 2025
Most weather patterns – from gentle summer sun to roiling tropical storms – drift and morph across the weather chart in mostly foreseeable ways, so forecasts can extrapolate from the current weather conditions to accurately predict minutes or hours into the future (called nowcasting). However, each day’s weather is subject to random fluctuations that cannot be modelled. Thus, as the time horizon for prediction lengthens, these small errors all add up, and the weather bulletins start to miss the mark. Predictions about language suffer from a similar issue. Guessing the next word in a sentence is not too hard, as illustrated by the predictive text suggestions in a messaging app or email client. But guessing the very next word is the linguistic equivalent of nowcasting. What we really want is for models to generate continuations that stretch for several words, sentences, or even paragraphs.
…
This is the meteorological equivalent of the input prompt – the pattern of data whose continuation we wish to predict. Thus it might learn that high winds on the Cornish coast tend to travel up the Irish Sea and batter Merseyside. (In practice, the Met Office does not use RNNs, because the weather tends to obey models of fluid dynamics quite well, but neural networks have been successfully deployed for nowcasting.)[*2] However, when it comes to modelling sequences of data, there is a problem. Information about the past is not all equally useful when predicting the future. Britain’s mercurial weather is shaped for much of the year by the vicissitudes of the Gulf Stream, which flows in from the west, so we might want to upweight Atlantic over North Sea observations, at least when providing the Liverpudlian forecast.
…
T. and Hill, F. (2022), ‘Meaning Without Reference in Large Language Models’. Available at https://doi.org/10.48550/arXiv.2208.02957. Press, O. et al. (2023), ‘Measuring and Narrowing the Compositionality Gap in Language Models’. arXiv. Available at http://arxiv.org/abs/2210.03350 (accessed 13 December 2023). Ravuri, S. et al. (2021), ‘Skilful Precipitation Nowcasting Using Deep Generative Models of Radar’, Nature, 597(7878), pp. 672–7. Available at https://doi.org/10.1038/s41586-021-03854-z. Runciman, D. (2019), How Democracy Ends. London: Profile. Russell, S. (2019), Human Compatible: AI and the Problem of Control. New York: Viking. Russell, S. and Norvig, P. (2020), Artificial Intelligence: A Modern Approach, 4th edn.
The Singularity Is Nearer: When We Merge with AI
by
Ray Kurzweil
Published 25 Jun 2024
BACK TO NOTE REFERENCE 30 Nancy Fliesler, “Using Multiple Data Streams and Artificial Intelligence to ‘Nowcast’ Local Flu Outbreaks,” Vector, Boston Children’s Hospital, January 14, 2019, https://web.archive.org/web/20210121214157/https://vector.childrenshospital.org/2019/01/local-flu-prediction-argonet. BACK TO NOTE REFERENCE 31 Fliesler, “Using Multiple Data Streams and Artificial Intelligence to ‘Nowcast’ Local Flu Outbreaks.” BACK TO NOTE REFERENCE 32 Fliesler, “Using Multiple Data Streams and Artificial Intelligence to ‘Nowcast’ Local Flu Outbreaks.” BACK TO NOTE REFERENCE 33 Fliesler, “Using Multiple Data Streams and Artificial Intelligence to ‘Nowcast’ Local Flu Outbreaks”; Fred S.
…
BACK TO NOTE REFERENCE 33 Fliesler, “Using Multiple Data Streams and Artificial Intelligence to ‘Nowcast’ Local Flu Outbreaks”; Fred S. Lu et al., “Improved State-Level Influenza Nowcasting in the United States Leveraging Internet-Based Data and Network Approaches,” Nature Communications 10, article 147 (January 11, 2019), https://doi.org/10.1038/s41467-018-08082-0. BACK TO NOTE REFERENCE 34 For more detail on CheXNet and its successor, CheXpert, see “CheXNet and Beyond,” Matthew Lungren, YouTube video, November 10, 2018, https://www.youtube.com/watch?v=JqYte9UMJCg; Pranav Rajpurkar et al., “CheXNet: Radiologist-Level Pneumonia Detection on Chest X-Rays with Deep Learning,” Stanford Machine Learning Group working paper, November 14, 2017, https://arxiv.org/pdf/1711.05225v1.pdf; Jeremy Irvin et al., “CheXpert: A Large Chest Radiograph Dataset with Uncertainty Labels and Expert Comparison,” Proceedings of the AAAI Conference on Artificial Intelligence 33, no. 1 (July 17, 2019): AAAI-10, IAAI-19, EAAI-20, https://www.aaai.org/ojs/index.php/AAAI/article/view/3834.
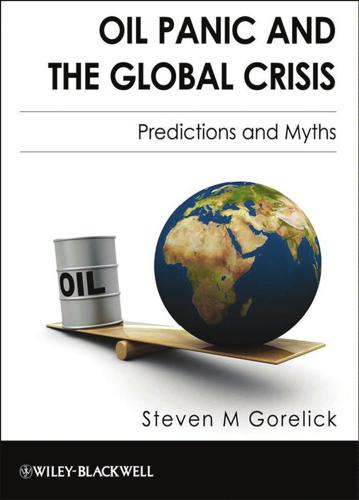
Oil Panic and the Global Crisis: Predictions and Myths
by
Steven M. Gorelick
Published 9 Dec 2009
With this retrospective fit, Hubbert’s approach is easily able to match much of the historical production data, including the peak. Yet even with the advantage of post-peak hindsight, the “nowcast” does not match actual production data for the past 10 years and substantially underestimates production, as displayed in Figure 4.4 (for 2008, applying Hubbert’s method gives a predicted value of 0.92 billion barrels per year versus the actual 1.55 billion barrels per year). This figure presents an enlargement of the nowcast prediction for the years 1994 through 2008, showing the descending limb of 92 Counter-Arguments to Imminent Global Oil Depletion the predicted curve versus actual production data.
Calling Bullshit: The Art of Scepticism in a Data-Driven World
by
Jevin D. West
and
Carl T. Bergstrom
Published 3 Aug 2020
When you have Google-scale data, argued Wired editor Chris Anderson, “the numbers speak for themselves.” The scientific method was no longer necessary, he argued; the huge volumes of data would tell us everything we need to know. Data scientists didn’t need years of epidemiological training or clinicians to diagnose flu symptoms. They just need enough data to “nowcast”*12 the flu and inform the CDC where to deliver Tamiflu. Or so we were told. In all the excitement, we forget that if it sounds too good to be true, it probably is. And it was. By 2014, the headlines had turned from celebratory to monitory: “Google and the Flu: How Big Data Will Help Us Make Gigantic Mistakes,” “Why Google Flu Is a Failure,” “What We Can Learn from the Epic Failure of Google Flu Trends.”
…
*11 For example, the new General Data Protection Regulation (GDPR) in the European Union includes a “right to explanation” in Recital 71. This companion document will be influential going forward, but it is the most debated of all subjects in the GDPR, partly because of the difficulty in defining what is meant by “explain.” *12 “Nowcasting” is a flashy word made up to describe the practice of “predicting” aspects of the present or recent past using computer models, before anyone has time to measure them directly. *13 The study included Web queries between 2003 and 2008. The suggest (autocomplete) functionality became broadly available on Google’s website in 2008.
Covid by Numbers
by
David Spiegelhalter
and
Anthony Masters
Published 28 Oct 2021
areaType=nation&areaName=England 10. https://www.ons.gov.uk/peoplepopulationandcommunity/healthandsocialcare/conditionsanddiseases/articles/coronaviruscovid19infectionsurveyantibodydatafortheuk/28april2021 11. https://blog.ons.gov.uk/2021/04/28/antibodies-and-immunity-how-do-they-relate-to-one-another/ 12. https://www.bmj.com/content/370/bmj.m3563 13. https://www.mrc-bsu.cam.ac.uk/now-casting/nowcasting-and-forecasting-27th-may-2021/ CHAPTER 8: HOW ILL DO PEOPLE GET WITH COVID-19? 1. https://www.ons.gov.uk/peoplepopulationandcommunity/healthandsocialcare/conditionsanddiseases/articles/coronaviruscovid19infectionsinthecommunityinengland/characteristicsofpeopletestingpositiveforcovid19incountriesoftheuk5may2021 2. https://evidence.nihr.ac.uk/themedreview/living-with-covid19-second-review/ 3. https://www.bbc.co.uk/sounds/play/m000mzms 4. https://www.medrxiv.org/content/10.1101/2021.03.03.21252086v1 5. https://www.ons.gov.uk/peoplepopulationandcommunity/healthandsocialcare/conditionsanddiseases/bulletins/prevalenceofongoingsymptomsfollowingcoronaviruscovid19infectionintheuk/1april2021 6. https://www.nice.org.uk/guidance/ng188/evidence CHAPTER 9: WHAT HAPPENED IN HOSPITALS?
Data and the City
by
Rob Kitchin,Tracey P. Lauriault,Gavin McArdle
Published 2 Aug 2017
This is an important requirement for cities and citizens. With the rise of citizen data scientist and the corporate use of urban data, sharing data about cities using various bindings is advantageous. The architecture also can efficiently communicate with big data technologies. Current city dashboards are useful tool for now-casting. With big data technologies and data science, cities need to have other systems for sharing data using polyglot bindings and providing indicators and metrics about city for future (forecasting) using predictive analytics. References Amirian, P., Alesheikh, A. and Bassiri, A. (2010a) ‘Standards-based, interoperable services for accessing urban services data for the city of Tehran’, Computers, Environment and Urban Systems 34(4): 309–321.

Virtual Competition
by
Ariel Ezrachi
and
Maurice E. Stucke
Published 30 Nov 2016
According to the study, “differential pricing based on demographics (whereby Netflix would adjust prices based on a customer’s race, age, income, geographic location, and family size) could increase profit by 0.8 percent, while using 5,000 Web browsing variables (such as the amount of time a user typically spends online or whether she has recently visited Wikipedia or IMDB) could increase profits by as much as 12.2 percent.” Ibid., citing Benjamin Shiller, “First-Degree Price Discrimination Using Big Data” (2014), http://benjaminshiller.com /images/First_Degree_PD_Using _Big _Data_Apr_8,_2014.pdf. For a discussion of the “nowcasting radar,” see Stucke and Grunes, Big Data and Competition Policy. Yoko Kubota, “Toyota Aims to Make Self-Driving Cars by 2020,” Wall Street Journal, October 6, 2015, http://www.wsj.com/articles/toyota-aims-to-make -self-driving-cars-by-2020 -1444136396; Yoko Kubota, “Behind Toyota’s Late Shift into Self-Driving Cars,” Wall Street Journal, January 12, 2016, 338 25. 26. 27. 28. 29. 30. 31. 32.
Investing Amid Low Expected Returns: Making the Most When Markets Offer the Least
by
Antti Ilmanen
Published 24 Feb 2022
When it comes to forecasting multi-month or multiyear returns (not high-frequency returns), machine learning still faces limitations of small data. Worse, the signal-to-noise ratio is inevitably low in financial markets when competition ensures that predicting returns cannot be too easy. Combined with some innovative alternative data sources, machine learning may help predict the next macroeconomic or firm-specific announcements (“nowcasting”) which would give some edge in short-term trading, but this would do nothing to help us collectively in the low expected return challenge. Machine learning may improve stock selection and market timing strategies, but should be aided by theoretical models to limit overfitting. It has more potential to add value in the less sexy areas of portfolio implementation, such as risk management and trading cost control, where we have more data and where relatively efficient markets are not as constraining.15 Notes 1 The second equality uses the trick of multiplying and dividing the capital gain part by Dt+1/Dt, and rearranging.
The Technology Trap: Capital, Labor, and Power in the Age of Automation
by
Carl Benedikt Frey
Published 17 Jun 2019
Today, futurologists are just as ill equipped to predict the jobs that AI will create. Official employment statistics are always behind the curve when it comes to capturing new occupations, which are not included in the data until they have reached a critical mass in terms of the number of people in them. But other sources, like LinkedIn data, allow us at least to nowcast some emerging jobs. Among them are the jobs of machine learning engineers, big data architects, data scientists, digital marketing specialists, and Android developers.14 But we also find jobs like Zumba instructors and Beachbody coaches.15 In a world that is becoming increasingly technologically sophisticated, rising returns on skills are unlikely to disappear and likely to intensify.

Alpha Trader
by
Brent Donnelly
Published 11 May 2021
As of December 2020, it is the least attractive it has ever been, with yields close to zero. And they upgraded it. Note that yield moves opposite to the price of the bond so the ratings agency downgraded the bond at the lows and upgraded it at the highs. My point is not to troll the ratings agencies, and I know technically they are not forecasting, they are just nowcasting. The point is just that when an asset is in trouble, everyone hates it. When an asset is ripping, everybody loves it. Now let’s do oil (see Figure 7.5). Again, note how the price moves first and the forecast follows and has no predictive value. Extrapolation bias does not just impact economists and forecasters, it impacts traders (big time).