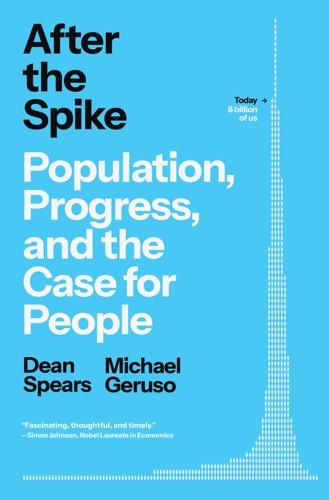
After the Spike: Population, Progress, and the Case for People
by Dean Spears and Michael Geruso · 7 Jul 2025 · 264pp · 96,174 words
up government budgets or the labor force. Maybe so. Or maybe our societies can solve these problems without stabilizing the population. Yes, the U.S. old-age dependency ratio (the number of people sixty-five and over relative to the number of people twenty-five to sixty-four) will double over the next seventy
…
–91, 225 ethics of, 159–80 externalities and addressing the problem, 197–200 families in two futures, number of children and depopulation, 16, 16–17 old-age dependency ratio concern, 135, 198 population growth as a zero-sum game, 137–38 rate of population decay, 3, 23–28, 38, 42, 44 religious traditions and
…
by month, 17 childcare costs and birth rates, 222–23 decline in childhood deaths, 35 education for women, 15 government spending on family benefits, 217 old-age dependency ratio, 135 progress for women, 78–80 relationship between air pollution and population density, 54, 55 United States Bureau of Labor Statistics on gender inequality in
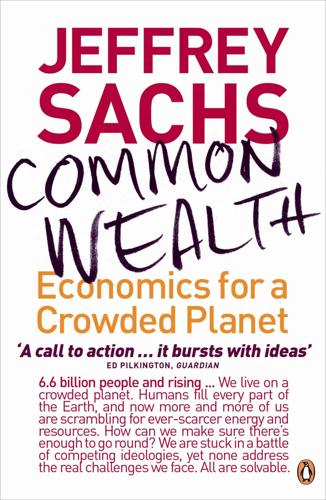
Common Wealth: Economics for a Crowded Planet
by Jeffrey Sachs · 1 Jan 2008 · 421pp · 125,417 words
them. There is some truth to the message. The ratio of those older than sixty-five to those aged fifteen to sixty-five, called the old-age dependency ratio, will indeed take a big surge in the high-income world, as shown in Figure 8.9. The ratio basically doubles from around 23 percent
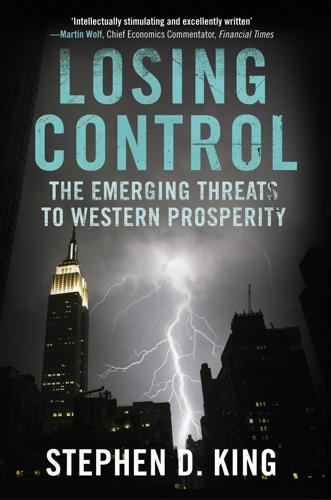
Losing Control: The Emerging Threats to Western Prosperity
by Stephen D. King · 14 Jun 2010 · 561pp · 87,892 words
on ‘pay-as-you-go’ pensions and healthcare provision are supposedly more vulnerable, as they rely on current taxpayers to fund the elderly. If the old-age dependency ratio is rapidly rising, the burden on current taxpayers – especially people of working age – threatens to become too painful. Higher tax rates might leave them disinclined
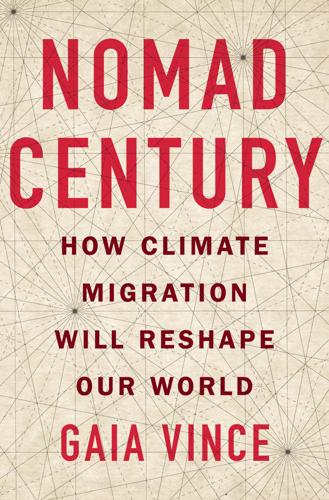
Nomad Century: How Climate Migration Will Reshape Our World
by Gaia Vince · 22 Aug 2022 · 302pp · 92,206 words
see their populations halve by 2100. North America and Europe have 300 million people above the traditional retirement age (65+), and by 2050 the economic old-age dependency ratio there is projected to be at forty-three elderly persons per 100 working persons aged 20–64.1 Cities from Munich to Buffalo will begin
Exceptional People: How Migration Shaped Our World and Will Define Our Future
by Ian Goldin, Geoffrey Cameron and Meera Balarajan · 20 Dec 2010 · 482pp · 117,962 words
.S. wages) Table 7.2. Largest cities in the world by 2025, population estimates (millions) Table 7.3. Total immigration necessary to maintain constant 2000 old-age dependency ratios into 2050 Acknowledgments This book has been written during our time at the James Martin 21st Century School at the University of Oxford. The School
…
the century, and East Asia is expected to experience a similar transition before 2050. China is forecasted to see a 250 percent increase in its old-age dependency ratios between 2005 and 2050.92 Population aging and falling fertility in rapidly growing countries like China could lay the foundation for a global competition for
…
scarce labor. TABLE 7.3 TOTAL IMMIGRATION NECESSARY TO MAINTAIN CONSTANT 2000 OLD-AGE DEPENDENCY RATIOS INTO 2050. Source: United Nations. 2000. Replacement Migration: Is It a Solution to Declining and Aging Populations? New York: United Nations. Absolute changes in labor
Grave New World: The End of Globalization, the Return of History
by Stephen D. King · 22 May 2017 · 354pp · 92,470 words
, a mere 0.4 per cent of the global total. Italy’s story goes beyond mere shrinkage: its population is also ageing. Whereas Nigeria’s old-age dependency ratio will remain very low for much of the twenty-first century (thanks to a rapidly swelling population of working age), Italy’s will be heading
The Age of Stagnation: Why Perpetual Growth Is Unattainable and the Global Economy Is in Peril
by Satyajit Das · 9 Feb 2016 · 327pp · 90,542 words
above sixty-five years of age, a doubling of this age group from current levels. The ratio of old people to those of working age (old-age dependency ratio) will grow. By 2035, there will be one person aged over sixty-five for every 3.85 workers aged 25–64, down from 6.25
Fully Grown: Why a Stagnant Economy Is a Sign of Success
by Dietrich Vollrath · 6 Jan 2020 · 295pp · 90,821 words
boom is visible around 1960, as the number of kids exploded to equal almost 80% of the working-age population. At the same time, the old-age dependency ratio, which is the number of people 65 and older as a percentage of the working-age population, was less than 20%. From 1960 to almost
…
so did the youth dependency ratio. It is now around 45%, almost half its peak in 1960. And for much of that same period, the old-age dependency ratio also stayed constant at around 20%. This means that the ratio of workers to total population rose throughout the twentieth century and into the twenty
…
-first. But as the figure shows, we then entered a period of profound change as the baby boom generation entered retirement. By 2030 the old-age dependency ratio will approach 40%, whereas the youth dependency ratio is not projected to fall much at all. This means that the proportion of workers to total
…
population, which had already begun to drop because of the rise in the old-age dependency ratio in the early 2000s, will continue to fall. Figure 5.3. Dependency ratios over time Note: Data is from the Organisation for Economic Co-operation
Numbers Don't Lie: 71 Stories to Help Us Understand the Modern World
by Vaclav Smil · 4 May 2021 · 252pp · 60,959 words
by a stream of reports about overwhelmed National Health Service employees and overburdened hospitals), and its aging population will require more resources. The country’s old-age dependency ratio (number of people 65 and older as a share of all economically active people 20–64 years of age), standing at 32 percent in 2020
…
, 297 ivory trade, 277–8 Japanese occupation, 93 manufacturing, 67, 83, 84 megacities, 44–5, 47, 48 milk adulteration case, 262 nuclear industry, 134, 146 old-age dependency ratio, 73, 76, 80 population, 73, 74, 76, 77 quality of life, 75 relations with Japan, 71 sex ratio, 77–9 trains, 218 transformers, 105, 107
…
happiness, 40, 42, 66 human height, 20 infant mortality rate, 59 life expectancy, 25, 66, 255 megacities, 46, 48 nuclear energy, 133–4, 143, 146 old-age dependency ratio, 68 postwar living standards, 248 trains, 217 transmitter development, 54–5 unemployment, 66 wheat yields, 227–8 wine industry and consumption, 247–50, 248 freedom
…
, 40, 58 infant mortality, 58, 59 life expectancy, 58 manufacturing, 67, 83, 84, 85 Nazi empire, 90, 92–3 nuclear energy, 134, 146 obesity, 58 old-age dependency ratio, 68 trains, 217 unemployment, 83 Gibbs, John Dixon, 106 Giza, 31–4, 31 GlobalFoundries, 80 Goodyear, Charles, 189 Goodyear Tire and Rubber Company, 191 Google
…
by, xii historical use, 174 modern uses, 176–7 OPEC oil crisis (1973–74), 70 US supply, 75 and wind turbines, 149 oil tankers, 70 old-age dependency ratio China, 73, 76, 80 Japan, 71 UK, 68 USA, 73 olive oil, 235, 236, 237 Organization of Petroleum Exporting Countries (OPEC), 70 Osaka, 47 Oslo
…
fuels used, 174 infant mortality rate, 9, 58 life expectancy, 24, 25, 58, 66, 255 manufacturing sector, 67 nuclear energy, 133–4, 143 obesity, 58 old-age dependency ratio, 68 quality of life, 37 unemployment, 37, 66 wheat yields, 227 Ukraine, 7, 145, 212 ultraviolet radiation, 99 unemployment, 35–8, 35, 66, 82–4
…
manufacturing, 67, 84, 85 megacities, 46, 48–9 nuclear energy and accidents, 133–4, 143, 145 obesity, 58, 232–3, 256, 273 oil supply, 75 old-age dependency ratio, 73 pattern of rise and fall, 71–2 relations with Russia, 86–9 USA – cont’d. and Second World War, 69–70 trains, 218 unemployment
When the Money Runs Out: The End of Western Affluence
by Stephen D. King · 17 Jun 2013 · 324pp · 90,253 words
, it had a population of 82 million. The United Nations projects that, by 2075, Germany's population will have dwindled to 70 million. Meanwhile, its old age dependency ratio – the ratio of those above standard retirement age to those of working age – is rising rapidly: according to the UN, it's set to jump
…
financially stress-free retirement – and younger generations – who, increasingly, are expected to pick up the bill. The debate on ageing is, by now, familiar territory. Old age dependency ratios – the ratio of the elderly relative to those of working age – are set to increase throughout the world, but nowhere more so than in the

Heart of the Machine: Our Future in a World of Artificial Emotional Intelligence
by Richard Yonck · 7 Mar 2017 · 360pp · 100,991 words
The State and the Stork: The Population Debate and Policy Making in US History
by Derek S. Hoff · 30 May 2012

Red Flags: Why Xi's China Is in Jeopardy
by George Magnus · 10 Sep 2018 · 371pp · 98,534 words
Grand Transitions: How the Modern World Was Made
by Vaclav Smil · 2 Mar 2021 · 1,324pp · 159,290 words
The End of Indexing: Six Structural Mega-Trends That Threaten Passive Investing
by Niels Jensen · 25 Mar 2018 · 205pp · 55,435 words
The Dawn of Innovation: The First American Industrial Revolution
by Charles R. Morris · 1 Jan 2012 · 456pp · 123,534 words
Growth: From Microorganisms to Megacities
by Vaclav Smil · 23 Sep 2019

The Precariat: The New Dangerous Class
by Guy Standing · 27 Feb 2011 · 209pp · 89,619 words
The Great Demographic Reversal: Ageing Societies, Waning Inequality, and an Inflation Revival
by Charles Goodhart and Manoj Pradhan · 8 Aug 2020 · 438pp · 84,256 words
No Ordinary Disruption: The Four Global Forces Breaking All the Trends
by Richard Dobbs and James Manyika · 12 May 2015 · 389pp · 87,758 words
The 100-Year Life: Living and Working in an Age of Longevity
by Lynda Gratton and Andrew Scott · 1 Jun 2016 · 344pp · 94,332 words
The Fourth Revolution: The Global Race to Reinvent the State
by John Micklethwait and Adrian Wooldridge · 14 May 2014 · 372pp · 92,477 words

This Chair Rocks: A Manifiesto Against Ageism
by Ashton Applewhite · 10 Feb 2016 · 312pp · 84,421 words