purchasing power parity
description: economic theory that states that the exchange rate between two countries is equal to the ratio of the currencies' respective purchasing power
231 results
How Africa Works: Success and Failure on the World’s Last Developmental Frontier
by Joe Studwell · 6 Dec 2025 · 393pp · 148,223 words
based on revised data about price levels. The most recent adjustment, in June 2025, increased the IPL to US$3 per day (based on 2021 purchasing power parity). The aim is to have the poverty threshold reflect the same purchasing power over time. Both the recent poverty lines are used in the text
…
class’ by 2010. In the AfDB definition, middle class meant only that people had an income of more than US$2 a day in 2005 purchasing power parity (PPP) terms. However, the US$2 income threshold was the entry point for the discretionary purchases that fuel a consumer market. In a survey of
…
, Botswana Poverty Assessment, March 2015 (Washington, D. C.: World Bank, 2015). The World Bank poverty line was then US$1.90 per day using 2011 purchasing power parity. Based on the latest census data for 2010, Botswana’s Gini coefficient is 0.6. 64 Tony Benn, Out of the Wilderness: Diaries 1963–67
…
and Economic Development, ‘An Economic Development Plan for Ethiopia’ (September 1993), p. 1. 4 World Bank US$1.90 a day threshold measured in 2011 purchasing power parity (PPP) dollars. 5 Author interview with Marco Quinones, the first Sasakawa Global 2000 employee, head of the Ethiopian programme and long-time collaborator of Meles
…
. As of 2025, extreme poverty is classified by the World Bank as equivalent to an income of less than US$3 a day in 2021 purchasing power parity dollars. The UK consultancy Oxford Policy Management (OPM) concluded that poverty in Rwanda increased at least 6 per cent between 2010–11 and 2013–14
…
US$200, that of Rwanda was US$1,000. The 2023 World Bank poverty rate quoted was less than US$3 per day in 2021 Purchasing Power Parity dollars. 12 ‘Illicit Financial Flows: Report of the High-level Panel on Illicit Financial Flows from Africa’, African Union/Economic Commission for Africa (2015), available

Principles of Corporate Finance
by Richard A. Brealey, Stewart C. Myers and Franklin Allen · 15 Feb 2014
bought more cheaply in the United States will be exported, and that will force down the price of the foreign products. This is often called purchasing power parity.7 Just as the price of goods in Walmart stores must be roughly the same as the price of goods in Target, so the price
…
of goods in Ruritania when converted into dollars must be roughly the same as the price in the United States: Purchasing power parity implies that any differences in the rates of inflation will be offset by a change in the exchange rate. For example, if prices are rising
…
11.1% in Ruritania, the number of pesos that you can buy for $1 must rise by 1.111/1.01 – 1, or 10%. Therefore purchasing power parity says that to estimate changes in the spot rate of exchange, you need to estimate differences in inflation rates:8 In our example, Interest Rates
…
1985 reflects the total failure of the forward rate to anticipate the 34% rise in the value of sterling. 3. Purchasing Power Parity Theory What about the third side of our quadrilateral—purchasing power parity theory? No one who has compared prices in foreign stores with prices at home really believes that prices are the same
…
the relationship is far from exact, large differences in inflation rates are generally accompanied by an offsetting change in the exchange rate.13 Strictly speaking, purchasing power parity theory implies that the differential inflation rate is always identical to the change in the spot rate. But we don’t need to go as
…
practice forward rates seem to incorporate a risk premium, but this premium is about equally likely to be negative as positive. In its strict form, purchasing power parity states that $1 must have the same purchasing power in every country. That doesn’t square well with the facts, for differences in inflation rates
…
–742. Interest rate parity K. Clinton, “Transaction Costs and Covered Interest Arbitrage: Theory and Evidence,” Journal of Political Economy 96 (April 1988), pp. 358–370. Purchasing power parity K. Froot and K. Rogoff, “Perspectives on PPP and Long-run Real Exchange Rates,” in G. Grossman and K. Rogoff (eds.), Handbook of International Economics
…
(Amsterdam: North-Holland Publishing Company, 1995). K. Rogoff, “The Purchasing Power Parity Puzzle,” Review of Economic Literature 34 (June 1996), pp. 667–668. A. M. Taylor and M. P. Taylor, “The Purchasing Power Parity Debate,” Journal of Economic Perspectives 18 (Autumn 2004), pp. 135–158. ● ● ● ● ● PROBLEM SETS Select problems
…
interest rate on yen? f. According to the expectations theory, what is the expected spot rate for yen in three months’ time? g. According to purchasing power parity theory, what then is the expected difference in the three-month rate of price inflation in the United States and Japan? 2. Terminology Define each
…
in a sentence or simple equation: a. Interest rate parity. b. Expectations theory of forward rates. c. Purchasing power parity. d. International capital market equilibrium (relationship of real and nominal interest rates in different countries). 3. Purchasing power parity In March 1997 the exchange rate for the Indonesian rupiah was R2,419 = $1. Inflation in the
…
year to March 1998 was about 30% in Indonesia and 2% in the United States. a. If purchasing power parity held, what should have been the nominal exchange rate in March 1998? b. The actual exchange rate in March 1998 (in the middle of the
…
that we described in Chapter 26. 6See Chapter 26 for a further discussion of the difference between forward and futures contracts. 7Economists use the term purchasing power parity to refer to the notion that the level of prices of goods in general must be the same in the two countries. They tend to
…
the price of a single good. 8In other words, the expected difference in inflation rates equals the expected change in the exchange rate. Strictly interpreted, purchasing power parity also implies that the actual difference in the inflation rates always equals the actual change in the exchange rate. 9In Section 3-5 we discussed
…
States. The inflation-adjusted, or real, exchange rate is unchanged at 15To put it another way, the hedge ratio is 1.0. 16Of course, if purchasing power parity always held, the fall in the value of the krona would be matched by higher inflation in Sweden. The risk for Outland is that the
…
offers, 385–387 international security issues, 386 market reaction to stock issues, 387–389 rights issues, 389–390 Purchase method of merger accounting, 821–822 Purchasing power parity, 698, 698n, 700–703, 705n Pure plays, 226 Puri, M., 374n Put-call parity, 520n, 520–521 Put options in reducing risk, 664 relationship between
Money Free and Unfree
by George A. Selgin · 14 Jun 2017 · 454pp · 134,482 words
preservation of international monetary equilibrium. In the context of an international specie standard—let us say gold—the condition for such an equilibrium, that of “purchasing power parity,” implies that a given sum of gold bullion should purchase approximately the same bundle of tradable goods in all gold-standard countries: “approximately” because prices
…
the country where prices are higher, with gold flows serving to finance the increased trade deficit. This Humean price-specie-flow mechanism will eventually restore purchasing power parity by promoting, on the one hand, monetary contraction in the country where goods are more expensive and, on the other, monetary expansion where goods have
…
, provoking a general strike, and giving rise to what were euphemistically termed balance-of-payments “difficulties.” The obvious alternatives for bringing the pound back into purchasing-power parity with the (undiminished) U.S. dollar were further deflation (and corresponding depression) or devaluation. British authorities, however, opted for “none of the above.” Drawing inspiration
The Tyranny of Nostalgia: Half a Century of British Economic Decline
by Russell Jones · 15 Jan 2023 · 463pp · 140,499 words
Soviet Union in 1991 brought much of eastern Europe into the world economy, but the most crucial new entrant at this time was China. In purchasing power parity terms, China’s shares of global exports and GDP doubled from 1.0% and 2.0%, respectively, in 1980 to 2% and 4% in 1990
Our Dollar, Your Problem: An Insider’s View of Seven Turbulent Decades of Global Finance, and the Road Ahead
by Kenneth Rogoff · 27 Feb 2025 · 330pp · 127,791 words
Tables (PPP rates). A line graph illustrates the global GDP shares from 1950 to 2025, comparing data based on market exchange rates (solid line) and purchasing power parity (PPP) exchange rates (dashed line). The vertical axis represents the global GDP share in percent, ranging from 16 percent to 48 percent in increments of
…
. All values are approximate. Figure 2 also shows a second way to measure the size of the U.S. economy. That method uses artificially constructed purchasing power parity (PPP) exchange rates, which attempt to use a common set of prices to better compare living standards. The United States’ decline is sharper by the
…
barely more than a generation, per capita GDP rose from just over 20 percent to over 80 percent of U.S. levels, as measured using purchasing power parity weights.12 If one instead uses market exchange rates (perhaps less meaningful for asking about the welfare of the average consumer), Japan’s per capita
…
United States—certainly, world stock market and real estate investors thought so—it clearly is not anymore. Today, per capita GDP in Japan, measured at purchasing power parity exchange rates, is only 63 percent of U.S. per capita GDP,35 a quantum fall from the over 80 percent level it once reached
…
.S. per capita GDP, depending on what measure one uses. The progress has since stalled or worse, except for Germany. As figure 7 illustrates using purchasing power parity exchange rates, Germany’s per capita GDP today is just over 80 percent of the United States’, Italy’s is below 70 percent, and France
…
of the nineteenth century, although China started from a lower base. China’s per capita income relative to that of the United States (calculated using purchasing power parity exchange rates) rose almost fivefold, from 5 percent of U.S. per capita income in 1980 to 22 percent in 2019, as illustrated in figure
…
8.6 And that is during a period when U.S. per capita GDP itself doubled. If one uses purchasing power parity weights, then, on the basis of overall GDP, China has already overtaken the United States as the world’s largest economy. But if one uses
…
looks a bit less otherworldly using the latest version of the Penn World Tables, which attempt to measure growth using international prices (that is, at purchasing power parity exchange rates). The Penn World Tables data suggest 7.1 percent growth from 1980 to 2012 and 3.5 percent growth from 2013 to 2019
…
three trends from 1950 to 2025: the U.S. share of global GDP at market exchange rates, the U.S. share of global GDP at purchasing power parity (PPP) exchange rates, and foreign holdings of U.S. debt as a percentage of GDP. The vertical axis represents percentages, ranging from 0 to 48
…
sensitive at any point in time to the value of the dollar. Other countries’ incomes are converted to dollars at market exchange rates and at purchasing power parity exchange rates. The reader should note the same databases, the Total Economy Database and the Penn World Tables, are referred to later in this book
…
exceptions, and it most typically shows up strongly only in exceptionally fast-growing economies; 1950s–1980s Japan is the canonical example. See Kenneth Rogoff, “The Purchasing Power Parity Puzzle,” Journal of Economic Literature 34, no. 2 (June 1996): 647–668. 13. Kevin Honglin Zhang and Shunfeng Song, “Rural–Urban Migration and Urbanization in
…
Models of the Seventies: Do They Fit Out of Sample?,” Journal of International Economics 14, nos. 1–2 (February 1983): 3–24. Another was the purchasing power parity puzzle. Empirically, after a shock to the real exchange rate (the nominal exchange rate adjusted for price differentials), it takes on average three years for
…
half the shock to dissipate, whether through nominal exchange rate or relative price adjustment. See Kenneth Rogoff, “The Purchasing Power Parity Puzzle,” Journal of Economic Literature 34, no. 2 (June 1996): 647–668. Oleg’s work with Dimitri Mukhin suggested that a significant share of the
…
, 61, 119, 330 n.20 Powell, Jay (Chair, Federal Reserve Board), 247, 248 Prahalad, C. K., 27 Prescott, Edward, 225 “Rules Rather than Discretion,” 251 purchasing power parity (PPP), 7, 38, 50, 67, 307 n.1 Putin, Vladimir (President, Russian Federation), 22, 24, 118 Queen’s Gambit, The, 58, 260 Rachel, Lukasz: “Secular
Capital in the Twenty-First Century
by Thomas Piketty · 10 Mar 2014 · 935pp · 267,358 words
money in Europe, his or her purchasing power would be closer to an American income of $1,200. Thus we say that $1.20 has “purchasing power parity” with 1 euro. I used this parity rather than the exchange rate to convert American GDP to euros in Table 1.1, and I did
…
/dollar In 2012, 1 euro was worth $1.30 according to current exchange rate, but $1.20 in purchasing power parity. Sources and series: see piketty.pse.ens.fr/capital21c. The other advantage of using purchasing power parities is that they are more stable than exchange rates. Indeed, exchange rates reflect not only the supply and
…
$0.90 in 2001 before rising to around $1.50 in 2008 and then falling back to $1.30 in 2012. During that time, the purchasing power parity of the euro rose gently from roughly $1 per euro in the early 1990s to roughly $1.20 in 2010 (see Figure 1.4).26
…
Despite the best efforts of the international organizations involved in the ICP, there is no escaping the fact that these purchasing power parity estimates are rather uncertain, with margins of error on the order of 10 percent if not higher, even between countries at comparable levels of development
…
with a single index leading to an unambiguous classification, especially between countries with fairly similar average incomes. In the poorer countries, the corrections introduced by purchasing power parity are even larger: in Africa and Asia, prices are roughly half what they are in the rich countries, so that GDP roughly doubles when
…
purchasing power parity is used for comparisons rather than the market exchange rate. This is chiefly a result of the fact that the prices of goods and services
…
2.5 in India.29 At this moment, the euro is worth 8 Chinese yuan on the foreign exchange market but only 5 yuan in purchasing power parity. The gap is shrinking as China develops and revalues the yuan (see Figure 1.5). Some writers, including Angus Maddison, argue that the gap is
…
example, the share of the rich countries (European Union, United States, Canada, and Japan) in global income was 46 percent in 2012 if we use purchasing power parity but 57 percent if we use current exchange rates.31 The “truth” probably lies somewhere between these two figures and is probably closer to the
…
in which rich and poor countries are converging in income. FIGURE 1.5. Exchange rate and purchasing power parity: euro/yuan In 2012, 1 euro was worth 8 yuan according to current exchange rate, but 5 yuan in purchasing power parity. Sources and series: see piketty.pse.ens.fr/capital21c. The Global Distribution of Income Is
…
highly distorted international comparisons. 28. This is the usual expectation (in the so-called Balassa-Samuelson model), which seems to explain fairly well why the purchasing-power parity adjustment is greater than 1 for poor countries vis-à-vis rich countries. Within rich countries, however, things are not so clear: the richest country
…
in the world (the United States) had a purchasing-power parity correction greater than 1 until 1970, but it was less than 1 in the 1980s. Apart from measurement error, one possible explanation would be the
…
technical appendix for a detailed analysis of these questions. 12. Global Inequality of Wealth in the Twenty-First Century 1. Recall that global GDP, using purchasing power parity, was roughly $85 trillion (70 million euros) in 2012–2013, and according to my estimates total private wealth (real estate, business, and financial assets, net
…
. The GDP of the European Union was close to 15 trillion euros in 2012–2013, compared with 10 trillion euros for China’s GDP at purchasing power parity (or 6 trillion at current exchange rates, which may be better for comparing international financial assets). See Chapter 1. China’s net foreign assets are
…
of world population, 1700–2012 Figure 1.3. Global inequality 1700–2012: divergence then convergence? Figure 1.4. Exchange rate and purchasing power parity: euro/dollar Figure 1.5. Exchange rate and purchasing power parity: euro/yuan Figure 2.1. The growth of world population, 1700–2012 Figure 2.2. The growth rate of world population
…
, 142, 153, 541–544; financial and nonfinancial, 124; historical perspective on, 126–129; assets and, 135–139, 143, 541–542; desirable level of, 562–565 Purchasing power: parity in, 64–67, 586nn26,27,28; increase in, 86–90; inheritance and, 415–416 Qatar, 537 Qian, Nancy, 17, 634n50, 646n43 Quesnay, François, 603n26 Rajan
Efficiently Inefficient: How Smart Money Invests and Market Prices Are Determined
by Lasse Heje Pedersen · 12 Apr 2015 · 504pp · 139,137 words
the basis of the currency carry trade, as discussed further below. To get an idea of the long-run return of a currency, note that purchasing power parity (PPP) holds approximately in the long run. That is, while the real price of a car is not exactly the same in different countries, the
…
low price-to-book ratios while shorting equity indices with high ones. • Currency value trade: For currencies, one measure of value can be derived using purchasing power parity (PPP). PPP says that goods should cost the same in all countries. Hence, if a burger (or a diversified basket of goods) costs more in
…
–48, 50. See also rebalancing of portfolio portfolio sort, as predictive regression, 51–53 position limits, 55, 60 post–earnings-announcement drift, 41 PPP. See purchasing power parity (PPP) predatory trading, 83–84 predictive regression, 50–53 preferred habitat theory, 249 present value model. See dividend discount model price. See market price price
…
horizon for observing, 33t, 34–35 profit sources, from trading strategies, 39–46, 40f proportional transaction costs, 65 “pump and dump” schemes, 107–8, 123 purchasing power parity (PPP), 182–83; trading based on, 197, 197n put-call parity, 236, 236n2 put options, 235–36; demand pressure for, 46, 240; implied volatilities of
Valuation: Measuring and Managing the Value of Companies
by Tim Koller, McKinsey, Company Inc., Marc Goedhart, David Wessels, Barbara Schwimmer and Franziska Manoury · 16 Aug 2015 · 892pp · 91,000 words
estimate the cost of capital for cross-border investments. Global CAPM The disagreement between investors about the return and risk of international investments disappears if purchasing power parity (PPP) holds across all currencies. In that case, changes in exchange rates perfectly match differences in inflation between currencies:2 ( Xt = Xt−1 where 1
…
will be the same for all investors, regardless of their domestic currency. In this 2 Technically, this is so-called relative purchasing power parity, referring to changes in prices and exchange rates. Absolute purchasing power parity requires that prices be the same across currencies (see, for example, Brealey et al., Principles of Corporate Finance, chap. 27
…
adjust for differences in inflation between countries, although not immediately and perfectly. 3 For an overview, see A. M. Taylor and M. P. Taylor, “The Purchasing Power Parity Debate,” Journal of Economic Perspectives 18, no. 4 (Fall 2004): 135–158. ESTIMATING THE COST OF CAPITAL 497 For investors and companies able to invest
…
-free rate in currency A f ,t A rM,t = realized return for global market portfolio in currency A If the international Fisher relation and purchasing power parity would hold, differences in international interest rates would reflect differences in inflation across countries; and differences in inflation across countries would also be reflected in
…
capital for investments in foreign currency and otherwise identical investments in domestic currency. First of all, price fluctuations tend to mitigate currency fluctuations because of purchasing power parity. Second, currency risk is largely diversifiable for companies and shareholders. Any remaining risk from currency rate changes is best reflected in the cash flow projections
…
most of those years, the value of those assets would have been within 20 percent of the original investment measured in U.S. dollars, as purchasing power parity kept the currency rate in line with inflation differences over the long term. Nevertheless, there would be significant deviations in other years. For example, at
…
versus an index of foreign currencies with more dampened deviations from PPP, at least for the past 20 years (see Exhibit 23.5). Analysis of purchasing power parity indicates that in general, currencies INCORPORATING FOREIGN-CURRENCY RISK IN THE VALUATION 505 Brazilian Inflation-Adjusted Exchange Rates EXHIBIT 23.5 Real exchange rate (RER
…
Settlements. indeed revert to parity levels following changes in relative rates of inflation, but not immediately.14 Short-term deviations from exchange rates that give purchasing power parity potentially leave corporations exposed to real-terms currency risk. However, shareholders are typically able to diversify this risk. To see how, consider Exhibit 23.6
…
adjust the cost of capital, but instead prepare cash flow projections for one or more currency scenarios as follows. 14 See Taylor and Taylor, “The Purchasing Power Parity Debate.” 506 CROSS-BORDER VALUATION EXHIBIT 23.6 Diversification of Real Currency Risk 10-year monthly real exchange rate1 volatility, % Individual currencies Argentina 28.4
…
the company. Exchange rates are one parameter that deserves special attention. Although exchange rates converge to purchasing power parity (PPP) in the long run,3 3 For an overview, see A. M. Taylor and M. P. Taylor, “The Purchasing Power Parity Debate,” Journal of Economic Perspectives 18, no. 4 (Fall 2004): 135–158. 708 EMERGING MARKETS
…
cost of capital that includes a country risk premium, and another valuation based on multiples. REVIEW QUESTIONS 729 REVIEW QUESTIONS 1. Define purchasing power parity. What is the importance of purchasing power parity when you are trying to establish value for a company located in an emerging market? 2. Identify four risks associated with emerging markets
Portfolios of the poor: how the world's poor live on $2 a day
by Daryl Collins, Jonathan Morduch and Stuart Rutherford · 15 Jan 2009 · 296pp · 87,299 words
Story behind the Portfolios 185 Appendix 2 A Selection of Portfolios Acknowledgments Notes 243 247 Bibliography 265 Index vi 273 211 Tables Table 1.1 Purchasing Power Parity Comparisons Table 1.2 Hamid and Khadeja’s Closing Balance Sheet, November 2000 Table 2.1 Year-End Financial Asset Values and Annual Cash Flows
…
, takas, or rand do not always adequately capture that fact. So adjustments are made by the UN using a set of conversion factors known as “purchasing power parity” (PPP) exchange rates. The PPP-adjusted dollars attempt to account for the greater purchasing power in the countries we study than market rates would imply
…
-adjusted dollars would differ from the market rate dollars used in the book, table 1.1 provides two sets of conversion factors. Table 1.1 Purchasing Power Parity Comparisons Comparison year Sample (and study year) 1993 2005 Bangladesh (1999–2000) India (2000–2001) South Africa (2004–5) 2.67 3.69 1.96
…
dollar figures are converted at official exchange rates, which may give too low a sense of the effective value of the assets. When converted using “purchasing power” parity (PPP) rates, the median asset values rise to $293 for Bangladesh, $637 for India, and $1,128 for South Africa. The financial assets of the
…
: the Grameen Bank (see Grameen Bank); moneylenders, 273 INDEX Bangladesh (cont.) 142–43; opportunities, investment in, 107–9; “pro-poor” private life insurers, 73–75; purchasing power parity exchange rates, conversion factors for, 6; the sample drawn from, 14, 189, 191–92, 198–99, 262n.10; saving and savings clubs, 49, 118; usefully
…
, 71; microcredit: example of difficulties with, 276 INDEX 126–28; microfinance, 24; micro health insurance schemes, 92; moneylenders, 142–43; opportunities, investment in, 107–9; purchasing power parity exchange rates, conversion factors for, 6; the sample drawn from, 14, 189, 192– 93, 199–201; savings clubs, 118–19, 121–22; seasonal variations of
…
(see also prices); savings as common feature of, 46–47 (see also savings); of transactions and relationships, 49–52. See also financial diaries PPP. See purchasing power parity exchange rates Prahalad, C. K., 62, 251n.12, 256n.2 prices: the complex derivation of, 134–36; context of, diversification of poor households’ portfolios and
…
vs. actual, term of the loan and, 137–41; unreliability of informal service providers regarding, 152–53 Proctor and Gamble, 62 pro-poor insurers, 207 purchasing power parity (PPP) exchange rates, conversion factors and use of, 5–7, 248n.6 Qubeka, Nomthumzi, 261n.6 Rabin, Matthew, 255n.13 Ramuse, Zanele, 261n.6 RAND
…
in, 24; moneylenders, 141; money-sharing arrangements, examples of, 51–52; Mzansi accounts, 24; opportunities, investment in, 107–9; Post Office bank accounts, 253n.18; purchasing power parity exchange rates, conversion factors for, 6; regular vs. irregular incomes, 44–45; the sample drawn from, 14–15, 189, 193–95, 201–3, 249n.14
Triumph of the Optimists: 101 Years of Global Investment Returns
by Elroy Dimson, Paul Marsh and Mike Staunton · 3 Feb 2002 · 353pp · 148,895 words
-currency returns 74 91 7.1 Long-run exchange rate behavior 91 7.2 The international monetary system 93 7.3 Long-run purchasing power parity 95 7.4 Deviations from purchasing power parity 96 7.5 Volatility of exchange rates 98 7.6 Common-currency returns on bonds and equities 100 7.7 Summary 103
…
course of the 101 years from 1900–2000. Chapter 1 Introduction and overview 7 Chapter 7 also examines the extent to which purchasing power parity has held over the long run. Purchasing power parity implies that goods and services will have a similar price experience in different countries, but this is a poor description of year
…
.2 by a review of the evolution of the international monetary system. In section 7.3 we turn to evidence on long-run purchasing power parity, and discuss deviations from purchasing power parity in section 7.4. In section 7.5 we examine the volatility of real exchange rates. We then present real, common-currency returns
…
on equities and bonds in section 7.6. We then summarize our discussion of exchange rates, purchasing power parity, and common-currency returns in section 7.7. 7.1 Long-run exchange rate behavior Figure 7-1 compares the exchange rates against the US
…
floating rate system, make it appropriate to look in more detail at the evolution of exchange rates over the last century. 7.3 Long-run purchasing power parity Figure 7-3 plots the exchange rate between US dollars and British pounds. The vertical axis shows the number of dollars required to purchase £1
…
has been roughly constant. There has been much debate about the extent to which exchange rates reflect inflation rates. An extreme viewpoint would be that purchasing power parity (PPP) holds absolutely. That is, exchange-adjusted prices for goods and services are identical all over the world, and a unit of local currency should
…
1930 1940 1950 1960 Start of year 1970 1980 1990 2000 96 Triumph of the Optimists: 101 Years of Global Investment Returns Figure 7-4: Purchasing power parity over the period 1900–2000 10 Annualized change in exchange rate relative to US dollar (%) 5 0 -5 1900–19 1920–39 1940–59 1960
…
measured are 1900–19, 1920–39, 1940–59, 1960–79 and 1980–2000, so the scatter diagram contains seventy-five observations. 7.4 Deviations from purchasing power parity Although most tests of relative PPP support its validity over the long term, departures from parity often last for quite a number of years. Such
…
half-century as well. Only the Swiss franc and the Dutch guilder proved stronger than the dollar, and the guilder by only a slight margin. Purchasing power parity (PPP), which asserts that goods and services will have a similar price experience in different countries, is a poor description of year-to-year foreign
…
reduce the cost of capital, and it may well be misunderstood in the market. Finally, we reflect on the evidence presented in chapter 7 on purchasing power parity. In the long run, exchange rates can be expected to adjust to reflect relative inflation rates. In integrated global markets, foreign exchange exposure therefore contributes
…
, Brace and World Switzer, L., 2000, An equally weighted index of Montreal stock prices 1900–1914. Unpublished note Taylor, A.M., 2001, A century of purchasing power parity. Review of Economics and Statistics, forthcoming Thomas, W.A., 1986, The Stock Exchanges of Ireland. NH: Francis Cairns Publications Timmermann, A., 1992, Udviklingen i de
…
, 222 Portfolio risk, 108 338 Portugal, 20 Prescott, E., 180, 202 Primary market, 18–9 Privatization, 25, 26 Productivity, 43, 48, 97, 189, 223, 224 Purchasing Power Parity (PPP), 7, 91, 95–104, 219 Railroads, 19, 20, 24, 25, 26, 28, 37, 168 Rajan, R.G., 22 Ramaswamy, K., 140 Random walk, 153
Expected Returns: An Investor's Guide to Harvesting Market Rewards
by Antti Ilmanen · 4 Apr 2011 · 1,088pp · 228,743 words
Investing Amid Low Expected Returns: Making the Most When Markets Offer the Least
by Antti Ilmanen · 24 Feb 2022
Money: 5,000 Years of Debt and Power
by Michel Aglietta · 23 Oct 2018 · 665pp · 146,542 words
Hubris: Why Economists Failed to Predict the Crisis and How to Avoid the Next One
by Meghnad Desai · 15 Feb 2015 · 270pp · 73,485 words

EuroTragedy: A Drama in Nine Acts
by Ashoka Mody · 7 May 2018
GDP: A Brief but Affectionate History
by Diane Coyle · 23 Feb 2014 · 159pp · 45,073 words

High-Frequency Trading: A Practical Guide to Algorithmic Strategies and Trading Systems
by Irene Aldridge · 1 Dec 2009 · 354pp · 26,550 words
The Rise of Carry: The Dangerous Consequences of Volatility Suppression and the New Financial Order of Decaying Growth and Recurring Crisis
by Tim Lee, Jamie Lee and Kevin Coldiron · 13 Dec 2019 · 241pp · 81,805 words
Falling Behind: Explaining the Development Gap Between Latin America and the United States
by Francis Fukuyama · 1 Jan 2006
The Age of Turbulence: Adventures in a New World (Hardback) - Common
by Alan Greenspan · 14 Jun 2007
Culture and Prosperity: The Truth About Markets - Why Some Nations Are Rich but Most Remain Poor
by John Kay · 24 May 2004 · 436pp · 76 words
The Quest: Energy, Security, and the Remaking of the Modern World
by Daniel Yergin · 14 May 2011 · 1,373pp · 300,577 words
The Shifts and the Shocks: What We've Learned--And Have Still to Learn--From the Financial Crisis
by Martin Wolf · 24 Nov 2015 · 524pp · 143,993 words
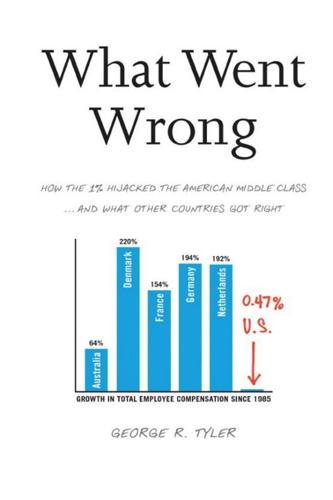
What Went Wrong: How the 1% Hijacked the American Middle Class . . . And What Other Countries Got Right
by George R. Tyler · 15 Jul 2013 · 772pp · 203,182 words
Understanding Asset Allocation: An Intuitive Approach to Maximizing Your Portfolio
by Victor A. Canto · 2 Jan 2005 · 337pp · 89,075 words
Lords of Finance: The Bankers Who Broke the World
by Liaquat Ahamed · 22 Jan 2009 · 708pp · 196,859 words

The Haves and the Have-Nots: A Brief and Idiosyncratic History of Global Inequality
by Branko Milanovic · 15 Dec 2010 · 251pp · 69,245 words

Birth of the Euro
by Otmar Issing · 20 Oct 2008 · 276pp · 82,603 words

The Globalization of Inequality
by François Bourguignon · 1 Aug 2012 · 221pp · 55,901 words
India's Long Road
by Vijay Joshi · 21 Feb 2017
The Curse of Cash
by Kenneth S Rogoff · 29 Aug 2016 · 361pp · 97,787 words
The City
by Tony Norfield · 352pp · 98,561 words
Paper Promises
by Philip Coggan · 1 Dec 2011 · 376pp · 109,092 words
Naked Economics: Undressing the Dismal Science (Fully Revised and Updated)
by Charles Wheelan · 18 Apr 2010 · 386pp · 122,595 words
The Global Auction: The Broken Promises of Education, Jobs, and Incomes
by Phillip Brown, Hugh Lauder and David Ashton · 3 Nov 2010 · 209pp · 80,086 words
The Wealth and Poverty of Nations: Why Some Are So Rich and Some So Poor
by David S. Landes · 14 Sep 1999 · 1,060pp · 265,296 words
Social Democratic America
by Lane Kenworthy · 3 Jan 2014 · 283pp · 73,093 words

Grand Transitions: How the Modern World Was Made
by Vaclav Smil · 2 Mar 2021 · 1,324pp · 159,290 words

Portfolio Design: A Modern Approach to Asset Allocation
by R. Marston · 29 Mar 2011 · 363pp · 28,546 words
The Great Escape: Health, Wealth, and the Origins of Inequality
by Angus Deaton · 15 Mar 2013 · 374pp · 114,660 words
Losing Control: The Emerging Threats to Western Prosperity
by Stephen D. King · 14 Jun 2010 · 561pp · 87,892 words
The Scandal of Money
by George Gilder · 23 Feb 2016 · 209pp · 53,236 words
Capitalism, Alone: The Future of the System That Rules the World
by Branko Milanovic · 23 Sep 2019
What's Next?: Unconventional Wisdom on the Future of the World Economy
by David Hale and Lyric Hughes Hale · 23 May 2011 · 397pp · 112,034 words
The Great Reversal: How America Gave Up on Free Markets
by Thomas Philippon · 29 Oct 2019 · 401pp · 109,892 words
The Ages of Globalization
by Jeffrey D. Sachs · 2 Jun 2020
Destined for War: America, China, and Thucydides's Trap
by Graham Allison · 29 May 2017 · 518pp · 128,324 words
After the New Economy: The Binge . . . And the Hangover That Won't Go Away
by Doug Henwood · 9 May 2005 · 306pp · 78,893 words
Growth: From Microorganisms to Megacities
by Vaclav Smil · 23 Sep 2019
The Economics of Enough: How to Run the Economy as if the Future Matters
by Diane Coyle · 21 Feb 2011 · 523pp · 111,615 words
Bourgeois Dignity: Why Economics Can't Explain the Modern World
by Deirdre N. McCloskey · 15 Nov 2011 · 1,205pp · 308,891 words
The End of Alchemy: Money, Banking and the Future of the Global Economy
by Mervyn King · 3 Mar 2016 · 464pp · 139,088 words
The Future Is Asian
by Parag Khanna · 5 Feb 2019 · 496pp · 131,938 words
Poor Economics: A Radical Rethinking of the Way to Fight Global Poverty
by Abhijit Banerjee and Esther Duflo · 25 Apr 2011 · 370pp · 112,602 words
Global Inequality: A New Approach for the Age of Globalization
by Branko Milanovic · 10 Apr 2016 · 312pp · 91,835 words
The Butterfly Defect: How Globalization Creates Systemic Risks, and What to Do About It
by Ian Goldin and Mike Mariathasan · 15 Mar 2014 · 414pp · 101,285 words

Enlightenment Now: The Case for Reason, Science, Humanism, and Progress
by Steven Pinker · 13 Feb 2018 · 1,034pp · 241,773 words
Guide to business modelling
by John Tennent, Graham Friend and Economist Group · 15 Dec 2005 · 287pp · 44,739 words
The fortune at the bottom of the pyramid
by C. K. Prahalad · 15 Jan 2005 · 423pp · 149,033 words
Empty Planet: The Shock of Global Population Decline
by Darrell Bricker and John Ibbitson · 5 Feb 2019 · 280pp · 83,299 words
Inside the House of Money: Top Hedge Fund Traders on Profiting in a Global Market
by Steven Drobny · 31 Mar 2006 · 385pp · 128,358 words
How the City Really Works: The Definitive Guide to Money and Investing in London's Square Mile
by Alexander Davidson · 1 Apr 2008 · 368pp · 32,950 words
The Money Machine: How the City Works
by Philip Coggan · 1 Jul 2009 · 253pp · 79,214 words
From Peoples into Nations
by John Connelly · 11 Nov 2019
Green Economics: An Introduction to Theory, Policy and Practice
by Molly Scott Cato · 16 Dec 2008
Left Behind
by Paul Collier · 6 Aug 2024 · 299pp · 92,766 words
Stocks for the Long Run, 4th Edition: The Definitive Guide to Financial Market Returns & Long Term Investment Strategies
by Jeremy J. Siegel · 18 Dec 2007

Super Continent: The Logic of Eurasian Integration
by Kent E. Calder · 28 Apr 2019
Getting Better: Why Global Development Is Succeeding--And How We Can Improve the World Even More
by Charles Kenny · 31 Jan 2011 · 272pp · 71,487 words
More: The 10,000-Year Rise of the World Economy
by Philip Coggan · 6 Feb 2020 · 524pp · 155,947 words
The Euro: How a Common Currency Threatens the Future of Europe
by Joseph E. Stiglitz and Alex Hyde-White · 24 Oct 2016 · 515pp · 142,354 words
Stakeholder Capitalism: A Global Economy That Works for Progress, People and Planet
by Klaus Schwab · 7 Jan 2021 · 460pp · 107,454 words
Common Wealth: Economics for a Crowded Planet
by Jeffrey Sachs · 1 Jan 2008 · 421pp · 125,417 words
People, Power, and Profits: Progressive Capitalism for an Age of Discontent
by Joseph E. Stiglitz · 22 Apr 2019 · 462pp · 129,022 words
Shutdown: How COVID Shook the World's Economy
by Adam Tooze · 15 Nov 2021 · 561pp · 138,158 words

Escape From Rome: The Failure of Empire and the Road to Prosperity
by Walter Scheidel · 14 Oct 2019 · 1,014pp · 237,531 words

Free World: America, Europe, and the Surprising Future of the West
by Timothy Garton Ash · 30 Jun 2004 · 329pp · 102,469 words

Four Battlegrounds
by Paul Scharre · 18 Jan 2023
The Third Industrial Revolution: How Lateral Power Is Transforming Energy, the Economy, and the World
by Jeremy Rifkin · 27 Sep 2011 · 443pp · 112,800 words

The Dawn of Innovation: The First American Industrial Revolution
by Charles R. Morris · 1 Jan 2012 · 456pp · 123,534 words

The Fair Trade Scandal: Marketing Poverty to Benefit the Rich
by Ndongo Sylla · 21 Jan 2014 · 193pp · 63,618 words

Earth Wars: The Battle for Global Resources
by Geoff Hiscock · 23 Apr 2012 · 363pp · 101,082 words
Civilization: The West and the Rest
by Niall Ferguson · 28 Feb 2011 · 790pp · 150,875 words
Capitalism in America: A History
by Adrian Wooldridge and Alan Greenspan · 15 Oct 2018 · 585pp · 151,239 words
The Economics Anti-Textbook: A Critical Thinker's Guide to Microeconomics
by Rod Hill and Anthony Myatt · 15 Mar 2010

Making the Modern World: Materials and Dematerialization
by Vaclav Smil · 16 Dec 2013 · 396pp · 117,897 words
The Great Divide: Unequal Societies and What We Can Do About Them
by Joseph E. Stiglitz · 15 Mar 2015 · 409pp · 125,611 words
Numbers Don't Lie: 71 Stories to Help Us Understand the Modern World
by Vaclav Smil · 4 May 2021 · 252pp · 60,959 words
Visions of Inequality: From the French Revolution to the End of the Cold War
by Branko Milanovic · 9 Oct 2023

Open: The Progressive Case for Free Trade, Immigration, and Global Capital
by Kimberly Clausing · 4 Mar 2019 · 555pp · 80,635 words
How Asia Works
by Joe Studwell · 1 Jul 2013 · 868pp · 147,152 words
The End of Doom: Environmental Renewal in the Twenty-First Century
by Ronald Bailey · 20 Jul 2015 · 417pp · 109,367 words

Scarcity: The True Cost of Not Having Enough
by Sendhil Mullainathan · 3 Sep 2014 · 305pp · 89,103 words
Making Globalization Work
by Joseph E. Stiglitz · 16 Sep 2006
The Growth Delusion: Wealth, Poverty, and the Well-Being of Nations
by David Pilling · 30 Jan 2018 · 264pp · 76,643 words
The Long Game: China's Grand Strategy to Displace American Order
by Rush Doshi · 24 Jun 2021 · 816pp · 191,889 words
Prosperity Without Growth: Foundations for the Economy of Tomorrow
by Tim Jackson · 8 Dec 2016 · 573pp · 115,489 words
MegaThreats: Ten Dangerous Trends That Imperil Our Future, and How to Survive Them
by Nouriel Roubini · 17 Oct 2022 · 328pp · 96,678 words
Stakeholder Capitalism: A Global Economy That Works for Progress, People and Planet
by Klaus Schwab and Peter Vanham · 27 Jan 2021 · 460pp · 107,454 words
Kicking Awaythe Ladder
by Ha-Joon Chang · 4 Sep 2000 · 192pp

Europe: A History
by Norman Davies · 1 Jan 1996

Affluenza: When Too Much Is Never Enough
by Clive Hamilton and Richard Denniss · 31 May 2005
How to Speak Money: What the Money People Say--And What It Really Means
by John Lanchester · 5 Oct 2014 · 261pp · 86,905 words
Stocks for the Long Run 5/E: the Definitive Guide to Financial Market Returns & Long-Term Investment Strategies
by Jeremy Siegel · 7 Jan 2014 · 517pp · 139,477 words
Oil Panic and the Global Crisis: Predictions and Myths
by Steven M. Gorelick · 9 Dec 2009 · 257pp · 94,168 words

The Brussels Effect: How the European Union Rules the World
by Anu Bradford · 14 Sep 2020 · 696pp · 184,001 words

Unhealthy societies: the afflictions of inequality
by Richard G. Wilkinson · 19 Nov 1996 · 268pp · 89,761 words
The Great Surge: The Ascent of the Developing World
by Steven Radelet · 10 Nov 2015 · 437pp · 115,594 words
Smarter Investing
by Tim Hale · 2 Sep 2014 · 332pp · 81,289 words

23 Things They Don't Tell You About Capitalism
by Ha-Joon Chang · 1 Jan 2010 · 365pp · 88,125 words
This Is How They Tell Me the World Ends: The Cyberweapons Arms Race
by Nicole Perlroth · 9 Feb 2021 · 651pp · 186,130 words
The Glass Half-Empty: Debunking the Myth of Progress in the Twenty-First Century
by Rodrigo Aguilera · 10 Mar 2020 · 356pp · 106,161 words
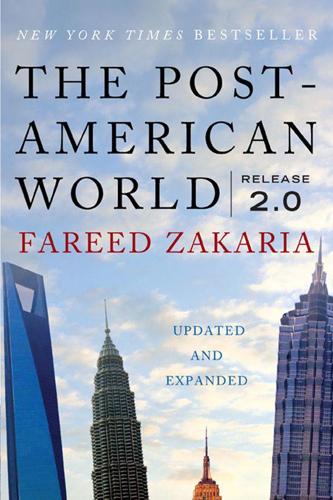
The Post-American World: Release 2.0
by Fareed Zakaria · 1 Jan 2008 · 344pp · 93,858 words
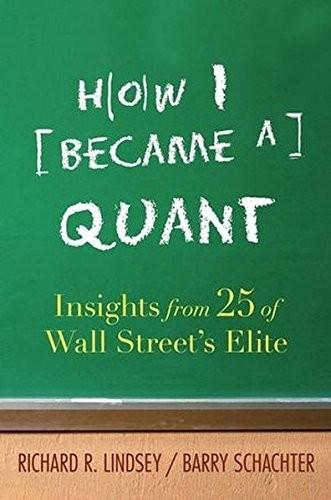
How I Became a Quant: Insights From 25 of Wall Street's Elite
by Richard R. Lindsey and Barry Schachter · 30 Jun 2007
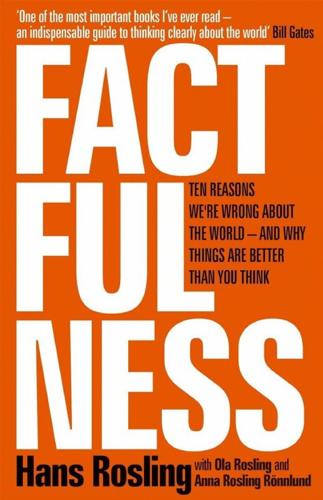
Factfulness: Ten Reasons We're Wrong About the World – and Why Things Are Better Than You Think
by Hans Rosling, Ola Rosling and Anna Rosling Rönnlund · 2 Apr 2018 · 288pp · 85,073 words
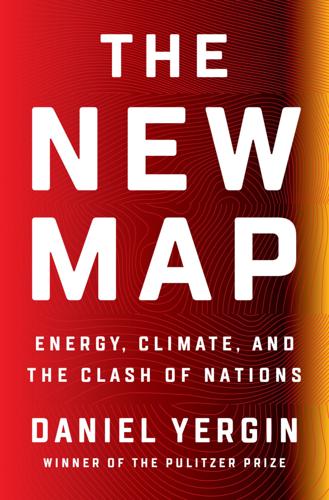
The New Map: Energy, Climate, and the Clash of Nations
by Daniel Yergin · 14 Sep 2020
Growth: A Reckoning
by Daniel Susskind · 16 Apr 2024 · 358pp · 109,930 words
Traders, Guns & Money: Knowns and Unknowns in the Dazzling World of Derivatives
by Satyajit Das · 15 Nov 2006 · 349pp · 134,041 words
A Pelican Introduction Economics: A User's Guide
by Ha-Joon Chang · 26 May 2014 · 385pp · 111,807 words
No Ordinary Disruption: The Four Global Forces Breaking All the Trends
by Richard Dobbs and James Manyika · 12 May 2015 · 389pp · 87,758 words
What Would the Great Economists Do?: How Twelve Brilliant Minds Would Solve Today's Biggest Problems
by Linda Yueh · 4 Jun 2018 · 453pp · 117,893 words
The Great Economists: How Their Ideas Can Help Us Today
by Linda Yueh · 15 Mar 2018 · 374pp · 113,126 words

Limitarianism: The Case Against Extreme Wealth
by Ingrid Robeyns · 16 Jan 2024 · 327pp · 110,234 words
The World in 2050: Four Forces Shaping Civilization's Northern Future
by Laurence C. Smith · 22 Sep 2010 · 421pp · 120,332 words
Reinventing the Bazaar: A Natural History of Markets
by John McMillan · 1 Jan 2002 · 350pp · 103,988 words
The End of Men: And the Rise of Women
by Hanna Rosin · 31 Aug 2012 · 320pp · 96,006 words
Big Debt Crises
by Ray Dalio · 9 Sep 2018 · 782pp · 187,875 words
Crashed: How a Decade of Financial Crises Changed the World
by Adam Tooze · 31 Jul 2018 · 1,066pp · 273,703 words
Good Economics for Hard Times: Better Answers to Our Biggest Problems
by Abhijit V. Banerjee and Esther Duflo · 12 Nov 2019 · 470pp · 148,730 words
Economists and the Powerful
by Norbert Haring, Norbert H. Ring and Niall Douglas · 30 Sep 2012 · 261pp · 103,244 words
The Rational Optimist: How Prosperity Evolves
by Matt Ridley · 17 May 2010 · 462pp · 150,129 words
Profiting Without Producing: How Finance Exploits Us All
by Costas Lapavitsas · 14 Aug 2013 · 554pp · 158,687 words
Seriously Curious: The Facts and Figures That Turn Our World Upside Down
by Tom Standage · 27 Nov 2018 · 215pp · 59,188 words
It's Better Than It Looks: Reasons for Optimism in an Age of Fear
by Gregg Easterbrook · 20 Feb 2018 · 424pp · 119,679 words
Red Flags: Why Xi's China Is in Jeopardy
by George Magnus · 10 Sep 2018 · 371pp · 98,534 words
Basic Income: A Radical Proposal for a Free Society and a Sane Economy
by Philippe van Parijs and Yannick Vanderborght · 20 Mar 2017
The Divide: A Brief Guide to Global Inequality and Its Solutions
by Jason Hickel · 3 May 2017 · 332pp · 106,197 words

The New Silk Roads: The Present and Future of the World
by Peter Frankopan · 14 Jun 2018 · 352pp · 80,030 words
The Meritocracy Trap: How America's Foundational Myth Feeds Inequality, Dismantles the Middle Class, and Devours the Elite
by Daniel Markovits · 14 Sep 2019 · 976pp · 235,576 words
The Price of Inequality: How Today's Divided Society Endangers Our Future
by Joseph E. Stiglitz · 10 Jun 2012 · 580pp · 168,476 words
The Looting Machine: Warlords, Oligarchs, Corporations, Smugglers, and the Theft of Africa's Wealth
by Tom Burgis · 24 Mar 2015 · 413pp · 119,379 words
When China Rules the World: The End of the Western World and the Rise of the Middle Kingdom
by Martin Jacques · 12 Nov 2009 · 859pp · 204,092 words
Power Hungry: The Myths of "Green" Energy and the Real Fuels of the Future
by Robert Bryce · 26 Apr 2011 · 520pp · 129,887 words
The Great Disruption: Why the Climate Crisis Will Bring on the End of Shopping and the Birth of a New World
by Paul Gilding · 28 Mar 2011 · 337pp · 103,273 words

Accessory to War: The Unspoken Alliance Between Astrophysics and the Military
by Neil Degrasse Tyson and Avis Lang · 10 Sep 2018 · 745pp · 207,187 words
The Metropolitan Revolution: How Cities and Metros Are Fixing Our Broken Politics and Fragile Economy
by Bruce Katz and Jennifer Bradley · 10 Jun 2013

One Billion Americans: The Case for Thinking Bigger
by Matthew Yglesias · 14 Sep 2020
The Finance Curse: How Global Finance Is Making Us All Poorer
by Nicholas Shaxson · 10 Oct 2018 · 482pp · 149,351 words
The Verdict: Did Labour Change Britain?
by Polly Toynbee and David Walker · 6 Oct 2011 · 471pp · 109,267 words
Exceptional People: How Migration Shaped Our World and Will Define Our Future
by Ian Goldin, Geoffrey Cameron and Meera Balarajan · 20 Dec 2010 · 482pp · 117,962 words
The New Economics: A Bigger Picture
by David Boyle and Andrew Simms · 14 Jun 2009 · 207pp · 86,639 words
Hawai'I Becalmed: Economic Lessons of the 1990s
by Christopher Grandy · 30 Sep 2002 · 145pp · 43,599 words

Cultural Backlash: Trump, Brexit, and Authoritarian Populism
by Pippa Norris and Ronald Inglehart · 31 Dec 2018

Them and Us: How Immigrants and Locals Can Thrive Together
by Philippe Legrain · 14 Oct 2020 · 521pp · 110,286 words
Where Does Money Come From?: A Guide to the UK Monetary & Banking System
by Josh Ryan-Collins, Tony Greenham, Richard Werner and Andrew Jackson · 14 Apr 2012

In Spite of the Gods: The Rise of Modern India
by Edward Luce · 23 Aug 2006 · 403pp · 132,736 words
Creating Unequal Futures?: Rethinking Poverty, Inequality and Disadvantage
by Ruth Fincher and Peter Saunders · 1 Jul 2001 · 267pp · 79,905 words
A Random Walk Down Wall Street: The Time-Tested Strategy for Successful Investing
by Burton G. Malkiel · 10 Jan 2011 · 416pp · 118,592 words

Matchmakers: The New Economics of Multisided Platforms
by David S. Evans and Richard Schmalensee · 23 May 2016 · 383pp · 81,118 words

Costa Rica
by Matthew Firestone, Carolina Miranda and César G. Soriano · 2 Jan 2008
Plenitude: The New Economics of True Wealth
by Juliet B. Schor · 12 May 2010 · 309pp · 78,361 words
China into Africa: trade, aid, and influence
by Robert I. Rotberg · 15 Nov 2008 · 651pp · 135,818 words
Planet Ponzi
by Mitch Feierstein · 2 Feb 2012 · 393pp · 115,263 words

Beyond: Our Future in Space
by Chris Impey · 12 Apr 2015 · 370pp · 97,138 words
Other People's Money: Masters of the Universe or Servants of the People?
by John Kay · 2 Sep 2015 · 478pp · 126,416 words

The King of Oil: The Secret Lives of Marc Rich
by Daniel Ammann · 12 Oct 2009 · 479pp · 102,876 words

Animal Spirits: How Human Psychology Drives the Economy, and Why It Matters for Global Capitalism
by George A. Akerlof and Robert J. Shiller · 1 Jan 2009 · 471pp · 97,152 words
The Invisible Hands: Top Hedge Fund Traders on Bubbles, Crashes, and Real Money
by Steven Drobny · 18 Mar 2010 · 537pp · 144,318 words
A Random Walk Down Wall Street: The Time-Tested Strategy for Successful Investing (Eleventh Edition)
by Burton G. Malkiel · 5 Jan 2015 · 482pp · 121,672 words

The Most Good You Can Do: How Effective Altruism Is Changing Ideas About Living Ethically
by Peter Singer · 1 Jan 2015 · 197pp · 59,656 words
Vulture Capitalism: Corporate Crimes, Backdoor Bailouts, and the Death of Freedom
by Grace Blakeley · 11 Mar 2024 · 371pp · 137,268 words
The Sharing Economy: The End of Employment and the Rise of Crowd-Based Capitalism
by Arun Sundararajan · 12 May 2016 · 375pp · 88,306 words

Unsustainable Inequalities: Social Justice and the Environment
by Lucas Chancel · 15 Jan 2020 · 191pp · 51,242 words
Human Frontiers: The Future of Big Ideas in an Age of Small Thinking
by Michael Bhaskar · 2 Nov 2021

The Classical School
by Callum Williams · 19 May 2020 · 288pp · 89,781 words
An Extraordinary Time: The End of the Postwar Boom and the Return of the Ordinary Economy
by Marc Levinson · 31 Jul 2016 · 409pp · 118,448 words
Global Financial Crisis
by Noah Berlatsky · 19 Feb 2010
The Economics of Inequality
by Thomas Piketty and Arthur Goldhammer · 7 Jan 2015 · 165pp · 45,129 words
Empire of Things: How We Became a World of Consumers, From the Fifteenth Century to the Twenty-First
by Frank Trentmann · 1 Dec 2015 · 1,213pp · 376,284 words
Slowdown: The End of the Great Acceleration―and Why It’s Good for the Planet, the Economy, and Our Lives
by Danny Dorling and Kirsten McClure · 18 May 2020 · 459pp · 138,689 words
Connectography: Mapping the Future of Global Civilization
by Parag Khanna · 18 Apr 2016 · 497pp · 144,283 words
The White Man's Burden: Why the West's Efforts to Aid the Rest Have Done So Much Ill and So Little Good
by William Easterly · 1 Mar 2006

The Retreat of Western Liberalism
by Edward Luce · 20 Apr 2017 · 223pp · 58,732 words
The Triumph of Injustice: How the Rich Dodge Taxes and How to Make Them Pay
by Emmanuel Saez and Gabriel Zucman · 14 Oct 2019 · 232pp · 70,361 words

The Complacent Class: The Self-Defeating Quest for the American Dream
by Tyler Cowen · 27 Feb 2017 · 287pp · 82,576 words
The World for Sale: Money, Power and the Traders Who Barter the Earth’s Resources
by Javier Blas and Jack Farchy · 25 Feb 2021 · 565pp · 134,138 words
Statistics in a Nutshell
by Sarah Boslaugh · 10 Nov 2012
Were You Born on the Wrong Continent?
by Thomas Geoghegan · 20 Sep 2011 · 364pp · 104,697 words
The Great Divergence: America's Growing Inequality Crisis and What We Can Do About It
by Timothy Noah · 23 Apr 2012 · 309pp · 91,581 words
Every Nation for Itself: Winners and Losers in a G-Zero World
by Ian Bremmer · 30 Apr 2012 · 234pp · 63,149 words
Doing Good Better: How Effective Altruism Can Help You Make a Difference
by William MacAskill · 27 Jul 2015 · 293pp · 81,183 words
The Rise and Fall of Nations: Forces of Change in the Post-Crisis World
by Ruchir Sharma · 5 Jun 2016 · 566pp · 163,322 words
Rewriting the Rules of the European Economy: An Agenda for Growth and Shared Prosperity
by Joseph E. Stiglitz · 28 Jan 2020 · 408pp · 108,985 words
Reinventing Capitalism in the Age of Big Data
by Viktor Mayer-Schönberger and Thomas Ramge · 27 Feb 2018 · 267pp · 72,552 words
Automation and the Future of Work
by Aaron Benanav · 3 Nov 2020 · 175pp · 45,815 words
The Elusive Quest for Growth: Economists' Adventures and Misadventures in the Tropics
by William R. Easterly · 1 Aug 2002 · 355pp · 63 words

How to Avoid a Climate Disaster: The Solutions We Have and the Breakthroughs We Need
by Bill Gates · 16 Feb 2021 · 314pp · 75,678 words

As the Future Catches You: How Genomics & Other Forces Are Changing Your Work, Health & Wealth
by Juan Enriquez · 15 Feb 2001 · 239pp · 45,926 words

Them And Us: Politics, Greed And Inequality - Why We Need A Fair Society
by Will Hutton · 30 Sep 2010 · 543pp · 147,357 words
The People's Republic of Walmart: How the World's Biggest Corporations Are Laying the Foundation for Socialism
by Leigh Phillips and Michal Rozworski · 5 Mar 2019 · 202pp · 62,901 words

The Perfect Police State: An Undercover Odyssey Into China's Terrifying Surveillance Dystopia of the Future
by Geoffrey Cain · 28 Jun 2021 · 340pp · 90,674 words

Antifragile: Things That Gain From Disorder
by Nassim Nicholas Taleb · 27 Nov 2012 · 651pp · 180,162 words
Adam Smith: Father of Economics
by Jesse Norman · 30 Jun 2018
Volt Rush: The Winners and Losers in the Race to Go Green
by Henry Sanderson · 12 Sep 2022 · 292pp · 87,720 words
Why the West Rules--For Now: The Patterns of History, and What They Reveal About the Future
by Ian Morris · 11 Oct 2010 · 1,152pp · 266,246 words
Plutocrats: The Rise of the New Global Super-Rich and the Fall of Everyone Else
by Chrystia Freeland · 11 Oct 2012 · 481pp · 120,693 words
Life You Can Save: Acting Now to End World Poverty
by Peter Singer · 3 Mar 2009 · 190pp · 61,970 words

Apocalypse Never: Why Environmental Alarmism Hurts Us All
by Michael Shellenberger · 28 Jun 2020
Upheaval: Turning Points for Nations in Crisis
by Jared Diamond · 6 May 2019 · 459pp · 144,009 words

Brexit, No Exit: Why in the End Britain Won't Leave Europe
by Denis MacShane · 14 Jul 2017 · 308pp · 99,298 words

The New Class War: Saving Democracy From the Metropolitan Elite
by Michael Lind · 20 Feb 2020

Ten Lessons for a Post-Pandemic World
by Fareed Zakaria · 5 Oct 2020 · 289pp · 86,165 words
Shocks, Crises, and False Alarms: How to Assess True Macroeconomic Risk
by Philipp Carlsson-Szlezak and Paul Swartz · 8 Jul 2024 · 259pp · 89,637 words
The End of Indexing: Six Structural Mega-Trends That Threaten Passive Investing
by Niels Jensen · 25 Mar 2018 · 205pp · 55,435 words
Masters of Management: How the Business Gurus and Their Ideas Have Changed the World—for Better and for Worse
by Adrian Wooldridge · 29 Nov 2011 · 460pp · 131,579 words
The Next Factory of the World: How Chinese Investment Is Reshaping Africa
by Irene Yuan Sun · 16 Oct 2017 · 239pp · 62,311 words
The Limits to Growth: The 30-Year Update
by Donella H. Meadows, Jørgen Randers and Dennis L. Meadows · 15 Apr 2004 · 357pp · 100,718 words

Energy and Civilization: A History
by Vaclav Smil · 11 May 2017

The Rise of the Network Society
by Manuel Castells · 31 Aug 1996 · 843pp · 223,858 words
The Trouble With Billionaires
by Linda McQuaig · 1 May 2013 · 261pp · 81,802 words

Open Space: From Earth to Eternity--the Global Race to Explore and Conquer the Cosmos
by David Ariosto · 24 Mar 2026 · 433pp · 116,344 words
Modern China: A Very Short Introduction
by Rana Mitter · 25 Feb 2016 · 193pp · 46,052 words
How Much Is Enough?: Money and the Good Life
by Robert Skidelsky and Edward Skidelsky · 18 Jun 2012 · 279pp · 87,910 words
Obliquity: Why Our Goals Are Best Achieved Indirectly
by John Kay · 30 Apr 2010 · 237pp · 50,758 words

Brave New World of Work
by Ulrich Beck · 15 Jan 2000 · 236pp · 67,953 words
The World's Banker: A Story of Failed States, Financial Crises, and the Wealth and Poverty of Nations
by Sebastian Mallaby · 24 Apr 2006 · 605pp · 169,366 words
A World Without Work: Technology, Automation, and How We Should Respond
by Daniel Susskind · 14 Jan 2020 · 419pp · 109,241 words

Winning the War on War: The Decline of Armed Conflict Worldwide
by Joshua S. Goldstein · 15 Sep 2011 · 511pp · 148,310 words
In the Graveyard of Empires: America's War in Afghanistan
by Seth G. Jones · 12 Apr 2009 · 566pp · 144,072 words

21 Lessons for the 21st Century
by Yuval Noah Harari · 29 Aug 2018 · 389pp · 119,487 words

Rethinking Islamism: The Ideology of the New Terror
by Meghnad Desai · 25 Apr 2008