revenue passenger mile
description: unit for revenue passenger transport work defined as the number of persons in a vehicle multiplied by kilometers transported
6 results
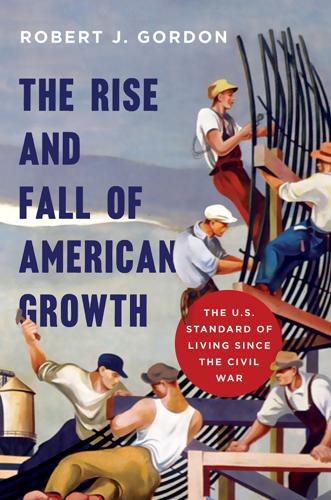
The Rise and Fall of American Growth: The U.S. Standard of Living Since the Civil War (The Princeton Economic History of the Western World)
by Robert J. Gordon · 12 Jan 2016 · 1,104pp · 302,176 words
to 2012 was a mere 1.1 percent. In fact, vehicle miles per person in 2012 were 6.4 percent lower than in 2004. Airline revenue passenger miles (RPMs), also shown in figure 11–1, exhibited the same phenomenon of slowing growth. It is natural for any industry to experience rapid growth after
…
2013 at the turtlelike pace of 0.6 percent per year. Figure 11–1. Vehicle-Miles per Person, Railroad Passenger-Miles per Person, and Airline Revenue Passenger-Miles per Person, 1900–2012 Source: Federal Highway Administration Table VM-201, HSUS series Df413-415, Df903, Df950, and Aa7, Traffic Safety Facts NHTSA Chapter 1
…
Orleans to Los Angeles. 13. The best recent source is White (2011). Classic earlier references include Chandler (1977). 14. Stilgoe (2007, p. 115). 15. System revenue passenger miles from the Bureau of Transportation Statistics. 16. As shown in table 5–1, in 1870 elapsed railroad times between major cities were between twenty and
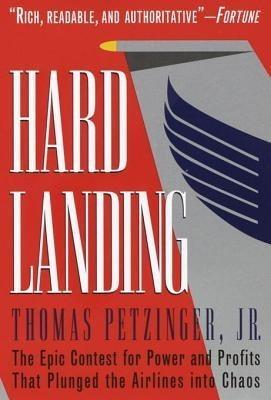
Hard Landing
by Thomas Petzinger and Thomas Petzinger Jr. · 1 Jan 1995 · 726pp · 210,048 words
than hired help. “Airline pilots are simply a form of high-paid production workers,” he would later declare in a speech at Harvard. “We produce revenue-passenger miles instead of widgets, TV sets, or shoes.” Pilots, though long accustomed to thinking of themselves as “professionals,” were not in fact professionals at all by
…
”: Burr 9/16/93 interview. 14. “Carney rolls the spitballs”: Coats 6/9/94 interview. 15. The next four: Based on 1978 rankings according to revenue passenger miles. 16. fact that appalled Lorenzo: “Texas International’s Lorenzo Believes He Has a National Grasp,” by Nicholas C. Chriss, Los Angeles Times, Oct. 29, 1978

Skygods: The Fall of Pan Am
by Robert Gandt · 1 Mar 1995 · 371pp · 101,792 words
chorus of the Primitives. To Trippe, the jet was imminently logical and inevitable. Never mind the whining about development expense and cost per copy and revenue-passenger-mile cost and noise and range and economy. Those problems would be solved. They always were. Speed, for its own sake, was not the most important
…
more than anyone had explained why Pan Am made money at one time. When Plaskett trotted out his cue cards and recited statistics about RPMs (revenue passenger miles) and load factors (percentage of seats filled) and yield (how much you were getting—or in Pan Am’s case, weren’t getting—from your
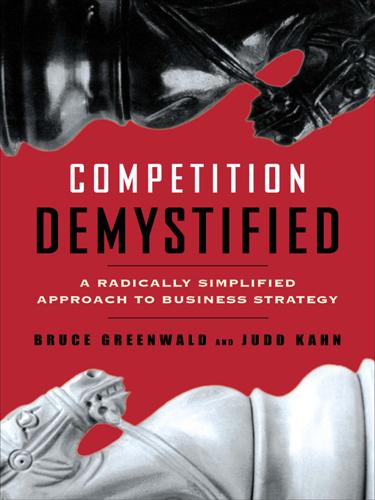
Competition Demystified
by Bruce C. Greenwald · 31 Aug 2016 · 482pp · 125,973 words
complex and opportunistic fare system to manage “yield” and “load.” The airlines defined “yield” as revenue divided by revenue passenger miles (the number of passenger seat miles actually sold), “load” (or “load factor”) as revenue passenger miles divided by available seat miles. Using their computerized reservations systems, the airlines could offer identical seats at wildly different
…
if it filled around 50 percent of its seats. Its cost structure was planned to come in at 20 percent lower than United’s per revenue passenger mile. Though this savings was substantial, South-west’s cost were some 18 percent lower still. But lower costs did not present the same kind of
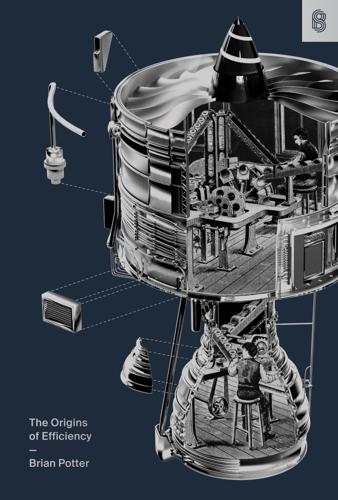
The Origins of Efficiency
by Brian Potter · 15 Feb 2025 · 474pp · 134,246 words
a larger fraction of its seats on a given type of aircraft… Because the airline’s total costs increase only slightly, its cost per RPM [revenue passenger miles] falls as it spreads the flight-specific fixed costs over more traffic volume. As traffic volume on the route gets even larger, it becomes worthwhile
Factfulness: Ten Reasons We're Wrong About the World – and Why Things Are Better Than You Think
by Hans Rosling, Ola Rosling and Anna Rosling Rönnlund · 2 Apr 2018 · 288pp · 85,073 words
of Transportation Statistics). US Air Carrier Safety Data. Total fatalities. National Transportation Statistics. Table 2-9. Accessed November 24, 2017. gapm.io/xbtsafat. BTS[2]. Revenue Passenger-miles (the number of passengers and the distance flown in thousands (000)). T-100 Segment data. Accessed November 4, 2017. gapm.io/xbtspass. Caldwell, J. C