The Four Pillars of Investing: Lessons for Building a Winning Portfolio
by
William J. Bernstein
Published 26 Apr 2002
Examining historical returns and imagining losing 50% or 80% of your capital is like practicing an airplane crash in a simulator. Trust me, there is a big difference between how you’ll behave in the simulator and how you’ll perform during the real thing. During bull markets, everyone believes that he is committed to stocks for the long term. Unfortunately, history also tells us that during bear markets, you can hardly give stocks away. Most investors are simply not capable of withstanding the vicissitudes of an all-stock investment strategy. The data for the U.S. markets displayed in Figures 1-9 to 1-14 are summarized in Table 1-1.
…
Had you begun your retirement in 1966, the combination of poor inflation-adjusted returns and mandatory withdrawals would likely have devastated your assets—there would have been little or no savings left to enjoy the high returns that followed. Bonds are even worse, since their returns do not mean revert—a series of bad years is likely to be followed by even more bad ones, as happened during the 1970s. This is the point made by Jeremy Siegel in his superb treatise, Stocks For The Long Run. Professor Siegel pointed out that stocks outperformed bonds in only 61% of the years after 1802, but that they bested bonds in 80% of ten-year periods and in 99% of 30-year periods. Looked at from another perspective, in the 30 years from 1952 to 1981, stocks returned 9.9% and bonds returned only 2.3%, while inflation annualized out at 4.3%.
…
Modigliani, Franco, and Miller, Merton H., “The Cost of Capital, Corporation Finance, and the Theory of Investment.” American Economic Review, Vol. 48, No. 3 (June) 1958. Nocera, Joseph, A Piece of the Action. Simon and Schuster, 1994. Norwich, John J., A History of Venice. Alfred A. Knopf, 1982. Siegel, Jeremy J., Stocks for the Long Run. McGraw-Hill, 1998. Strouse, Jean, Morgan: American Financier. Random House, 1999. Chapter 2 Bogle, John C., Common Sense on Mutual Funds. Wiley, 1999. Chancellor, Edward, Devil Take the Hindmost. Penguin, 1999. Clayman, Michelle, “In Search of Excellence: The Investor’s Viewpoint.”
Rigged Money: Beating Wall Street at Its Own Game
by
Lee Munson
Published 6 Dec 2011
Really, we make no money and what can you tell someone who wants you to look at their portfolio and tell them all of their initial ideas are great and not touch them? I have had some of these clients and they confuse me. I had a client who bought Citigroup all the way back when it hit the skids in 1994 for a few bucks after double-digit decline over the prior year. He bought the stock for the long term. After an 800 percent increase in value, the end of 2007 brought with it a serious decline in a few banking stocks, Citigroup being one of them. I suggested he let some loose. Why? He was sure that a short-term movement didn’t mean anything. As the losses piled up and the picture looked worse, I kept suggesting that he reallocate the money, or even buy a banking index to diversify the pain.
…
Don’t you want a strong buy? Did your strong conviction opportunistic buy become a hold? What makes it a hold now? You get the picture. When you own a stock that you consider a hold, it should either be getting near the point to take profits, or on a death watch. Be in or out, don’t linger. If you are in a stock for the long run, these ratings should not make any difference to your decision-making process. Thus, if you dare to care about ratings like buy, sell, or hold just watch the first one and leave the last two in the dust. So, although it seemed easy enough to get a hold of research, it was not helpful, nor did it lead me in any direction.
The Invisible Hands: Top Hedge Fund Traders on Bubbles, Crashes, and Real Money
by
Steven Drobny
Published 18 Mar 2010
While the debate over who or what deserves blame will likely rage for decades, the world has not ended and investors must now adapt and adjust to the new reality. The crisis of 2008 has called many investment mantras into question—notably the Endowment Model (diversifying into illiquid equity and equity-like investments) and others including stocks for the long term, buy the dip, buy and hold, and dollar cost averaging—yet no new model has taken root. The crisis of 2008 did, however, supply the financial community with an abundance of new information with regards to portfolio construction, in particular around risk, liquidity, and time horizons. After such an extreme year in the markets, reactions in the real money world have been polarized: some have learned valuable lessons and are incorporating them in their approach, whereas others are operating as if it is business as usual, completely dismissing 2008 as a one-in-a-hundred-year storm that has passed.
…
Real money management needs to be rethought as the old methodologies have failed. The massive growth of real money funds took place in a very benign environment where inflation was falling and virtually all assets performed well. In such conditions, static rule based strategies such as buy and hold, stocks for the long run, and the Endowment Model worked. But in a new, less benign world of higher volatility, a change in standard practice is required. Despite the widespread pain and colossal losses endured by most investors in 2008, there were a few bright spots. Global macro hedge funds, in aggregate, proved resilient by effectively managing risk and keeping a sharp focus on liquidity.
…
Part of the reason might be that asset returns in the 1980s and 1990s actually validated the 60-40 approach, as stocks had a very strong run over these two decades. Stocks have paid investors everything they required and more, naturally leading to an “if it ain’t broke, don’t fix it” attitude. It does not help matters when luminaries such as Jeremy Siegel extol “stocks for the long run” or renowned Yale endowment manager David Swensen endorses an “equity-centric” portfolio. Why do they do this? Because stocks have historically outpaced bonds over the long term, and this is indeed true. However, what is missing in this argument is the risk side of the equation. Yes, stocks return more than bonds, but they are riskier, too.
Stocks for the Long Run, 4th Edition: The Definitive Guide to Financial Market Returns & Long Term Investment Strategies
by
Jeremy J. Siegel
Published 18 Dec 2007
Siegel This page intentionally left blank ACKNOWLEDGMENTS It is never possible to list all the individuals and organizations that have praised Stocks for the Long Run and encouraged me to update and expand past editions. Many who provided me with data for the first three editions of Stocks for the Long Run willingly contributed their data again for this fourth edition, including the Vanguard Group, Morgan Stanley, Smithers & Co., and Randell Moore of Blue Chip Economic Indicators. Jeremy Schwartz, who was my principal researcher for the third edition of Stocks for the Long Run as well as for The Future for Investors, provided invaluable assistance for the fourth edition.
…
STOCKS FOR THE LONG RUN This page intentionally left blank F o u r t h E d i t i o n STOCKS FOR THE LONG RUN The Definitive Guide to Financial Market Returns and Long-Term Investment Strategies JEREMY J. SIEGEL Russell E. Palmer Professor of Finance The Wharton School University of Pennsylvania New York Chicago San Francisco Lisbon London Madrid Mexico City Milan New Delhi San Juan Seoul Singapore Sydney Toronto Copyright © 2008, 2002, 1998, 1994 by Jeremy J. Siegel. All rights reserved. Manufactured in the United States of America. Except as permitted under the United States Copyright Act of 1976, no part of this publication may be reproduced or distributed in any form or by any means, or stored in a database or retrieval system, without the prior written permission of the publisher. 0-07-164392-3 The material in this eBook also appears in the print version of this title: 0-07-149470-7.
…
For more information about this title, click here C O N T E N T S Foreword xv Preface xvii Acknowledgments xxi PART 1 THE VERDICT OF HISTORY Chapter 1 Stock and Bond Returns Since 1802 3 “Everybody Ought to Be Rich” 3 Financial Market Returns from 1802 5 The Long-Term Performance of Bonds 7 The End of the Gold Standard and Price Stability 9 Total Real Returns 11 Interpretation of Returns 12 Long-Term Returns 12 Short-Term Returns and Volatility 14 Real Returns on Fixed-Income Assets 14 The Fall in Fixed-Income Returns 15 The Equity Premium 16 Worldwide Equity and Bond Returns: Global Stocks for the Long Run 18 Conclusion: Stocks for the Long Run 20 Appendix 1: Stocks from 1802 to 1870 21 Appendix 2: Arithmetic and Geometric Returns 22 v vi Chapter 2 Risk, Return, and Portfolio Allocation: Why Stocks Are Less Risky Than Bonds in the Long Run 23 Measuring Risk and Return 23 Risk and Holding Period 24 Investor Returns from Market Peaks 27 Standard Measures of Risk 28 Varying Correlation between Stock and Bond Returns 30 Efficient Frontiers 32 Recommended Portfolio Allocations 34 Inflation-Indexed Bonds 35 Conclusion 36 Chapter 3 Stock Indexes: Proxies for the Market 37 Market Averages 37 The Dow Jones Averages 38 Computation of the Dow Index 39 Long-Term Trends in the Dow Jones 40 Beware the Use of Trend Lines to Predict Future Returns 41 Value-Weighted Indexes 42 Standard & Poor’s Index 42 Nasdaq Index 43 Other Stock Indexes: The Center for Research in Security Prices (CRSP) 45 Return Biases in Stock Indexes 46 Appendix: What Happened to the Original 12 Dow Industrials?
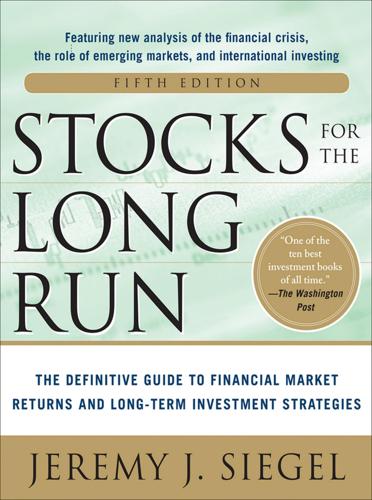
Stocks for the Long Run 5/E: the Definitive Guide to Financial Market Returns & Long-Term Investment Strategies
by
Jeremy Siegel
Published 7 Jan 2014
History convincingly demonstrates that stocks have been and will remain the best investment for all those seeking long-term gains. Jeremy J. Siegel November 2013 ACKNOWLEDGMENTS It is never possible to list all the individuals and organizations that have praised Stocks for the Long Run and encouraged me to update and expand past editions. Many who provided me with data for the first four editions of Stocks for the Long Run willingly contributed their data again for this fifth edition. David Bianco, Chief U.S. Equity Strategist at Deutsche Bank, whose historical work on S&P 500 earnings and profit margins was invaluable for my chapter on stock market valuation, and Walter Lenhard, senior investment strategist at Vanguard, once again obtained historical data on mutual fund performance for Chapter 23.
…
This edition would not have been possible without the hard work of Shaun Smith, who also did the research and data analysis for the first edition of Stocks for the Long Run in the early 1990s. Jeremy Schwartz, who was my principal researcher for The Future for Investors, also provided invaluable assistance for this edition. A special thanks goes to the thousands of financial advisors from dozens of financial firms, such as Merrill Lynch, Morgan Stanley, UBS, Wells Fargo, and many others who have provided me with critical feedback in seminars and open forums on earlier editions of Stocks for the Long Run. As before, the support of my family was critical in my being able to write this edition.
…
Research has revealed that there are predictable times during which the stock market, and certain groups of stocks in particular, do particularly well. The analysis in the first edition of Stocks for the Long Run, published in 1994, was based on long data series analyzed through the early 1990s. The calendar anomalies reported in that edition invited investors to outperform the market by adopting strategies to these unusual calendar events. However, as more investors learn of and act on these anomalies, the prices of stocks may adjust so that much, if not all, of the anomaly is eliminated. That certainly would be the prediction of the efficient market hypothesis. In this edition of Stocks for the Long Run, I also look at the evidence since 1994 to determine whether the anomaly survived or not.
In Pursuit of the Perfect Portfolio: The Stories, Voices, and Key Insights of the Pioneers Who Shaped the Way We Invest
by
Andrew W. Lo
and
Stephen R. Foerster
Published 16 Aug 2021
Using data from Ken French’s website, the average annual compound U.S. stock market return was 7.6 percent, while the average Treasury bill return was 1.9 percent.30 Over this period, the equity premium was 5.7 percent, in line with Mehra and Prescott’s historical estimate, and almost double the conservative expected equity premium forecast by Siegel and Thaler. Even though their estimate was low, there should be no complaints (and hence no phone calls) about their comments from investors who put more pension money into stocks and heeded their advice! Stocks for the Long Run In 1994, Siegel published his most popular work, the book Stocks for the Long Run. It became a best seller, with hundreds of thousands of copies sold through its five editions.31 The most recent edition has the subtitle “The Definitive Guide to Financial Market Returns and Long-Term Investment Strategies,” and it certainly is that.
…
Economics.”11 Rational Beginnings After completing his undergraduate degree in 1967, Shiller went directly to the PhD program at the Massachusetts Institute of Technology (MIT). One of his fellow students was lifelong friend Jeremy Siegel (featured in chapter 11), who went on to become a distinguished professor at the Wharton School and is now best known for his book Stocks for the Long Run. At MIT, Shiller connected with Samuelson in person and, after reading his textbook, considered it an honor to have Samuelson as a teacher and admired his approach to economics as a mathematical science. Shiller’s dissertation adviser was Franco Modigliani, who would receive the Nobel Prize in Economics in 1985.
…
Get it not quite right for you, and you’ll wish you had.”85 The Perfect Portfolio for you starts with knowing you. 11 Jeremy Siegel, the Wizard of Wharton WHEN MOST INVESTORS think of an investment portfolio today, the asset class that comes to mind is stocks. One of the most influential proponents of the importance of holding stocks in one’s portfolio is Jeremy Siegel. He’s often been called the Wizard of Wharton,1 and with good reason. His classic book on investments, Stocks for the Long Run, first published in 1994 and now in its fifth edition, builds a compelling evidence-based case for why long-term investors should make stocks a big part of their portfolio. Initially trained as an economist, Siegel always had a passion for investments. As one of the premier business educators in the country, his classes at Wharton were often standing room only, since so many MBA students—including ones who could not enroll in his classes because they were already full—would go to his morning briefings to hear his perspective on market dynamics.
The Gone Fishin' Portfolio: Get Wise, Get Wealthy...and Get on With Your Life
by
Alexander Green
Published 15 Sep 2008
Not cash, not bonds, not real estate, not gold, not collectibles, nothing. That’s why I call common stocks “the greatest wealth-creating machine of all time.” HISTORY DOESN’T LIE Dr. Jeremy Siegel, a professor of finance at The Wharton School of the University of Pennsylvania and author of Stocks for the Long Run, has done a thorough historical study of the returns of different types of assets over the past couple hundred years. What he discovered is dramatic: $1 invested in gold in 1802 was worth $32.84 at the end of 2006. The same dollar invested in T-bills would have grown to $5,061. $1 invested in bonds would be worth $18,235.
…
Start whenever you want and you’ll find that when measured in decades the investment returns for different asset classes are remarkably consistent. Stocks are the big winner. Since 1926, the stock market has generated a positive return in 59 out of 82 calendar years—or nearly three out of every four years. FIGURE 5.1 Total Nominal Return Indices (January 1802 to December 31, 2006) Source: Jeremy J. Siegel Stocks for the Long Run, 4th Ed., McGraw-Hill, 2007. Of course, it’s those inevitable down years that quickly take the fun out of the stock market for most investors. Since 1945, the S&P 500 has tumbled nearly 26%, on average, in the periods leading up to and during recessions. That often drives investors to the sidelines, where they miss the ensuing rally.
…
A paper money standard, properly managed, can prevent the severe depressions that plagued the gold standard, while keeping inflation moderate, as we’ve seen over the past couple of decades. Still, every stock investor should understand the Great Depression and how it affected investors. For example, in all four editions of Stocks for the Long Run, Dr. Jeremy Siegel has told the infamous story of John Jacob Raskob. In the summer of 1929, Ladies Home Journal interviewed Raskob, a senior executive with General Motors, about how the typical individual could build wealth by investing in stocks. In the article published that August, titled “Everybody Ought to Be Rich,” Raskob claimed that by putting $15 a month into high-quality stocks, even the average worker could become wealthy.

Irrational Exuberance: With a New Preface by the Author
by
Robert J. Shiller
Published 15 Feb 2000
However, the article defines the list as the stocks with the highest price-earnings ratio in 1972, whereas Siegel uses 1970 as the starting date for his analysis. 8. Jeremy J. Siegel, Stocks for the Long Run, 2nd ed. (New York: McGraw-Hill, 1998), pp. 105–14. 9. Charles Mackay, Memoirs of Extraordinary Popular Delusions and the Madness of Crowds (London: Bentley, 1841), p. 142. 10. Peter Garber, Famous First Bubbles: The Fundamentals of Early Manias (Cambridge, Mass.: MIT Press, 2000). 11. Siegel, Stocks for the Long Run, p. 107. 12. See Jeremy J. Siegel, “Are Internet Stocks Overvalued? Are They Ever,” Wall Street Journal, April 19, 1999, p. 22. This article appears to have caused a mini-crash in Internet stocks the day it appeared: the NASDAQ, which is heavy on high-tech stocks, dropped 5.6% that day, representing its third largest percentage drop in ten years. 13.
…
And if some stocks can be overpriced, then does it not follow that the market as a whole can be overpriced, given that those stocks are part of the market? Questioning the Examples of Obvious Mispricing Still, despite the apparent obviousness of some examples of mispricing, there are those who question the examples. Jeremy Siegel, in his book Stocks for the Long Run, points out that some of the most E F F ICIE N T MARKE TS , RANDOM WALKS, AND BUBB LES 177 widely cited examples of mispricings in years gone by really made sense in the long run. Siegel cites a list of fifty stocks that were apparently called the “Nifty Fifty” as early as 1970 or 1972: glamorous stocks for which people had high expectations and that traded at very high price-earnings ratios.
…
“Learning” about Risk It is commonly said that people have recently learned that the stock market is much less risky than they once thought it was, and that the stock market has always outperformed other investments. Their “learning” is allegedly the result of widespread media coverage in the past few years of the historical superiority of stocks as investments, and of the publication in 1994 of the first edition of Jeremy Siegel’s book Stocks for the Long Run. According to this view, people have realized that, in light of historical statistics, they have been too fearful of stocks. Armed with this new knowledge, investors have now bid stock prices up to a higher level, to their rational or true level, where the stocks would have been all along had there not been excessive fear of them.
A Wealth of Common Sense: Why Simplicity Trumps Complexity in Any Investment Plan
by
Ben Carlson
Published 14 May 2015
Kenneth Fisher, The Little Book of Market Myths: How to Profit by Avoiding the Investment Mistakes Everyone Else Makes (Hoboken, NJ: John Wiley & Sons, 2013). 14. Michael Mauboussin, More Than You Know: Finding Financial Wisdom in Unconventional Places (New York: Columbia University Press, 2007). 15. Jeremy Siegel, Stocks for the Long Run: The Definitive Guide to Financial Market Returns & Long-Term Investment Strategies, 5th ed. (New York: McGraw-Hill, 2013). CHAPTER 4 Market Myths and Market History Investment wisdom begins with the realization that long-term returns are the only ones that matter. —William Bernstein Meet Bob.
…
That means the market has fallen an average of 20 percent every five years or so without the economy going into a recession.4 Table 4.5 Stocks Fall 10 Percent or More with No Recession 1946–1947 –23.2% 1961–1962 –27.1% 1966 –22.3% 1967–1968 –12.5% 1971 –16.1% 1978 –12.8% 1983–1984 –15.6% 1987 –35.1% 1997 –13.3% 1998 –19.3% 2002 –31.5% 2010 –13.6% 2011 –16.8% Source: Stocks for the Long Run. The stock market and the economy are rarely in sync with one another. Economic growth tells us very little about where the stock market is going next. Over a one-year period the relationship between GDP growth and stock market returns is next to nothing (a correlation of 0.01 where 0 implies no relationship between the data and 1.0 implies a perfect relationship between movements in the data).
…
While stock market crashes can be much more severe than bond market losses, the attractiveness of bonds over stocks wears off the longer the historical time horizon gets pushed out (see Table 4.9). Table 4.9 Percentage of the Time Stocks Outperformed Bonds from 1871 to 2012 Time Frame Stock Winning % 1 Year 61.3% 5 Years 69.0% 10 Years 78.2% 20 Years 95.8% 30 Years 99.3% Source: Stocks for the Long Run. If you tally up each of the annual 30-year returns going back to 1928 for both stocks and bonds, the standard deviation, or variation, in those returns is actually larger for bonds than it is for stocks. It's 1.4 percent for stocks and 2.7 percent for bonds. What this means is that, on average, the 30-year annual returns are more variable in bonds than they are in stocks, historically speaking.
Adaptive Markets: Financial Evolution at the Speed of Thought
by
Andrew W. Lo
Published 3 Apr 2017
Principle 5 makes your asset allocation decision even simpler: just hold stocks for the long run. This principle is based on the hugely influential book Stocks for the Long Run, written by the Wharton financial economist Jeremy Siegel.2 First published in 1994, this book is now in its fifth edition, and has become the “buy and hold Bible” of the investment management industry. Siegel’s argument isn’t hard to summarize: since 1802, the farthest back we have data on stocks, the historical performance of the U.S. stock market has been very attractive over sufficiently long holding periods. We could all be rich if we only held onto stocks for the long run. These five principles have become the foundation of the investment management industry, influencing virtually every product and service offered by financial professionals.
…
Efficient markets mean that there’s no such thing as a free lunch, especially on Wall Street: if financial market prices fully incorporate all relevant information already, trying to beat the market is a hopeless task. Instead, you should all put your money into passive index funds that diversify as broadly as possible, and stay invested in stocks for the long run. Sound familiar? This is the theory that we teach in business schools today, and it was taught to your broker, your financial adviser, and your portfolio manager. In 2013, University of Chicago finance professor Eugene F. Fama was awarded the Nobel Prize in Economic Sciences specifically for this notion of market efficiency.3 The Adaptive Markets Hypothesis is based on the insight that investors and financial markets behave more like biology than physics, comprising a population of living organisms competing to survive, not a collection of inanimate objects subject to immutable laws of motion.
…
Using statistical estimates derived from Principle 2 and the CAPM, portfolio managers can construct diversified long-only portfolios of financial assets that offer investors attractive risk-adjusted rates of return at low cost. Principle 4: Asset Allocation. Choosing how much to invest in broad asset classes is more important than picking individual securities, so the asset allocation decision is sufficient for managing the risk of an investor’s savings. Principle 5: Stocks for the Long Run. Investors should hold mostly equities for the long run. Principle 1 is straightforward: the only way investors would willingly take on a higher-risk asset is if they’re given an incentive for doing so, and that incentive comes in the form of higher expected return. That’s why U.S. Treasury bills have such low returns, and why investing in small-cap companies and tech startups have such high expected returns.
More Than You Know: Finding Financial Wisdom in Unconventional Places (Updated and Expanded)
by
Michael J. Mauboussin
Published 1 Jan 2006
Much of the ink spilled on market prognostications is based on degrees of belief, with the resulting probabilities heavily colored by recent experience. Degrees of belief have a substantial emotional component. We can also approach the stock market from a propensity perspective. According to Jeremy Siegel’s Stocks for the Long Run, U.S. stocks have generated annual real returns just under 7 percent over the past 200 years, including many subperiods within that time.4 The question is whether there are properties that underlie the economy and profit growth that support this very consistent return result. We can also view the market from a frequency perspective.
…
The problem is that while we know that some companies will grow rapidly in the future, spurring upside revisions and attractive shareholder returns, we have no systematic way to identify those companies. Therein lies a great opportunity. EXHIBIT 27.4 Sales Growth CAGR Source: FactSet and author analysis. To demonstrate that growth is good but that it’s hard to take advantage of it, we turn to Jeremy Siegel’s excellent analysis of the Nifty Fifty in his investment classic Stocks for the Long Run.6 The Nifty Fifty were the leading growth stocks in the early 1970s and had high growth rate expectations and price/earnings (P/E) multiples in excess of forty. In the subsequent bear market of 1973-1974, these stocks as a group dropped sharply. Siegel asks a basic question: Were the Nifty Fifty overvalued in 1972 based on their subsequent total shareholder returns?
…
See http://www.thestreet.com/funds/mercerbullard/1282823.html. 5. Risky Business 1 Gerd Gigerenzer, Calculated Risks (New York: Simon & Schuster, 2002), 28-29. 2 John Rennie, “Editor’s Commentary: The Cold Odds Against Columbia,” Scientific American, February 7, 2003. 3 Gigerenzer, Calculated Risks, 26-28. 4 Jeremy J. Siegel, Stocks for the Long Run, 3rd ed. (New York: McGraw Hill, 2002), 13. 5 Michael J. Mauboussin and Kristen Bartholdson, “Long Strange Trip: Thoughts on Stock Market Returns,” Credit Suisse First Boston Equity Research, January 9, 2003. 6 See chapter 3. 6. Are You an Expert? 1 J. Scott Armstrong, “The Seer-Sucker Theory: The Value of Experts in Forecasting,” Technology Review 83 (June-July 1980): 16-24. 2 Atul Gawande, Complications: A Surgeon’s Notes on an Imperfect Science (New York: Picador, 2002), 35-37. 3 Paul J.
The Intelligent Asset Allocator: How to Build Your Portfolio to Maximize Returns and Minimize Risk
by
William J. Bernstein
Published 12 Oct 2000
In fact, there are data on the long-term returns and risks of these assets going back 200 years, albeit considerably less detailed and accurate; the inflation-adjusted returns and SD data are very similar to the 1926–1998 data. (For an excellent discussion of stock returns throughout the entire 200 years of U.S. history, see Jeremy Siegel’s Stocks for the Long Run.) Unfortunately, the 1926 –1998 database is confined to U.S. equities and high-quality bonds and is thus much too limited to be of real use to the modern investor, who has available a much wider variety of capital markets to choose from. There is great advantage to be gained from wide diversification among as many potential investment categories as possible.
…
Clearly, the redeemable bond would carry a considerably higher price and lower yield because it is immunized against the shock of a short-term increase in rates. And yet on the GH planet, where investors only care about long-term return, it would be priced identically to the conventional 30-year bond, since both have the same return to maturity. Even conceding GH’s point that investors are increasingly focused on stocks for the long run and will manage to push the Dow up past 36,000, one has to ask just how free of risk stocks would be at that point. The authors ignore a rather inconvenient fact: that recent market history has dramatic effects on DR. In 1928, just as today, everybody was a “long-term investor,” and the DR for stocks was quite low (although probably not as low as it is today).
…
Over the past several decades, global bond managers have made excess returns purchasing unhedged high-yielding bonds of developed nations with negative forward spreads,reaping advantage when the underlying currency fails to depreciate as much as forecast by the forward spread.This market inefficiency is probably the result of the fact that governments are major players in the currency game; governments are different from individual and institutional investors in that their primary goal is not profit, but rather currency defense. Lastly, hedging cost needs to be considered when evaluating historical data. As pointed out by Jeremy Siegel in Stocks for the Long Run, in 1910 the pound was worth $4.80. It has since fallen to one-third that value. One might think that hedging the currency would have increased one’s return from British stocks. Wrong. Since for almost all of that period British interest rates were higher than those in the United States, the hedging costs were considerable; you’d have been much better off not hedging.
Millionaire Teacher: The Nine Rules of Wealth You Should Have Learned in School
by
Andrew Hallam
Published 1 Nov 2011
And the longer your money is invested in the stock market, the lower the risk. We know that stock markets can fluctuate dramatically. They can even move sideways for many years. But over the past 90 years, the U.S. stock market has generated returns exceeding nine percent annually.3 This includes the crashes of 1929, 1973–1974, 1987, and 2008–2009. In Stocks for the Long Run, University of Pennsylvania’s Wharton School finance professor Jeremy Siegel suggests a dominant historical market, such as the U.S., isn’t the only source of impressive long-term returns. Despite the shrinking global importance of England, its stock market returns since 1926 have been very similar to that of the U.S.
…
Andrew Kilpatrick, Of Permanent Value, The Story of Warren Buffett (Birmingham, Alabama: Andy Kilpatrick Publishing Empire, 2006), 226. 3. The Value Line Investment Survey—A Long-Term Perspective Chart 1920–2005 and Morningstar Performance Tracking of DOW Jones ETF from 2005 to 2011. 4. Jeremy Siegel, Stocks for The Long Run, 3rd ed. (New York: McGraw-Hill, 2002), 18. RULE 3 Small Percentages Pack Big Punches In 1971, when the great boxer Muhammad Ali was still undefeated, U.S. basketball star Wilt Chamberlain suggested publicly that he stood a chance beating Ali in the boxing ring. Promoters scrambled to organize a fight that Ali considered a joke.
…
The next chapter will show you in detail how to achieve this in the simplest, possible way. Notes 1. John C. Bogle, The Little Book of Common Sense Investing (Hoboken, New Jersey: John Wiley & Sons, 2007), 51. 2. Ibid. 3. John C. Bogle, Common Sense on Mutual Funds (Hoboken, New Jersey: John Wiley & Sons, 2010), 28. 4. Jeremy Siegel, Stocks for the Long Run (New York: McGraw-Hill, 2002), 217–218. 5. Ken Fisher, The Only Three Questions That Count (Hoboken, New Jersey: John Wiley & Sons, 2007), 279. 6. Ibid. 7. “Coca-Cola Report,” The Value Line Investment Survey, November 9, 2001, 1551. 8. “Long Term Performance of Major Developed Equity Markets,” Management and Factset Research Systems, accessed April 15, 2011, http://www.fulcrumasset.com/files/Long%20Term%20Equity%20Performance.PDF. 9.
A Mathematician Plays the Stock Market
by
John Allen Paulos
Published 1 Jan 2003
If the stock does not pay dividends or if you plan on selling it and thereby realizing capital gains, its price should be roughly equal to the discounted value of the price you can reasonably expect to receive when you sell the stock plus the discounted value of any dividends. It’s probably safe to say that most stock prices are higher than this. During the 1990 boom years, investors were much more concerned with capital gains than they were with dividends. To reverse this trend, finance professor Jeremy Siegel, author of Stocks for the Long Run, and two of his colleagues recently proposed eliminating the corporate dividend tax and making dividends deductible. The bottom line of bottom-line investing is that you should pay for a stock an amount equal to (or no more than) the present value of all future gains from it. Although this sounds very hard-headed and far removed from psychological considerations, it is not.
…
Perhaps because of Monopoly, certainly because of WorldCom, and for many other reasons, the focus of this book has been the stock market, not the bond market (or real estate, commodities, and other worthy investments). Stocks are, of course, shares of ownership in a company, whereas bonds are loans to a company or government, and “everybody knows” that bonds are generally safer and less volatile than stocks, although the latter have a higher rate of return. In fact, as Jeremy Siegel reports in Stocks for the Long Run, the average annual rate of return for stocks between 1802 and 1997 was 8.4 percent; the rate on treasury bills over the same period was between 4 percent and 5 percent. (The rates that follow are before inflation. What’s needless to say, I hope, is that an 8 percent rate of return in a year of 15 percent inflation is much worse than a 4 percent return in a year of 3 percent inflation.)
…
Mandelbrot, Benoit, “A Multifractal Walk Down Wall Street,” Scientific American, February 1999. Paulos, John Allen, Once Upon a Number, New York, Basic Books, 1998. Ross, Sheldon, Probability, New York, Macmillan, 1976. Ross, Sheldon, Mathematical Finance, Cambridge, Cambridge University Press, 1999. Siegel, Jeremy J., Stocks for the Long Run, New York, McGraw-Hill, 1998. Shiller, Robert J., Irrational Exuberance, Princeton, Princeton University Press, 2000. Taleb, Nassim Nicholas, Fooled by Randomness, New York, Texere, 2001. Thaler, Richard, The Winner’s Curse, Princeton, Princeton University Press, 1992. Tversky, Amos, Daniel Kahneman, and Paul Slovic, Judgment Under Uncertainty: Heuristics and Biases, Cambridge, Cambridge University Press, 1982.
Pound Foolish: Exposing the Dark Side of the Personal Finance Industry
by
Helaine Olen
Published 27 Dec 2012
Working Paper for Center for Retirement Research at Boston College,” December 2009, http://crr.bc.edu/working-papers/will-automatic-enrollment-reduce-em; Emily Brandon, “How Automatic Enrollment Affects Your 401(k) Match,” US News & World Report, January 27, 2010,http://money.usnews.com/money/blogs/planning-to-retire/2010/01/27/how-401k-automatic-enrollment-affects-your-401k-match; Anne Tergesen, “401(k) Law Suppresses Saving for Retirement,” Wall Street Journal, July 7, 2011, http://online.wsj.com/article/SB10001424052702303365804576430153643522780.html The average annual return: Tom Lauricella, “Investors Hope the ’10s Beat the ’00s,” Wall Street Journal, December 20, 2009, http://online.wsj.com/article/SB10001424052748704786204574607993448916718.html. One of the books: Jeremy J. Siegel, Stocks for the Long Run: The Definitive Guide to Financial Market Returns and Long Term Investment Strategies (New York: McGraw-Hill, 1994); Speaking fees for Jeremy Siegel, All American Speakers bureau, http://www.allamericanspeakers.com/speakers/Jeremy-Siegel/3941. “We got lucky”: “Rethinking Stocks for the Long Run—Uncertainty Compounds with Time,” AdvisorAnalyst.com, August 15, 2011, http://advisoranalyst.com/glablog/2011/08/15/pastor-rethink-stocks-for-the-long-run-uncertainty-compounds-with-time/. a study of world stock markets: Barry Ritholtz, “Bonds Beat Stocks: 1981-2011,” The Big Picture, October 31, 2011, http://www.ritholtz.com/blog/2011/10/bonds-beat-stocks-1981-2011/; Buttonwood blog: “Buy, Hold, Regret,” The Economist, September 13, 2011, http://www.economist.com/node/21528907.
…
But more important, it turns out even the experts can’t agree on whether stocks are a good investment for the long haul. In other words, most of us are investing for retirement based on an unproven assumption. One of the books that set the stage for the stock market celebration that was the 1990s was Wharton professor Jeremy Siegel’s Stocks for the Long Run. Published in 1994, just as the market was about to undergo its epic run-up, the book found that beginning in the early nineteenth century there was no ten-year period in which bond returns had beaten out stock returns. Siegel’s book was immediately seized upon by everyone from the pundits to the financial services industry as proof that the stock market worked.
…
See also 401(k) plans; individual investors advertising targeting women, 160–61 average returns, 52, 93, 95 versus bond returns, 94, 95 bull market, 20–21 compounded interest, 96–97 crashes, 30, 90, 130, 157 doomsday scenarios, 138–43 investor expectations, 7–8, 21, 25, 82, 93–94 long-term investment, 93–97 New York Stock Exchange ads, 15–16, 160–61 optimistic forecasts, 10, 38, 83–84 Stocks for the Long Run (Siegel), 93–94 Struthers, Ric, 202 Stulen, Leo, 115 Sugrue, Thomas, 175 suitability standard, 105 Sylvia Porter’s Money Book (Porter), 17, 23 target-date funds, 89–93, 97 televised financial news. See CNBC Tessler, Bari, 221 Thakor, Manisha, 29, 159, 163 Thaler, Richard, 77, 88, 117, 199 therapy.
Unconventional Success: A Fundamental Approach to Personal Investment
by
David F. Swensen
Published 8 Aug 2005
Ibbotson Associates, Stocks, Bonds, Bills, and Inflation 2004 Yearbook (Chicago: Ibbotson Associates, 2003): 28. 2. Jeremy Siegel, Stocks for the Long Run (New York: McGraw Hill,2002): 6. 3. William N. Goetzmann and Philippe Jorion, “A Century of Global Stock Markets,” NBER Working Paper Series, Working Paper 5901 (National Bureau of Economic Research, 1997), 16. 4. Robert Arnott, “Dividends and the Three Dwarfs,” Financial Analysts Journal 59, no. 2, (2003): 4. 5. James K. Glassman and Kevin A. Hassett, Dow 36,000: The New Strategy for Profiting from the Coming Rise in the Stock Market (New York: Random House, 1999). 6. Siegel, Stocks for the Long Run, 210. 7. “Jack’s Booty,” editorial, Wall Street Journal, 10 September 2002. 8.
…
During the seventy-eight years of the Ibbotson series, as shown in Table 1.1, one dollar invested in large-company stocks expanded 2,285 times, while bonds produced a 61 multiple, and cash, an 18 multiple. Small stocks demonstrated even more impressive results, as the 1925 dollar multiplied 10,954 times by 2003. Equity ownership beats holding bonds or cash, hands down. Similar results can be found in Jeremy Siegel’s Stocks for the Long Run. The third edition of Siegel’s classic study of capital markets returns shows U.S. stocks producing an 8.3 percent per annum compound return over the two centuries spanning 1802 to 2001. In a hard-to-believe statistic, one dollar invested in the stock market at the outset of the nineteenth century, with all gains and dividends reinvested, grows to $8.8 million at the beginning of the twenty-first century!
…
In a hard-to-believe statistic, one dollar invested in the stock market at the outset of the nineteenth century, with all gains and dividends reinvested, grows to $8.8 million at the beginning of the twenty-first century! Table 1.1 Equity Ownership Drives Long-Term Returns Sources: Ibbotson Associates. Stocks, Bonds, Bills, and Inflation 2004 Yearbook (Chicago: Ibbotson Associates, 2004); Jeremy Siegel, Stocks for the Long Run (New York: McGraw Hill, 2002). Bonds generate less spectacular results. The compound annual return for long-term government bonds of 4.9 percent per annum proves sufficient to cause one dollar to produce a portfolio worth $14,000 after a two-century holding period. Predictably, bills bring up the rear.
Just Keep Buying: Proven Ways to Save Money and Build Your Wealth
by
Nick Maggiulli
Published 15 May 2022
Stocks If I had to pick one asset class to rule them all, stocks would definitely be it. Stocks, which represent ownership (i.e., equity) in a business, are great because they are one of the most reliable ways to create wealth over the long run. Why You Should/Shouldn’t Invest in Stocks As Jeremy Seigel stated in Stocks for the Long Run, “The real return on [U.S.] equities has averaged 6.8 percent per year over the last 204 years.”⁶⁴ Of course, the U.S. has been one of the best performing equity markets over the past few centuries. However, the data suggests that many other global equity markets have provided positive inflation-adjusted returns (aka real returns) over time as well.
…
Remember that two people can have very different investment strategies and they can both be right. Now that we have talked about what you should invest in, we will spend some time discussing why you shouldn’t invest in individual stocks. * * * 63 Colberg, Fran, “The Making of a Champion,” Black Belt (April 1975). 64 Seigel, Jeremy J., Stocks for the Long Run (New York, NY: McGraw-Hill, 2020). 65 Dimson, Elroy, Paul Marsh, and Mike Staunton, Triumph of the Optimists: 101 Years of Global Investment Returns (Princeton, NJ: Princeton University Press, 2009). 66 Biggs, Barton, Wealth, War and Wisdom (Oxford: John Wiley & Sons, 2009). 67 U.S.
…
I can only hope that it provides you with the mental fortitude to just keep buying the next time there’s blood in the streets. Now that we have spent time reviewing how to buy assets, even during the darkest of times, we turn out attention to an even more difficult question—when should you sell? * * * 93 Anarkulova, Aizhan, Scott Cederburg, and Michael S. O'Doherty, “Stocks for the Long Run? Evidence from a Broad Sample of Developed Markets,” ssrn.com (May 6, 2020). 18. When Should You Sell? On rebalancing, concentrated positions, and the purpose of investing D espite our investing philosophy to Just Keep Buying, there will inevitably come a point in your investment journey when you will need to sell.
Understanding Asset Allocation: An Intuitive Approach to Maximizing Your Portfolio
by
Victor A. Canto
Published 2 Jan 2005
More important, the data also suggest the greater risk-reduction in the T-bond portfolio cannot be large enough to offset the portfolio’s lower returns. The Sharpe ratio of the T-bond portfolio is 0.35 versus 0.53 for the equity portfolio. This result should not be surprising, given Jeremy Siegel’s popular book, Stocks for the Long Run, in which he basically confirms that equities far outperform T-bonds over the long haul.7 Looking, however, at the various stocks and Tbonds combinations, it appears a mixture provides a higher return-to-risk ratio. A portfolio consisting of 60 percent equities and 40 percent T-bonds yields the highest Sharpe ratio.
…
Journal of Finance 19 (1964): 425–42. ———. “The Sharpe Ratio.” Journal of Portfolio Management (Fall 1994): 49–58. Bibliography 299 Shilling, A. Gary. “Market Timing: Better than a Buy-and-Hold Strategy.” Financial Analysts Journal 48, No. 2 (March/April 1992): 46–50. Siegel, Jeremy J. Stocks for the Long Run, Second Edition. McGraw-Hill, 1998. Siegel, Laurence. “Distinguishing True Alpha from Beta.” CFA Institute Conference Proceedings—Points of Inflection: New Directions for Portfolio Management (February 2004). Sinquefield, Rex A. “Active Versus Passive Management.” Schwab Institutional Conference in San Francisco (October 12, 1995).
…
See strategic asset allocation sample period length of, 285n reasons for choosing, 284n sample-selection bias, 27, 30, 40 Samuelson, Paul, 211 Savings and Loan (S&L) crisis, 76 self-reporting bias, 228 Sharpe ratio, 2-3, 21 for benchmark portfolio, 114 for equal- and cap-weighted portfolios, 179 location portfolios, 61-63 location-based asset allocation, 35 size-based asset allocation, 32, 123 style-based asset allocation, 28, 121 T-bond/equity portfolios, 38, 119 Sharpe, William, 57 Siegel, Jeremy (Stocks for the Long Run), 25 single asset buy-and-hold, 12-13 Sinquefield, Rex A., 164-165, 169 size cycles, 54-55 active versus passive management during, 170-172, 175, 271-272 combining active and passive management, 180-182 equal-weighted versus cap-weighted indexes, 175-180 hedge funds and, 235-239 market breadth and, 168-170, 237-238 in value-timing strategy, 243-250 size-based asset allocation cyclical asset allocation and, 31-32, 123 optimal mixes, 23-24 small-cap stocks active management tested against passive management, 166-168 annual returns, 19 elasticity, 184, 187-189 location effect and, 193-198, 202-204, 213, 273-274 optimal mix with large-cap stocks, 23-24, 31-32, 123 performance of, 16, 41 regulatory fixed costs, 184-185 risk measurement, 20 size cycles, 54-55 active versus passive management during, 170-172, 175, 271-272 Index 313 equal-weighted versus cap-weighted indexes, 175-180 and market breadth, 168-170, 237-238 in value-timing strategy, 243-250 Smith, Adam, 169 stagflation, 99 Standards and Poor (S&P), 77 stock indices, constructing, xx-xxi, 272-273 Stocks for the Long Run (Siegel), 25 strategic asset allocation (SAA), xx, 13 active versus passive management, 252-255 as benchmark, 104 historical allocations, 104-108, 113-115 lifecycle allocations, 115-116 market allocations, 108-115, 266-269 cyclical asset allocation (CAA) versus, 59-65, 141-142 optimal mixes, 21-26 style cycles, 55-57 style differences, value versus growth stocks, 272-273 style-based asset allocation, 18 cyclical asset allocation and, 26-30, 121 optimal mixes, 22-23 supply shifts, 217-224 supply-and-demand analysis.
The Myth of the Rational Market: A History of Risk, Reward, and Delusion on Wall Street
by
Justin Fox
Published 29 May 2009
Haugen, and Lemma W. Senbet, Agency Problems and Financial Contracting (Englewood Cliffs, N.J.: Prentice-Hall, 1985). 11. Andrei Shleifer and Robert W. Vishny, “The Limits of Arbitrage,” Journal of Finance (March 1997): 37. 12. Jeremy J. Siegel, Stocks for the Long Run, 2nd ed. (New York: McGraw-Hill, 1998), 45. 13. Pablo Galarza, “It’s Still Stocks for the Long Run,” Money, Dec. 2004. 14. Robert J. Shiller, “Price-Earnings Ratios as Forecasters of Returns: The Stock Market Outlook in 1996,” paper posted on Shiller’s Web site, July 21, 1996, www.econ.yale.edu/%7Eshiller/data/peratio.html. The original paper was John Y.
…
That was a fundamentals-based recipe for higher stock prices, but it coexisted with and was hard to separate from a dramatic change in public attitudes about the stock market evinced by that belief in buying on the dips. Roger Ibbotson’s data yearbooks and historical charts were a factor in the attitude shift. So was an acclaimed 1994 book by Wharton School finance professor Jeremy Siegel, Stocks for the Long Run. Siegel’s book was yet another in the long line of stock vs. bond comparisons begun in 1924 by Edgar Lawrence Smith and continued most recently by Ibbotson and Sinquefield. The main new twist was that Siegel extended his data all the way back to 1802. He also did not ignore the disconcerting parallels to Smith, and to Irving Fisher.
…
See also S&P 500 standard deviation, 6 Standard Oil, 15 Standard Statistics Co., 15, 16–17, 19, 38, 116 Stanford Business School, 135 Stanford Center for Advanced Study in Behavioral Sciences, 106–7 State Street Global, 112, 143 Statistical Research Group, 47–48, 52 Statman, Meir, 186–87, 200, 359n. 25 Stern, Joel, 163–64, 222, 270 Stigler, George, 90, 92, 95, 159, 182 Stiglitz, Joseph, 181, 196, 202, 207, 288, 328 Stocks for the Long Run (Siegel), 256 Strong, Benjamin, 20, 24 The Structure of Scientific Revolutions (Kuhn), 107, 203 Stulz, René, 251–52 subprime lending, 313–15 subsidies, 194 Summers, Lawrence, 328 and Black, 200 and the efficient market hypothesis, 203 and Fama, 207 and market crashes, 232 and the National Bureau of Economic Research, 183 and overvaluations, 269–70 and political appointments, 252 and Samuelson, 198, 358n. 19 and the Santa Fe conference, 302 and Shiller, 198–99 and Shleifer, 248, 250–51, 363n. 4 Sumner, William Graham, 9, 10, 12, 31, 93 Sun Life Canada, 27 Sunstein, Cass, 295 superior intrinsic-value analysis, 97 supply-demand graphs, 30 Surowiecki, James, 307 Taleb, Nassim Nicholas, 239 taxes, 244, 274–77, 280 tech bubble, 261–62 Technical Analysis of Stock Trends (Edwards and Magee), 68 technological advance, 120, 258.
A Man for All Markets
by
Edward O. Thorp
Published 15 Nov 2016
Appendix B * * * HISTORICAL RETURNS Table 10: Historical Returns on Asset Classes, 1926–2013 Series Compound Annual Return* Average Annual Return** Standard Deviation Real (after inflation) Compound Annual Return* Sharpe Ratio† Large Company Stocks 10.1% 12.1% 20.2% 6.9% 0.43 Small Company Stocks 12.3% 16.9% 32.3% 9.1% 0.41 Long-Term Corporate Bonds 6.0% 6.3% 8.4% 2.9% 0.33 Long-Term Government Bonds 5.5% 5.9% 9.8% 2.4% 0.24 Intermediate-Term Government Bonds 5.3% 5.4% 5.7% 2.3% 0.33 US Treasury Bills 3.5% 3.5% 3.1% 0.5% ——— Inflation 3.0% 3.0% 4.1% ——— ——— * Geometric Mean ** Arithmetic Mean † Arithmetic From: Ibbotson, Stocks, Bonds, Bills and Inflation, Yearbook, Morningstar, 2014. Siegal’s Stocks for the Long Run gives US returns from 1801. Dimson et al. give returns for sixteen countries and an analysis. The return series depends on the time period and on the specific index chosen. I’ve used Ibbotson as my standard because detailed annually updated statistics have been readily available. Table 11: Historical Returns (%) to Investors, 1926–2013 * Geometric Mean From: Ibbotson, Stocks, Bonds, Bills and Inflation, Yearbook, Morningstar, 2014. Siegal’s Stocks for the Long Run gives US returns from 1801. Dimson et al. give returns for sixteen countries and an analysis.
…
Table 12: Schedule of Assumed Costs Which Reduce Historical Returns (%) Stocks Bonds Bills Passive Active Passive Active Passive Active Management Costs 0.2 1.2 0.2 0.7 0.2 0.7 Trading Costs 0.2 1.2 0.1 0.3 0.1 0.1 Estimated Tax Rate on Remainder 20.0 35.0 35.0 35.0 35.0 35.0 Table 13: Annual Returns (%), 1972–2013 Compound Annual Return* Average Annual Return** Standard Deviation Equity REITs 11.9 13.5 18.4 Large Company Stocks 10.5 12.1 18.0 Small Company Stocks 13.7 16.1 23.2 Long-Term Corporate Bonds 8.4 8.9 10.3 Long-Term Government Bonds 8.2 8.9 12.4 Intermediate-Term Government Bonds 7.5 7.7 6.6 US Treasury Bills 5.2 5.2 3.4 Inflation 4.2 4.3 3.1 * Geometric Mean ** Arithmetic Mean Comparative historical returns from investing in income-generating real estate are indicated in table 13, which lists total returns from publicly traded Real Estate Investment Trusts for the period 1972–2013. From: Ibbotson, Stocks, Bonds, Bills and Inflation, Yearbook, Morningstar, 2014. Siegal’s Stocks for the Long Run gives US returns from 1801. Dimson et al. give returns for sixteen countries and an analysis. The return series depends on the time period and on the specific index chosen. Appendix C * * * THE RULE OF 72 AND MORE The rule of 72 gives quick approximate answers to compound interest and compound growth problems.
…
Fortune’s Formula: The Untold Story of the Scientific Betting System That Beat the Casinos and Wall Street. New York: Hill and Wang, 2005. Schroeder, Alice. The Snowball: Warren Buffett and the Business of Life. New York: Bantam, 2008. Segel, Joel. Recountings: Conversations with MIT Mathematicians. Wellesley, MA: A K Peters/CRC Press, 2009. Siegel, Jeremy J. Stocks for the Long Run: The Definitive Guide to Financial Market Returns and Long-Term Investment Strategies. New York: McGraw-Hill, 2008. Taleb, Nassim Nicholas. The Black Swan: The Impact of the Highly Improbable. New York: Random House, 2007. ———. Fooled by Randomness: The Hidden Role of Chance in Life and in the Markets.
Toward Rational Exuberance: The Evolution of the Modern Stock Market
by
B. Mark Smith
Published 1 Jan 2001
If the economy does not have an inflationary binge, they warn, many of today’s stocks are much too high.” The editor of the Financial Analysts Journal stated the matter much more succinctly, observing that “some financial analysts called [the reversal of the traditional stock-bond yield relationship] a financial revolution …” Dividend and Nominal Bond Yields, 1871-1996 From Stocks for the Long Run (1994) by J. Siegel. Reprinted with the permission of The McGraw-Hill Companies. But the stock market continued to gain ground even after the “great yield reversal” occurred. In fact, stock dividends would never again rise above long-term government bond interest rates. Fears of inflation were not only pushing investors to buy stocks but were also causing bond buyers to demand higher yields.
…
It won’t go on forever. It may go too far, but never forever.”12 Were the Nifty Fifty really overpriced in late 1972, or was the “conventional wisdom” wrong again, as it had been after the 1929 crash? An interesting insight is provided by Wharton professor Jeremy Siegel in his 1999 book, Stocks for the Long Run. Siegel studies the performance of a representative list of Nifty Fifty stocks over the 25-year period following the December 1972 market peak, and concludes that on a risk-adjusted basis the returns of the group roughly matched the market return over that period as measured by the Standard & Poor’s Industrials.
…
RETURN OF THE BULL 1 Peter Bernstein, Capital Ideas, p. 69. 2 Hayne Leland, Journal of Finance 35 (2), May 1980. 3 Peter Lynch, One Up on Wall Street (New York: Simon & Schuster, 1989), p. 34. 4 Ibid., p. 35. 5 Ibid., p. 34. 6 Ibid., p. 13. 7 Ibid., p. 19. 8 Ibid., p. 44. 9 Jeremy Siegel, Stocks for the Long Run (New York: McGraw-Hill, 1998), p. 277. 10 Lynch, p. 36. 11 Bernstein, Against the Gods, p. 299. 12 Burton Malkiel, A Random Walk Down Wall Street, p. 377. 13 Mark Stevens, The Insiders (New York: G. P. Putnam’s Sons, 1987), p. 56. 14 Ibid. 15 Ibid., p. 14. 16 James Stewart, Den of Thieves (New York: Simon & Schuster, 1992), p. 345. 17 Ibid., p. 347. 18 Ibid., p. 340. 15.
A Random Walk Down Wall Street: The Time-Tested Strategy for Successful Investing (Eleventh Edition)
by
Burton G. Malkiel
Published 5 Jan 2015
Jeremy Siegel, author of the excellent investing book Stocks for the Long Run, has calculated the returns from a variety of financial assets from 1800 to 2014. His work shows the incredible power of compounding. One dollar invested in stocks in 1802 would have grown to almost $18 million by the end of 2013. This amount far outdistanced the rate of inflation as measured by the consumer price index (CPI). The figure below also shows the much more modest returns that have been achieved by U.S. Treasury bills and gold. Source: Siegel, Stocks for the Long Run, 5th ed. If you want a get-rich-quick investment strategy, this is not the book for you.
…
“growth” and, 261–62, 273, 274–75, 283 volatility and, 262, 265–70, 276 Smith, Adam, 239 “Smith, Adam,” 109, 155 Social Security, 372 Sony, 69 Soros, George, 284 South Sea Bubble, 36, 41–47, 67, 84 South Sea Bubble, The (Carswell), 42 South Sea Company, 41–47 Space-Tone, 58 SPDRs (Spiders), 281, 391 speculation, 37–78 behavioral finance, 234 investment vs., 28 in Japanese real estate, 76–78 in Japanese stock market, 76–78 Spitzer, Eliot, 89, 172 stagflation, 192 Standard and Poor’s 500-Stock Index, 66, 153, 175, 180, 204–7, 222, 270, 273, 340, 344, 352, 380–82, 385–86 beta of, 210–11 bond ratings by, 318 index funds and, 193–94, 381, 391 vs. performance of Morgan Stanley EAFE, 202–4 vs. performance of mutual funds, 179, 181 standard deviation, 191, 192–94, 212 start-ups, Internet, 84–87 State Street Global Advisors, 381 state taxes, 305 Statman, Meir, 229 status quo bias, 247 Stein, Jeremy, 242, 253 Stengel, Casey, 169 Stern, Howard, 92 Stigler, George J., 209 Stiglitz, Joseph, 287 stock charts, 110–18, 136, 154 bear traps in, 114 channels in, 113 construction of, 111–13, 118, 138–39 head-and-shoulders formation in, 113–14, 139, 144 information obtained from, 110–15 inverted bowl formation in, 111 pennant formation in, 111 as produced from coin tossings, 138–39 trends revealed by, 112–15, 134–41, 144–45 stock market: in 1980s, 341–43 call options in, 39 efficiency of, see random-walk theory emerging markets vs., 204–8 hot streaks in, 235–36 Japanese, boom and bust in, 76–78 Japanese, collapse and correction of (1992), 77 language of, 134 momentum in, 136–37, 161, 266–68 P/E crash in (1970s), 341, 343 rationality of, 229–32 reversion to mean in, 266–68 total, 222, 386, 387, 410 underlying rationality of, 128, 359 see also NASDAQ; New York Stock Exchange stock-market crash (1929–32), 52–54, 57 stock-market crash (1987), 125, 196 hemline indicator and, 147–48 stock market gurus and, 152–53 stock-market crash (2000s), 25, 97–104, 307, 364 stock-market returns, 150 stock options, managers and, 332 stock prices: behavior of, 266 predictability of, 237–38 stocks, 359–61, 376–77 “big capitalization,” 68–69 blue-chip, see blue-chip stocks bonds vs., 125, 208, 354–55 claim represented by, 339 common, see common stocks concept, see concept stocks future of, 345–48 high-beta, 223 holding period of, 350, 352–55 of Internet companies, see Internet low-beta, 223 “one-decision,” 69 price-to-book value ratios of, 264 projecting returns for individual, 347–48 return on, 344–46, 351, 353 return on, in 1980s, 341, 342 small, 310 Stocks for the Long Run (Siegel), 292 stock valuation: assessing levels of, 329–36 dividend payout and, 123, 126 from 1960s into 1990s, 56–79 future expectations and, 31–33 in historical perspective, 35–36, 37–55, 329 Internet bubble and, 81–83, 89–90 price-dividend multiples in, 330–32, 341, 344 theories of, 30–33, 394 variability and, 129 stop-loss order, 142 structured investment vehicles (SIVs), 100 Stuff Your Face, Inc., 70 Substitute-Player Step, 379, 398–400 Sullivan, Arthur, 134 Sunbeam, 167 Super Bowl indicator, 148 support area, 116, 142 support levels, 116 SwapIt.com, 85 Swedroe, Larry, 235–36 swings, 210–11 synergism, 60–66 systematic risk, 211–15 beta as a measure of, see beta defined, 210–11 non-beta elements of, 224–26 takeovers, 25 TAO, 398 taxes, 255, 256, 311–13, 367 and annuities, 375 avoidance of, 300–305 capital gains, 158, 246, 331, 382–83 estate, 305 gift, 305 income, 158, 292, 298, 300, 311–13, 317–18, 320, 339, 365n, 378 overtrading and, 255 property, 314 retirement plans and, 293, 300–304 state, 305 technical analysis, 26, 110–33, 134–58, 408 buy-and-hold strategy compared to, 140, 143, 158 castle-in-the-air theory and, 110, 132–33, 134 defined, 110 fundamental analysis used with, 130–33 fundamental analysis vs., 110–11, 118–19 gurus, 151–54 implications for investors of, 158 limitations of, 116–17, 135–36, 154–58, 160 random-walk theory and, 137–41, 154–57 rationale for, 115–16 types of systems of, 141–51 see also chartists; stock charts Technical Analysis of Stock Trends (Magee), 113, 144 telecom companies, 90, 95 Teledyne, Inc., 64 Telegraph, 173 television, Internet bubble and, 92 term4sale.com, 296 term bonds, 317 Texas Instruments, 57 Thaler, Richard, 247–48 theGlobe.com, 86 Theory of Investment Value, The (Williams), 31 Thorp, Edward O., 156n 3Com, 83 Time, 97 timing penalty, 242–43, 254, 255 Total Bond Market index funds, 386 total capitalization, 261, 271, 265 Total Stock Market Portfolio, 261, 386, 387, 391, 410 Total World index funds, 391 trading, limiting of, 395–98 tranches, 99 Treasury, U.S., 316, 319, 344–45, 352, 353 Treasury bills, 152, 293, 298, 299 rate of return on, 194–96, 351 treasurydirect.gov, 300 Treasury inflation-protection securities (TIPS), 306, 308, 316, 319–20, 386 trends, 113–15, 144–45 perpetuation of, 115 Tri-Continental Corporation, 54 “tronics” boom, see new issues, of 1959–62 T.
Evidence-Based Technical Analysis: Applying the Scientific Method and Statistical Inference to Trading Signals
by
David Aronson
Published 1 Nov 2006
Evidence of Illusory Trends in Sports Financial markets are not the only arena in which observers are plagued by the illusion of order. Many sports fans and athletes believe in performance trends, periods of hot and cold performance. What baseball fan or 85 The Illusory Validity of Subjective Technical Analysis X X X X FIGURE 2.18 Real and randomly generated stock charts. Siegel, Jeremy J., Stocks for the Long Run, 3rd Edition, Copyright 2002, 1998, 1994, McGraw-Hill; the material is reproduced with the permission of The McGrawHill Companies. player does not think batting slumps or hitting streaks are real? Basketball fans, players, coaches, and sports commentators speak of the so-called hot hand, a trend of above-average shooting accuracy.
…
Outside of academia, there has been a move to greater emphasis on objective methods of TA, but often the results are not evaluated in a statistically rigorous manner. 17. F.D. Arditti, “Can Analysts Distinguish Between Real and Randomly Generated Stock Prices?,” Financial Analysts Journal 34, no. 6 (November/ December 1978), 70. 18. J.J. Siegel, Stocks for the Long Run, 2nd ed. (New York: McGraw-Hill, 1998), 243. 19. G.R. Jensen, R.R. Johnson, and J.M. Mercer, “Tactical Asset Allocation and Commodity Futures: Ways to Improve Performance,” Journal of Portfolio Management 28, no. 4 (Summer 2002). 20. C.R. Lightner, “A Rationale for Managed Futures,” Technical Analysis of Stocks & Commodities (2003).
…
Arditti, “Can Analysts Distinguish Between Real and Randomly Generated Stock Prices?,” Financial Analysts Journal 34, no. 6 (November/ December 1978), 70. An informal test of the same nature is discussed by Notes 9. 10. 11. 12. 13. 14. 15. 16. 17. 18. 19. 20. 21. 22. 23. 24. 25. 26. 481 J.J. Siegel, Stocks for the Long Run, 3rd ed. (New York: McGraw-Hill, 2002), 286. Gilovich, How We Know. Shermer, M., Why People Believe Weird Things: Pseudoscience, Superstition, and Other Confusions of Our Time (New York: W.H. Freeman, 1997). Gilovich, How We Know. Ibid., 10. H.A. Simon, “Invariants of Human Behavior,” Annual Review of Psychology 41 (January 1990), 1–20.
The Long Good Buy: Analysing Cycles in Markets
by
Peter Oppenheimer
Published 3 May 2020
Starting with very-long-run data series, and using the US – the world's biggest stock market – as an example, the total return for US equities since 1860 has averaged about 10%, over anything from a 1-year to a 20-year time horizon, as shown in exhibit 2.1. For 10-year US government bonds, often viewed as a ‘risk-free’ asset (because the debt is backed by a government that does not default on its debt), returns have averaged between 5% and 6% over the same holding periods. In his famous book Stocks for the Long Run, Jeremy J. Siegel (1994) argued that real returns (nominal returns adjusted for inflation) in equities had been remarkably stable over many different periods and different economic regimes: ‘over all major sub periods: 7.0 percent per year from 1802 through 1870, 6.6 percent from 1871 through 1925, and 7.2 percent per year since 1926’.
…
NBER Working Paper No. 456 [online]. Available at https://www.nber.org/papers/w0456 Shiller, R. J. (2000). Irrational exuberance. Princeton, NJ: Princeton University Press. Shiller, R. J. (2003). From efficient markets theory to behavioral finance. Journal of Economic Perspectives, 17(1), 83–104. Siegel, J. (1994). Stocks for the long run (2nd ed.). New York, NY: Irwin. Siegel, J. (1998). Valuing growth stocks: Revisiting the nifty fifty. The American Association of Individual Investors Journal [online]. Available at https://www.aaii.com/journal/article/valuing-growth-stocks-revisiting-the-nifty-fifty SINTEF. (2013). Big data, for better or worse: 90% of world's data generated over last two years.
The Behavioral Investor
by
Daniel Crosby
Published 15 Feb 2018
Of stories and stocks The flipside to the “If I’d just bought Apple when it IPO’d” narrative is that buying individual stocks is, in isolation, a truly risky endeavor. According to JP Morgan, 40% of stocks have suffered “catastrophic losses” since 1980, meaning that they fell by 70% or more! But what happens when we pool those risky individual names into a diversified portfolio? Jeremy Siegel found in Stocks for the Long Run that in every rolling 30-year period from the late 1800s to 1992, stocks outperformed both bonds and cash. In rolling ten-year periods, stocks beat cash over 80% of the time and there was never a rolling 20-year period in which stocks lost money. Bonds and cash, considered safe by most measures of risk, actually failed to keep up with inflation most of that time.
…
The most commonly used of these is some variant of a 200-day moving average, where an asset class is held as long as it is above the 200-day average of its price and sold when it dips below. Much like momentum in physics, the theory with price momentum is that both strength and weakness will persist. Jeremy Siegel applied this approach to both the Dow Jones Industrial Average (DJIA) and NASDAQ in his classic, Stocks for the Long Run. Siegel’s test bought the index when it closed at least 1% above the 200-day moving average and moved to Treasury bills when it closed at least 1% below. Using this simple, mechanical strategy, Siegel notes modest outperformance when applied to the DJIA and a healthy 4% per annum outperformance when tested on the NASDAQ from 1972 to 2006.
The Intelligent Investor (Collins Business Essentials)
by
Benjamin Graham
and
Jason Zweig
Published 1 Jan 1949
The heart of Graham’s argument is that the intelligent investor must never forecast the future exclusively by extrapolating the past. Unfortunately, that’s exactly the mistake that one pundit after another made in the 1990s. A stream of bullish books followed Wharton finance professor Jeremy Siegel’s Stocks for the Long Run (1994)—culminating, in a wild crescendo, with James Glassman and Kevin Hassett’s Dow 36,000, David Elias’ Dow 40,000, and Charles Kadlec’s Dow 100,000 (all published in 1999). Forecasters argued that stocks had returned an annual average of 7% after inflation ever since 1802. Therefore, they concluded, that’s what investors should expect in the future.
…
Jobs’ option grant and share ownership are adjusted for a two-for-one share split. * By the late 1990s, this advice—which can be appropriate for a foundation or endowment with an infinitely long investment horizon—had spread to individual investors, whose life spans are finite. In the 1994 edition of his influential book, Stocks for the Long Run, finance professor Jeremy Siegel of the Wharton School recommended that “risk-taking” investors should buy on margin, borrowing more than a third of their net worth to sink 135% of their assets into stocks. Even government officials got in on the act: In February 1999, the Honorable Richard Dixon, state treasurer of Maryland, told the audience at an investment conference: “It doesn’t make any sense for anyone to have any money in a bond fund
…
As Graham hints on p. 65, even the stock indexes between 1871 and the 1920s suffer from survivorship bias, thanks to the hundreds of automobile, aviation, and radio companies that went bust without a trace. These returns, too, are probably overstated by one to two percentage points. 2 Those cheaper stock prices do not mean, of course, that investors’ expectation of a 7% stock return will be realized. 3 See Jeremy Siegel, Stocks for the Long Run (McGraw-Hill, 2002), p. 94, and Robert Arnott and William Bernstein, “The Two Percent Dilution,” working paper, July, 2002. * See Graham’s “Conclusion” to Chapter 2, p. 56–57. * Graham’s objection to high-yield bonds is mitigated today by the widespread availability of mutual funds that spread the risk and do the research of owning “junk bonds.”
Triumph of the Optimists: 101 Years of Global Investment Returns
by
Elroy Dimson
,
Paul Marsh
and
Mike Staunton
Published 3 Feb 2002
They explain: “We cannot know with certainty what the true value of s actually is, but we know that it cannot lie too far from our best estimate of 6¾ percent… Why s is, or appears to be, so stable is an important challenge.” Siegel’s constant is cited more frequently in Smithers and Wright’s index than any other word, phrase, or author. In his foreword to Siegel’s (1998) book, Stocks for the Long Run, Peter Bernstein writes: “The most powerful part of Professor Siegel’s argument is how effectively he demonstrates the consistency of results from equity ownership when measured over periods of 20 years or longer.” After noting that even Germany and Japan bounced back after the Second World War, Bernstein continues: “Indeed, he would be on frail ground if that consistency were not so visible in the historical data and if it did not keep reappearing in so many different guises.”
…
Given the 0.9 percent annualized real return on US treasury bills reported in chapter 5, this premium is consistent with Siegel’s “constant” of s = 6¾ percent. Second, for all investment holding periods of around twenty years or more, equity premia have been positive or within a fraction of a percentage point of zero. Allowing for the 0.9 percent real return on bills, Figure 14-1 confirms Siegel’s (1998) observation of the superiority of stocks for the long run, where the “long run” is defined as twenty years or more. To what extent should we rely on such patterns persisting into the future? As we said earlier, one of the critical factors that influences these results is sampling error. Sampling error arises because we observe only a limited number of historical outcomes.
…
Journal of Portfolio Management 21(1): 49–58 Shiller, R.J., 1981, Do stock prices move too much to be justified by subsequent changes in dividends? American Economic Review 71: 421–35 Shiller, R.J., 2000, Irrational Exuberance. NJ: Princeton University Press Shleifer, A., 2000, Inefficient Markets. Oxford UK: Oxford University Press Siegel, J.J., 1998, Stocks for the Long Run, second edition. NY: McGraw Hill Siegel, J.J., 1999, The shrinking equity premium. Journal of Portfolio Management 26(1): 10– 17 Siegel, J.J., and R. Thaler, 1997, The equity premium puzzle. Journal of Economic Perspectives 11: 191–200 Siegel, L.B., and Montgomery, D., 1995, Stocks, bonds, and bills after taxes and inflation.
Financial Freedom: A Proven Path to All the Money You Will Ever Need
by
Grant Sabatier
Published 5 Feb 2019
If you hold them for longer than a year before you sell them, then you will get taxed at the capital gains rate (see the table above), which is typically lower than your income tax rate. A quick note on selling versus withdrawing: In a taxable account, you get taxed when you sell even if you don’t withdraw the money, but in a tax-advantaged account, you get taxed only after you sell and withdraw. Yet another reason why you should be holding stocks for the long term: If you can keep your taxable income below $75,900 if you are married or $37,950 if you are single, then you won’t pay any tax on your investment withdrawals from your taxable accounts. No taxes. This is one of the massive benefits of keeping your income low (or at least mastering your tax deductions).
…
As you’ve already learned, because of the 1031 exchange rule, you can keep rolling over your profits tax-free by using them to buy new properties. Or you can flip your way into larger and larger homes so you can buy your dream home. You can also flip your way into buying a multi-unit property or apartment building that you can then hold and rent out. Just like buying and holding stock for the long term, buying and holding real estate is a more effective strategy than flipping to help you reach financial independence faster, since you can build up a portfolio that generates consistent monthly cash flow through rental income that can cover your mortgage debt and monthly expenses, as well as have a portfolio of assets that will also appreciate over time.
The New Science of Asset Allocation: Risk Management in a Multi-Asset World
by
Thomas Schneeweis
,
Garry B. Crowder
and
Hossein Kazemi
Published 8 Mar 2010
Moreover, recent academic research has shown that individuals’ tolerance for risk increases as their wealth increases and as they become more familiar with Asset Classes: What They Are and Where to Put Them 3. 4. 5. 6. 7. 8. 9. 10. 89 a particular asset class. The increasing amount of education on the benefits of alternative investments as well as the increase in personal wealth in recent years further supports the inclusion of alternative investments in investors’ portfolios. The classic example is Stocks for the Long Run (Siegel 2008), which was popular during the run-up for the stock market. For a review of the return and risk benefits of a wide range of alternative investments, see www.ingarm.org. At this site a series of papers on the Benefits of Hedge Funds, Managed Futures, Private Equity, Real Estate, and Commodities exists that summarizes the return and risk benefits of a range of alternative investment classes.
…
Journal of Finance 19, Issue 3 (September 1964): 425–442. Sharpe, W.F. “Mutual Fund Performance.” Journal of Business 39, No. S1 (January 1966): 119–138. Sharpe, W.F. “Asset Allocation: Management Style and Performance Measurement.” The Journal of Portfolio Management 18, No. 2 (Winter 1992): 7–19. Siegel, J.J. Stocks for the Long Run: The Definitive Guide to Financial Market Returns and Long-Term Investment Strategies, 4th ed. New York: McGrawHill, 2008. Szado, E., and T. Schneeweis. “Loosening the Collar.” CISDM Working Paper, 2009. Taleb, N. The Black Swan. New York: Random House, 2007. Tobin, James. “Liquidity Preference as Behavior Toward Risk.”
Beyond Diversification: What Every Investor Needs to Know About Asset Allocation
by
Sebastien Page
Published 4 Nov 2020
With apologies for my overuse of the tide analogy, my point is that bear (or even just weak) financial markets are harder to navigate for unskilled investors and can make life difficult for plan sponsors, financial advisors, and individual investors. In the next chapter, we’ll review methodologies to forecast returns based on valuations. For now, let us focus on the simplest of models. Jeremy Siegel, Wharton professor and author of Stocks for the Long Run (Siegel, 2002), often uses the inverse of the P/E ratio as a back-of-the-envelope forecast of real return for stocks. If we assume a P/E of 20, which is a number Siegel has quoted recently,5 expected real return for equities should be 5% (1/20). For inflation, we can use a market-implied or “breakeven” estimate, as measured by the difference between the yield of a nominal bond and an inflation-linked bond.
…
“Capital Asset Prices: A Theory of Market Equilibrium Under Conditions of Risk,” Journal of Finance, vol. 19, no. 3, pp. 425–442. Sharpe, William F. September/October 2007. “Expected Utility Asset Allocation,” Financial Analysts Journal, vol. 63, no. 5, pp. 18–30. Siegel, Jeremy J. 2002. Stocks for the Long Run (3rd ed.). New York: McGraw-Hill. Siegel, Jeremy J. 2016. “The Shiller CAPE Ratio: A New Look,” Financial Analysts Journal, vol. 72, no. 3, pp. 41–50. Stafford, Erik. May 2017. “Replicating Private Equity with Value Investing, Homemade Leverage, and Hold-to-Maturity Accounting,” Working Paper, Harvard Business School.
Anatomy of the Bear: Lessons From Wall Street's Four Great Bottoms
by
Russell Napier
Published 18 Jan 2016
It was thought the future earnings growth of these stocks could justify such extreme valuations. In the short term, this proved incorrect as the average price of a Nifty Fifty declined 62% in the 1973-1974 bear market. However, for those investors who hung on, the Fifty did deliver some of this promise. Professor Jeremy Siegel points out in his Stocks for the Long Run that the annual return on the Nifty Fifty from December 1972 to November 2001 was 11.62%, just below the 12.14% of the S&P Composite Index over the same period. Although equity prices rebounded strongly from the December 1974 low, 1974-82 was a period of further volatility, false dawns and poor returns.
…
Moore, Business Cycle Indicators (National Bureau of Economic Research, 1961) Ted Morgan, FDR (Grafton Books 1987) Alasdair Nairn, Engines That Move Markets:Technology Investing from Railroads to the Internet and Beyond (John Wiley & Sons, 2002) Wilbur Plummer, Social and Economic Consequences of Buying on the Instalment Plan 1927 (American Academy of Political Science, 1927) Donald T. Regan, For The Record: From Wall Street to Washington (Hutchison, 1988) Jeremy J. Siegel, Stocks For The Long Run: The Definitive Guide to Financial Market Returns and Long-Term Investment Strategies (McGraw-Hill, 3rd Ed., 2002) Mark Singer, Funny Money (Alfred A. Knopf, 1985) Robert Shaplen, Kreuger, Genius and Swindler (Alfred A Knopf, 1960) Robert J. Shiller, Irrational Exuberance (Princeton University Press, 2000) Robert J.
Portfolio Design: A Modern Approach to Asset Allocation
by
R. Marston
Published 29 Mar 2011
Sharpe, William F., 1974, “Imputing Expected Security Returns from Portfolio Composition,” Journal of Financial and Quantitative Analysis, (June), 463– 472. Shiller, Robert J., 2000, Irrational Exuberance, Princeton: Princeton University Press. Siegel, Jeremy J., 1998, Stocks for the Long Run, 2nd Edition. New York: McGraw Hill. Siegel, Jeremy J., 2002, Stocks for the Long Run, 3rd Edition. New York: McGrawHill. Solnik, Bruno, and Dennis McLeavey, 2004. International Investments, Boston: Pearson Addison Wesley, 5th edition. Standard and Poor’s, 2008, S&P Global Stock Markets Factbook. Standard and Poor’s, 2009, S&P Global Stock Markets Factbook.
The Ascent of Money: A Financial History of the World
by
Niall Ferguson
Published 13 Nov 2007
Sweden came next (3.71), followed by Switzerland (3.03), with Britain barely in the top ten on 2.28 per cent. Six out of the twenty-seven markets studied suffered at least one major interruption, usually as a result of war or revolution. Ten markets suffered negative long-term real returns, of which the worst were Venezuela, Peru, Colombia and, at the very bottom, Argentina (-5.36 per cent) .7 ‘Stocks for the long run’ is very far from being a universally applicable nostrum.8 It nevertheless remains true that, in most countries for which long-run data are available, stocks have out-performed bonds - by a factor of roughly five over the twentieth century.9 This can scarcely surprise us. Bonds, as we saw in Chapter 2, are no more than promises by governments to pay interest and ultimately repay principal over a specified period of time.
…
Minsky, ‘Longer Waves in Financial Relations: Financial Factors in the More Severe Depressions’, American Economic Review, 54, 3 (May 1964), pp. 324-35; idem, ‘Financial Instability Revisited: The Economics of Disaster’, in idem (ed.), Inflation, Recession and Economic Policy (Brighton, 1982), pp. 117-61. 4 Kindleberger, Manias, p. 14. 5 ‘The Death of Equities’, Business Week, 13 August 1979. 6 ‘Dow 36,000’, Business Week, 27 September 1999. 7 William N. Goetzmann and Philippe Jorion, ‘Global Stock Markets in the Twentieth Century’, Journal of Finance, 54, 3 (June 1999), pp. 953-80. 8 Jeremy J. Siegel, Stocks for the Long Run: The Definitive Guide to Financial Market Returns and Long-Term Investment Strategies (New York, 2000). 9 Elroy Dimson, Paul Marsh and Mike Stanton, Triumph of the Optimists: 101 Years of Global Investment Returns (Princeton, 2002). 10 Paul Frentrop, A History of Corporate Governance 1602-2002 (Brussels, 2003), pp. 49-51. 11 Ronald Findlay and Kevin H.
Panderer to Power
by
Frederick Sheehan
Published 21 Oct 2009
For those who were there, the flesh may crawl. For those who weren’t, it was just beginning. The Great Garbage Market of 1968 was invoked as comparison. But the garbage grew more expensive from 1996 to 2000. There were boosters other than Greenspan. Professor Jeremy Siegel had written a best seller: Stocks for the Long Run. He theorized that stocks are always the best-performing asset if you wait long enough. Or something like that. It didn’t matter. They bought the book and bought stocks. In The Autumn of the Middle Ages, Johan Huizinga wrote: “[T]he whole of intellectual life [of the late Middle Ages] sought concrete expression, as if the notion of gold was immediately minted into coin.
…
Our age of turbulence has shackled Americans to financial markets to a degree that was—literally—unthinkable a generation ago. A large proportion of Americans knew nothing about the stock market or the concept of a bond or the structure of a mutual fund. They were perfectly content to save and watch their dollars accumulate. Such proposals as “stocks for the long run” were directed at a small segment of the population. The Federal Reserve—or, rather, central banking as a whole—is not the sole cause of disturbances, but neither is it what it pretends to be. Alan Greenspan condemned asset inflation during the 1950s and 1960s; by the 1990s, he claimed that it didn’t exist, and even if it did, there was nothing that the Federal Reserve could do, since it could not recognize a bubble.
The Little Book of Common Sense Investing: The Only Way to Guarantee Your Fair Share of Stock Market Returns
by
John C. Bogle
Published 1 Jan 2007
It is quite remarkable that people think that somehow a scheme that weights stocks differently than capitalization can dominate a capitalization-weighted index. . . . New paradigms come and go. Betting against the market (and spending a considerable amount of money to do so) is indeed likely to be a hazardous undertaking.” * * * Finally, consider this affirmation of traditional indexing from Wharton School professor Jeremy Siegel, author of Stocks for the Long Run and adviser to WisdomTree Investments, the promoter of the dividend-driven factor model. “It can be shown that maximum diversification is achieved by holding each stock in proportion to its value to the entire market [italics added]. . . . Hindsight plays tricks on our minds . . . often distorts the past and encourages us to play hunches and outguess other investors, who in turn are playing the same game.
Expected Returns: An Investor's Guide to Harvesting Market Rewards
by
Antti Ilmanen
Published 4 Apr 2011
This premium was only half a percent over the 19th century but 10 times higher in the 20th century [2]. Since the Civil War (1861–1865), U.S. equities almost never underperformed bonds over a 20-year window. This consistency of long-horizon outperformance was made famous by Jeremy Siegel’s book, Stocks for the Long Run, first published in 1994. However, the DMS data remind us that in other countries there have been many examples of negative 20-year equity premia—most recently, of course, in Japan. During the early 2009 trough, U.S. equities had underperformed bonds over 20 years. If stocks are compared with 20-year Treasuries (rather than the 10-year bonds used in Figure 8.2), they had even underperformed over a time span in excess of 40 years (November 30, 1968 to March 31, 2009), by far the longest window since the Civil War.
…
Endowments, foundations, and sovereign wealth funds are closest to having permanent capital, but the first two have recurring spending needs each year, whereas the sovereign wealth funds of some commodity-rich countries can expect their net inflows to grow for another decade and net outflows to start only in the distant future. Time diversification Time diversification—the idea that stock market investing becomes less risky with a longer horizon—is a contentious issue. Jeremy Siegel, who wrote several editions of a book entitled Stocks for the Long Run, has studied over two centuries of U.S. equity market returns and publicized the empirical fact that, although short-term returns are nearly as likely to be down as up, the probability of losing money over a 20-year window has been negligible. Realized variances of annualized returns over long horizons are significantly lower than those over short horizons.
…
Shleifer, Andrei (2000), Inefficient Markets: An Introduction to Behavioral Finance, Oxford University Press. Shleifer, Andrei; and Robert W. Vishny (1997), “The limits of arbitrage,” Journal of Finance 52(1), 35–55. Sias, Richard (2007), “Causes and seasonality of momentum profits,” Financial Analysts Journal 63(2), 48–54. Siegel, Jeremy J. (2002), Stocks for the Long Run (Third Edition), New York: McGraw-Hill. Siegel, Laurence B. (2008), “Alternatives and liquidity,” Journal of Portfolio Management 35(1), 103–114. Siegel, Laurence B. (2009), “A riskless society is unattainable and infinitely expensive,” in Insights into the Global Financial Crisis (L.B.
Big Mistakes: The Best Investors and Their Worst Investments
by
Michael Batnick
Published 21 May 2018
It's not just the highfliers that get cut in half. Anything that compounds for a long time must decompound at some point in time. The Dow is up 26, 400% since 1914, but it lost 30% on nine separate occasions. It lost 90% of its value during the Great Depression, and it wouldn't break through the 1929 highs until 1955. Talk about stocks for the long run! The Dow, which is the blue chip index, has suffered two massive drawdowns in the first decade of the twenty‐first century (–38% in the tech bubble and –54% in the great financial crisis). The takeaway for mere mortals like you and me is that if you seek big returns, whether they're compressed into a few years or over our investing lifetime, big losses are just part of the deal.
The Psychology of Money: Timeless Lessons on Wealth, Greed, and Happiness
by
Morgan Housel
Published 7 Sep 2020
More often it’s because we’re not good at identifying what the price of success is, which prevents us from being able to pay it. The S&P 500 increased 119-fold in the 50 years ending 2018. All you had to do was sit back and let your money compound. But, of course, successful investing looks easy when you’re not the one doing it. “Hold stocks for the long run,” you’ll hear. It’s good advice. But do you know how hard it is to maintain a long-term outlook when stocks are collapsing? Like everything else worthwhile, successful investing demands a price. But its currency is not dollars and cents. It’s volatility, fear, doubt, uncertainty, and regret—all of which are easy to overlook until you’re dealing with them in real time.
Endless Money: The Moral Hazards of Socialism
by
William Baker
and
Addison Wiggin
Published 2 Nov 2009
At long last the bull market provided an escape from the dreary nihilistic world of efficient market dogma. In 1996, near the end of the best long-term equity return period of several lifetimes spanned by the Ibbotson data, appeared one Jeremy Siegel with his “definitive guide to high-return, low-risk equities,” a book for the masses titled Stocks for the Long Run. Siegel has escaped from the world of academia into the lucrative world of Wall Street through establishing WisdomTree, a provider of ETFs and mutual funds. WisdomTree tweaks the major indicies to squeeze out a slightly better return with less volatility—all based upon statistical analysis thoughtfully proven through roughly 40 years of backtesting.
…
See also Capitalism; Fiat currency; Moral hazard Soros, George, 180–181, 184–185 Sowell, Thomas, 216 Specie, 36. See also Gold; Hard money INDEX Specie Circular, 49 Spitzer, Elliot, 322, 328 “Stamped money,” 113 Stanford, Allen, 330 Stanford Capital, 26 State Children’s Health Insurance Program (SCHIP), 202 Statistical arbitrage funds, 27–28 Stocks for the Long Run (Siegel), 31 Stolo, Licinius, 246 Strong, Benjamin, 64 Study of Administration (Wilson), 288 “Subprime Fiasco Exposes Manipulation by Mortgage Brokers” (Lubove, Taub), 148 Swaps, 125 Swope, Gerard, 317 Tabulae novae, 247 Taleb, Nassim Nicholas, 15, 16, 28, 280 Tallmadge, Benjamin, 3 Taub, Daniel, 148–149 Taxation: and federal budget deficit, 189–197 flat (or fair) tax, 202–204 history of, 197–202 overview, 188–189 Taylor Rule, 75–76 Taylor, John B., 75–76 Temin, Peter, 107–108, 114 Term Securities Lending Facility, 124–125 Theory of Moral Sentiments (Smith), 264 Tiberius, 249, 258 Tides Foundation, 180, 181 Torricelli Principle, 362 Trienans, Howard, 168 Troubled Asset Relief Program (TARP), 122, 128, 130, 139, 141, 143, 152, 214, 220, 235 Truman, Harry, 289 Index Turk, James, 350 Turner, Ted, 175 Turning Point Inc., 320 UBS, 22, 173 U.S.
The Wealth Dragon Way: The Why, the When and the How to Become Infinitely Wealthy
by
John Lee
Published 13 Apr 2015
It makes sense to apply this tactic to buying property. But there's an even bigger advantage with property. Property is the most leveraged investment you can make. The difference between buying stocks and investing in property is that you can borrow most of the money to buy property. If you want to invest £100,000 in stocks for the long term, you need to find that £100,000. If you want to buy a property for £100,000, all you need is £20,000—and you can more or less guarantee that the bank will lend you the rest. If the company you bought shares in went bust, you would lose your entire £100,000. If your house fell down or got blown away in a freak storm, you would only lose £20,000.
Broken Markets: How High Frequency Trading and Predatory Practices on Wall Street Are Destroying Investor Confidence and Your Portfolio
by
Sal Arnuk
and
Joseph Saluzzi
Published 21 May 2012
Investors will start to pile back into stocks because they will believe that markets are properly valuing securities and that their orders are not bait for ultra-high-speed traders. Research and stock picking will become relevant again as margin returns to brokers who deploy capital toward the valuation of stocks for the long term. Correlation among assets will fall to more normalized levels as investors focus on individual companies, instead of mindless ETF tracking devices. Ultimately, capital will find its way back to innovative, job-creating companies. A fantasy? No. It’s all up to you. Fight for Your Rights If you’ve read this book up to this point, chances are you are as outraged as we are and want to know what you can to do protect yourself.
Personal Investing: The Missing Manual
by
Bonnie Biafore
,
Amy E. Buttell
and
Carol Fabbri
Published 24 May 2010
Stocks Bonds T-Bills -50.0% +7.4% +7.6% -1.8% +10.8% +2.6% -2.0% +8.3% -3.0% +12.5% +8.8% +1.0% -3.1% +11.5% -5.1% +16.9% +12.4% -4.1% -5.4% +14.0% -8.2% -10.1% +17.7% +26.7% -11.0% -15.1% +21.6% +41.0% +35.1% +24.7% -15.9% -31.6% -25.0% -21.9% +0.0% -15.6% +23.7% +25.0% +66.6% +50.0% -38.4% Compound annual returns +75.0% Source: Stocks for the Long Run by Jeremy J. Siegel, reprinted with permission 1 2 5 10 20 30 Years of holding period Maximum and minimum real holding period returns, 1802-1997 If your company has an employee stock purchase plan, don’t overindulge at the company stock buffet. If your company starts to struggle, you could end up out of work and losing money in your retirement plan as well.
Getting a Job in Hedge Funds: An Inside Look at How Funds Hire
by
Adam Zoia
and
Aaron Finkel
Published 8 Feb 2008
Lynch, Peter and Rothschild, John. Learn to Earn. New York: John Wiley & Sons, Inc., 1996. Malkiel, Burton G. A Random Walk Down Wall Street. New York: W.W. Norton & Company, 2003. Nicholas, Joseph. Investing in Hedge Funds: Strategies for the New Marketplace. New York: Bloomberg Press, 2005. Siegel, Jeremy J. Stocks for the Long Run. New York: McGraw-Hill, 2002. Soros, George. The Alchemy of Finance. Hoboken, N.J: John Wiley & Sons, Inc., 1987. Swensen, David F. Pioneering Portfolio Management: An Unconventional Approach to Institutional Investment. New York: The Free Press, 2000. Taleb, Nassim Nicholas. Fooled by Randomness: The Hidden Role of Chance in Life and in the Markets.

Work Optional: Retire Early the Non-Penny-Pinching Way
by
Tanja Hester
Published 12 Feb 2019
Ferri, and Laura F. Dogu (Hoboken, NJ: John Wiley and Sons, 2009). 2. Karsten Jeske, “The Ultimate Guide to Safe Withdrawal Rates—Part 1: Introduction,” Early Retirement Now. https://earlyretirementnow.com/2016/12/07/the-ultimate-guide-to-safe-withdrawal-rates-part-1-intro. 3. Jeremy J. Siegel, Stocks for the Long Run (New York: McGraw-Hill Education, 2014). 4. Robert S. Weiss, The Experience of Retirement (Ithaca, NY: ILR Press, 2005). Chapter 7: Your Financial Roadmap to a Work-Optional Life 1. Thomas J. Stanley and William D. Danko, The Millionaire Next Door: The Surprising Secrets of America’s Wealthy (New York: Simon & Schuster Pocket Books, 1996).
Investment Banking: Valuation, Leveraged Buyouts, and Mergers and Acquisitions
by
Joshua Rosenbaum
,
Joshua Pearl
and
Joseph R. Perella
Published 18 May 2009
Mason, OH: Cengage Learning, 2009. Schwert, G. William. “Hostility in Takeovers: In the Eyes of the Beholder?” Journal of Finance 55 (2000): 2599-2640. Scott, David L. Wall Street Words: An A to Z Guide to Investment Terms for Today’s Investor. 3rd ed. Boston: Houghton Mifflin, 2003. Siegel, Jeremy J. Stocks for the Long Run. 4th ed. New York: McGraw-Hill, 2007. Sherman, Andrew J., and Milledge A. Hart. Mergers & Acquisitions From A to Z. 2nd ed. New York: AMACOM, 2006. Slee, Robert T. “Business Owners Choose a Transfer Value.” Journal of Financial Planning 17, no. 6 (2004): 86-91. Slee, Robert T. Private Capital Markets: Valuation, Capitalization, and Transfer of Private Business Interests.
Mastering the Market Cycle: Getting the Odds on Your Side
by
Howard Marks
Published 30 Sep 2018
In December 1996, when the S&P 500 index of equities stood at 721, Fed Chairman Alan Greenspan asked, “How do we know when irrational exuberance has unduly escalated asset values?” But he was never heard from again on this subject, even as the S&P more than doubled to a high of 1527 in 2000. In 1994, Prof. Jeremy Siegel of the Wharton School published his book Stocks for the Long Run, in which he pointed out that there had never been a long period of time in which stocks had failed to outperform bonds, cash and inflation. Whereas researchers at the University of Chicago had earlier concluded that the normal return on U.S. equities was in the vicinity of 9% per year, in the 1990s the average return on the S&P was nearly 20%.
file:///C:/Documents%20and%...
by
vpavan
They are a good way to start your own research, but consider them just one more piece of information. Never buy a stock based solely on an analyst's recommendation. Instead, ask yourself: Is the stock right for me because it helps diversify my portfolio, or because it helps me meet an asset allocation goal? Am I expecting to hold the stock for the long term? Do I understand the company, and why I'd like to own it? Do I understand it well enough to know why I might want to sell the stock, beyond a short-term failure to meet analysts' expectations? Answering these questions in the affirmative is enough to justify owning a stock— far more than any analyst's say-so.
The Bogleheads' Guide to Investing
by
Taylor Larimore
,
Michael Leboeuf
and
Mel Lindauer
Published 1 Jan 2006
Most of us have no chance of being as good as the average in any pursuit where others practice and hone skills for many, many hours. But we can be as good as the average investor in the stock market with no practice at all. Jeremy Siegel, Professor of Finance, Wharton School, University of Pennsylvania, and author of Stocks for the Long Run n his outstanding book The Four Pillars oflnvesting, William Bernstein writes: "The stockbroker services his clients in the same way that Bonnie and Clyde serviced banks." While most won't publicly admit it, the vast majority of stockbrokers, mutual fund managers, sellers of investment products, and money managers don't earn their keep.

Nothing but Net: 10 Timeless Stock-Picking Lessons From One of Wall Street’s Top Tech Analysts
by
Mark Mahaney
Published 9 Nov 2021
The stock move was almost always exaggerated versus the fundamentals move, which created DHQ opportunities. The key point of this lesson is: Quarters are hard to predict, and the trades around quarters can be misleading. Stay focused on the long term and ignore short-term stock price fluctuations. Plenty of great financial books will advise you to avoid short-term trading and invest in stocks for the long run. That’s my advice too. I’m just making the advice more graphic, more memorable, and, frankly, more actionable, because I know how strong the demand is for these short-term quarter trades. I’ve got the call logs to prove it. THE EXPECTATIONS GAME . . . OR WHEN A BEAT IS NOT ENOUGH—SNAPCHAT The March quarter 2019 earnings results of Snap (first known as Snapchat) provide a great example of how playing a quarter would have meant missing a great investment opportunity.
All About Asset Allocation, Second Edition
by
Richard Ferri
Published 11 Jul 2010
A sensible life-long saving and investing handbook for all investors. Published in 2003 by McGraw-Hill. 319 320 APPENDIX B A Random Walk Down Wall Street, by Burton G. Malkiel. A comprehensive look at today’s market and what is driving it. 9th edition, published in 2007 by W. W. Norton & Company. Stocks for the Long Run, by Jeremy Siegel. A classic book about investing, with market data going back 200 years. 4th edition, published in 2007 by McGraw-Hill. Winning the Loser’s Game, by Charles Ellis. A classic book on how to increase returns and decrease risk through investment policy and indexing. 5th edition, published in 2009 by McGraw-Hill.
Value Investing: From Graham to Buffett and Beyond
by
Bruce C. N. Greenwald
,
Judd Kahn
,
Paul D. Sonkin
and
Michael van Biema
Published 26 Jan 2004
Chapter Four We owe the analysis of Hudson General to Mario J. Gabelli, whose investment company was a major shareholder of the firm, and who presented this material in Bruce Greenwald's course on value investing at the Graduate School of Business, Columbia University. Chapter Eight Jeremy J. Siegel, Stocks for the Long Run: A Guide to Selecting Markets for Longterm Growth (Burr Ridge, 11: Irwin Professional Publishing, 1994), p. 31. Warren Buffett The Loomis passage is from Carol Loomis, "The Inside Story of Warren Buffett," Fortune, April 11, 1988, p. 28. The Web site for Berkshire Hathaway is www.berkshirehathaway.com, where the letters and much else can be found.
How to Own the World: A Plain English Guide to Thinking Globally and Investing Wisely
by
Andrew Craig
Published 6 Sep 2015
Big Money, Little Effort a Winning Strategy for Profitable Long-Term Investment. London: Kogan Page Publishers, 2008. ———. The Next Big Investment Boom: Learn the Secrets of Investing from a Master and How to Profit from Commodities. London: Kogan Page Publishing, 2008. Siegel, Jeremy J. Stocks for the Long Run: The Definitive Guide to Financial Market Returns and Long-Term Investment Strategies. New York: McGraw-Hill, 2008. Slater, Jim. The Zulu Principle: Making Extraordinary Profits from Ordinary Shares. London: Orion, 1992. Simmons, Matthew R. Twilight in the Desert: The Coming Saudi Oil Shock and the World Economy.
Reimagining Capitalism in a World on Fire
by
Rebecca Henderson
Published 27 Apr 2020
She argued that since SASB’s airline metrics included both measures of the firm’s relationship with its workforce and of its approach to sustainability, issuing such a report would be a powerful way to help communicate the firm’s long-term, growth-orientated outlook, particularly since JetBlue was significantly ahead of its competitors on both dimensions. In talking about the decision later, she said: Ultimately, what we want to do is… increase the value of our shares, diversify our investor base, (and) reduce volatility in the stock. So we want shareholders to believe in our stock for the long run. Our investors are our owners, and they deserve to have information in the way they want it—particularly as it relates to the major environmental and social mega trends pressuring the industry. Sustainability reporting has shifted from being about storytelling to being about model orientated data sharing.
Fixed: Why Personal Finance is Broken and How to Make it Work for Everyone
by
John Y. Campbell
and
Tarun Ramadorai
Published 25 Jul 2025
Campbell, “Restoring rational choice: The challenge of consumer financial regulation,” Ely Lecture, American Economic Review: Papers and Proceedings 106 (2016): 1–30, for more details on the growing popularity of target date funds. 23. Campbell and Viceira, Strategic Asset Allocation; John Y. Campbell, Y. Lewis Chan, and Luis M. Viceira, “A Multivariate Model of Strategic and Asset Allocation,” Journal of Financial Economics 67 (2003): 41–80; and Jeremy J. Siegel, Stocks for the Long Run: The Definitive Guide to Financial Market Returns and Long-Term Investment Strategies, 6th ed. (McGraw-Hill, 2022). A simple way to see the point is that sustainable income generated by wealth W with return R is the product R × W. If W rises when R declines, the product R × W can remain stable over time. 24.
The Road to Ruin: The Global Elites' Secret Plan for the Next Financial Crisis
by
James Rickards
Published 15 Nov 2016
There’s no reason for you to facilitate the looting or be a victim. Hedge funds are a challenging case. They work in theory, not in practice. Hedge funds aim to produce real risk-adjusted returns, known as alpha. This is done through market timing, long-short strategies, and arbitrage. Investors who are long stocks for the long run endure periodic crashes and prolonged bear markets to enjoy spectacular bull markets. The problem is we may not live long enough to recover severe losses, or we may be forced sellers (tuition, anyone?) at market lows. Hedge funds purport to outperform long-only portfolios. Paths to outperformance—market timing and long-short strategies—are easy to describe, yet real talent is difficult to find.
The Permanent Portfolio
by
Craig Rowland
and
J. M. Lawson
Published 27 Aug 2012
That reality is that bonds can outperform stocks over some periods, and sometimes those periods can be very long (a decade plus). The problem is you simply won't know ahead of time when this can happen, which is why you need to always hold bonds no matter what someone else is advising. Jeremy Siegel, author of Stocks for the Long Run, said in a phone interview for Bloomberg News on October 31, 2011: The bond market posted its first 30-year gain over the stock market in more than a century during the period ended Sept. 30. The last time was in 1861, leading into the Civil War, when the U.S. was moving from farm to factory.
The Bond King: How One Man Made a Market, Built an Empire, and Lost It All
by
Mary Childs
Published 15 Mar 2022
Years later, after it was cemented in the lexicon, and as Gross and El-Erian began a passive-aggressive tug-of-war over the term’s paternity, Gross would lament that Pimco had never trademarked it. The “new normal” outlook made the case for bonds, and in turn for Pimco. Gross told AOL.com in February 2009 that stocks were dead: “Stocks will be more of a subordinated income vehicle as opposed to a ‘stocks for the long run’ growth vehicle,” he said. “Risk-taking has been destroyed[,] and any animal spirits must come from Washington.” Despite this unequivocal statement, he was about to charge in the opposite direction, in concert with a new authority figure in his life; his own animal spirits, and Pimco’s, were soaring
Efficiently Inefficient: How Smart Money Invests and Market Prices Are Determined
by
Lasse Heje Pedersen
Published 12 Apr 2015
Furthermore, they study the accounting numbers, trying to assess their reliability and to estimate future cash flows. Equity long–short managers mostly bet on specific companies, but they can also take views on whole industries. Some equity managers, called value investors, focus on buying undervalued companies and holding these stocks for the long term. Warren Buffett is a good example of a value investor. Implementing this trading strategy often requires being contrarian, since companies only become cheap when other investors abandon them. Hence, cheap stocks are often out of favor or bought during times when others panic. Going against the norm is harder than it sounds, as traders say: It’s easy to be a contrarian, except when it’s profitable.
A Random Walk Down Wall Street: The Time-Tested Strategy for Successful Investing
by
Burton G. Malkiel
Published 10 Jan 2011
Albert Einstein described compound interest as the “greatest mathematical discovery of all time.” It may sound complicated, but it simply involves earning a return not only on your original investment but also on the accumulated interest that you reinvest. Jeremy Siegel, author of the excellent investing book Stocks for the Long Run, has calculated the returns from a variety of financial assets from 1800 to 2010. His work shows the incredible power of compounding. One dollar invested in stocks in 1802 would have grown to almost $11 million by the end of 2009. This amount far outdistanced the rate of inflation as measured by the consumer price index (CPI).
The Global Money Markets
by
Frank J. Fabozzi
,
Steven V. Mann
and
Moorad Choudhry
Published 14 Jul 2002
Once these concerns abated, spreads quickly returned to more normal levels. Another pattern evident in these data is the downward trend in the spread between 3-month LIBOR and 3-month Treasury bills. To see this, we computed summary statistics for each calendar year: mean, standard 15 Jeremy J. Siegel, Stocks for the Long Run (New York, NY: McGraw-Hill, 1998). 39 U.S. Treasury Bills deviation, minimum and maximum. These results are presented in Exhibit 3.8. Two trends are evident: (1) the mean spreads fell over the 1987–1999 period and (2) except for the uptick in volatility in 1998–1999, volatility trends downward as well.16 The explanation is simple.
Your Money: The Missing Manual
by
J.D. Roth
Published 18 Mar 2010
If you want to achieve your big goals over the long term, you need to do more than just boost your cash flow and stick money in savings. The best way to do this is to invest in the stock market because, over the long-term, stocks offer the best possible return. (When talking about investments, your return is the amount you earn or lose.) How Much Do Stocks Actually Earn? In his book Stocks for the Long Run (McGraw-Hill, 2008), Jeremy Siegel analyzes the historical performance of several types of investments (economists call them asset classes). He tries to answer the question "How much does the stock market actually return?" After crunching lots of numbers, Siegel found that since 1926: Stocks have returned an average of about 10% per year.

Against the Gods: The Remarkable Story of Risk
by
Peter L. Bernstein
Published 23 Aug 1996
Journal of Financial Economics, Vol. 13, No. 2, pp. 253-282. Shiller, Robert J., 1981. "Do Stock Prices Move Too Much?" American Economic Review, Vol. 71, No. 3 (June), pp. 421-436. Shiller, Robert J., 1989. Market Volatility. Cambridge, Massachusetts: Cambridge University Press. Siegel, Jeremy J., 1994. Stocks for the Long Run: A Guide to Selecting Markets for Long-Term Growth. Burr Ridge, Illinois: Irwin Professional Publishing. Siskin, Bernard R., 1989. What Are the Chances? New York: Crown. Skidelsky, Robert, 1986. Jahn Maynard Keynes. Vol. 1: Hopes Betrayed. New York: Viking. Slovic, Paul, Baruch Fischoff, and Sarah Lichtenstein, 1990.
The Missing Billionaires: A Guide to Better Financial Decisions
by
Victor Haghani
and
James White
Published 27 Aug 2023
In contrast, textbooks written for university courses on financial decision‐making closely agree.1 Given this harmony among professors writing textbooks, you'd think that when they turn their attention to writing books for a wider, nonacademic audience, they'd deliver a consistent, unified message. Alas, this is not the case. For example, one distinguished professor writes a book titled A Random Walk Down Wall Street, and another gives us A Nonrandom Walk Down Wall Street. We have one advocating investing heavily in Stocks for the Long Run, and another warning us of stock market Irrational Exuberance. Some tell us to only invest in low‐cost index funds, while another, in The Little Book That Beats the Market, suggests we invest in a handful of stocks that will deliver exceptional returns. Then there are two MIT‐minted professors, one who suggests we should Risk Less and mostly invest in safe government bonds, while the other advocates that young adults hold a three times leveraged exposure to stocks.

Red-Blooded Risk: The Secret History of Wall Street
by
Aaron Brown
and
Eric Kim
Published 10 Oct 2011
It cannot grow passively by having its stock price go up and thereby be a larger part of the market, so index fund investors will allocate more of their portfolio to it. MPT CAPM is neutral to growth. The expected return on a stock is determined by its correlation with the market, so the stock is an equally good buy at $1, $10, $100, or $1,000. With index investors on the sidelines—holding “stocks for the long run”—stock valuations will be determined by battles between fundamental investors, who sell stocks when the price rises above fundamental economic value, and momentum investors, who buy a stock when it is going up. The problem is that even if the fundamental investors win almost all the battles, fundamental victory means only that the stock goes to its true value.
Narrative Economics: How Stories Go Viral and Drive Major Economic Events
by
Robert J. Shiller
Published 14 Oct 2019
New York: Lexington Books. Shleifer, Andrei, and Robert W. Vishny. 1997. “The Limits of Arbitrage.” Journal of Finance 52(1):35–55. Sidis, Boris. 1898. The Psychology of Suggestion: A Research into the Subconscious Nature of Man and Society. New York: Appleton & Co. Siegel, Jeremy J. 2014 [1994]. Stocks for the Long Run. New York: Irwin. Silber, William. 2014. When Washington Shut Down Wall Street: The Great Financial Crisis of 1914 and the Origins of America’s Monetary Supremacy. Princeton, NJ: Princeton University Press. Silver, David, et al. 2017. “Mastering Chess and Shogi by Self-Play with a General Reinforcement Learning Algorithm.”
Investing Amid Low Expected Returns: Making the Most When Markets Offer the Least
by
Antti Ilmanen
Published 24 Feb 2022
Shleifer, Andrei (2019), “The return of survey expectations,” NBER Reporter No.1, 14–17. Shleifer, Andrei; and Robert W. Vishny (1997), “The limits of arbitrage,” Journal of Finance 52(1), 35–55. Sialm, Clemens; and Nathan Sosner (2018), “Taxes, shorting, and active management,” Financial Analysts Journal 74(1), 88–107. Siegel, Jeremy J. (1994), Stocks for the Long Run, McGraw Hill. Siegel, Jeremy J. (2016), “The Shiller CAPE ratio: A new look,” Financial Analysts Journal 72(3), 41–50. Siegel, Laurence B.; Barton Waring; and Matthew Scanlan (2009), “Five principles to hold onto (even when your boss says the opposite),” Journal of Portfolio Management 35(2), 25–41.
Why Stock Markets Crash: Critical Events in Complex Financial Systems
by
Didier Sornette
Published 18 Nov 2002
Inefficient Markets: An Introduction to Behavioral Finance (Oxford University Press, New York). 377. Sieck, W. and Yates, J. F. (1997). Exposition effects on decision making: Choice and confidence in choice, Organizational Behavior & Human Decision Processes 70, 207–219. 378. Siegel, J. J. (1998). Stocks for the Long Run, 2nd ed. (McGraw Hill, New York). 379. Simon, H. (1982). Models of Bounded Rationality, Vols. 1 and 2 (MIT Press, Cambridge, MA). 380. Simon, J. L. (1996). The Ultimate Resource 2? (Princeton University Press, Princeton, NJ). 381. Sircar, K. R. and Papanicolaou, G. (1998). General Black-Scholes models accounting for increased market volatility from hedging strategies, Applied Mathematical Finance 5, 45–82. 382.
The Joys of Compounding: The Passionate Pursuit of Lifelong Learning, Revised and Updated
by
Gautam Baid
Published 1 Jun 2020
The risks of being out of the game are huge compared to the risks of being in it [emphasis added].5 Why does Buffett constantly emphasize that investors are in a game that is “heavily stacked in their favor”? Look at figure 26.2. If more than two centuries of data cannot convince you that what Buffett says is true, then probably nothing will. FIGURE 26.2 Total real returns on U.S. stocks, bonds, bills, gold, and the dollar, 1802–2012. Source: Jeremy Siegel, Stocks for the Long Run (New York: McGraw-Hill, 2014). Looking at figure 26.2, we can clearly understand why Buffett has warned against treating cash-equivalent holdings and currency-denominated instruments as risk-free assets, because holding them over long periods is actually quite risky. Buffett views risk as loss of purchasing power.
The Enlightened Capitalists
by
James O'Toole
Published 29 Dec 2018
“In sum,” as Bob Haas explained to me some thirty-two years after our first discussion, “we were pinched from above and below: ‘The Jaws of Death,’ as a former Levi’s executive dubbed it.” Moreover, as all those untoward changes were occurring, the character of Wall Street was being transformed. Once home to patient investors who held stock for the long term, now it was the domain of restless speculators demanding high (and quick) financial returns from companies they assumed they “owned.” In effect, Wall Street had come to expect exactly what Levi Strauss was unable to deliver in the early 1980s—high quarterly profits—and that failure caused Levi’s investors to demand drastic changes in the corporation’s strategy, practices, products, and governance.
The Age of Turbulence: Adventures in a New World (Hardback) - Common
by
Alan Greenspan
Published 14 Jun 2007
"The World Distribution of Income (Estimated from Individual C o u n t r y Distributions)." NBER Working Papers 8 9 3 3 (2002). Schumpeter, Joseph Alois. Capitalism, Socialism and Democracy. N e w York: Harper & Row, 1975. Sen, Amartya. "Democracy as a Universal Value." Journal of Democracy 10, no. 3 (1999): 3 - 1 7 . Siegel, Jeremy J. Stocks for the Long Run: The Definitive Guide to Financial Market Returns and Long-Term Investment Strategies. N e w York: McGraw-Hill, 2002. Smith, Adam. An Inquiry into the Nature and Causes of the Wealth of Nations. 5th ed. London: M e t h u e n & Co., 1904. h t t p : / / w w w .econlib.org/library/Smith/smWN.html (accessed March 24, 2 0 0 7 ) . .
Valuation: Measuring and Managing the Value of Companies
by
Tim Koller
,
McKinsey
,
Company Inc.
,
Marc Goedhart
,
David Wessels
,
Barbara Schwimmer
and
Franziska Manoury
Published 16 Aug 2015
Similarly, market bubbles and crises have always captured public attention, fueling the belief that the stock market moves in chaotic ways, detached EXHIBIT 5.2 Distribution of Growth Rates for Growth and Value Stocks Growth stocks do not grow materially faster . . . . . . but do have higher ROICs Value median Growth median 8.7% 10.2% Value median Growth median 15% 35% 14 35 Growth 12 30 10 Value 8 6 % of companies % of companies Growth 25 20 15 4 10 2 5 Value 0 0 –3 1 5 9 13 17 21 3-year average sales growth, % 25 –5 5 15 25 35 45 50+ 3-year average ROIC excluding goodwill, % MARKETS AND FUNDAMENTALS: THE EVIDENCE 69 EXHIBIT 5.3 Stock Performance against Bonds in the Long Run, 1801–2013 $ 100,000,000 Stocks 10,000,000 1,000,000 Stocks (inflation-adjusted) 100,000 Bonds 10,000 Bills 1,000 100 10 CPI 1 0 1801 1816 1831 1846 1861 1876 1891 1906 1921 1936 1951 1966 1981 1996 2011 Source: Jeremy J. Siegel, Stocks for the Long Run: The Definitive Guide to Financial Market Returns and Long-Term Investment Strategies (New York: McGrawHill; 2014); Ibbotson Associates; Morningstar EnCorr SBBI Index Data. from economic fundamentals. The 2008 financial crisis, the technology bubble of the 1990s, the Black Monday crash of October 1987, the leveraged-buyout (LBO) craze of the 1980s, and, of course, the Wall Street crash of 1929 appear to confirm such ideas.
Corporate Finance: Theory and Practice
by
Pierre Vernimmen
,
Pascal Quiry
,
Maurizio Dallocchio
,
Yann le Fur
and
Antonio Salvi
Published 16 Oct 2017
Amihud, The liquidity route to a lower cost of capital, Journal of Applied Corporate Finance, 12(4), 8–25, Winter 2000. For a comprehensive review of risk premiums: W. Goetzmann, R. Ibbotson, The Equity Risk Premium: Essays and Explorations, Oxford University Press, 2006. R. Mehra, Handbook of the Equity Risk Premium, Elsevier Science, 2007. J. Siegel, Stock for the Long Run, 4th edn, McGraw-Hill, 2007. On risk premiums: R. Arnott, P. Bernstein, What risk premium is “normal”?, Financial Analysts Journal, 58(2), 64–85, March–April 2002. S. Brown, W. Goetzmann, S. Ross, Survivorship bias, Journal of Finance, 50(3), 853–873, July 1995. J. Claus, J. Thomas, Equity premia as low as three percent?